

What Is Spatial Metabolomics?
From Bulk Metabolomics to Spatially Resolved Analysis
Conventional liquid chromatography–mass spectrometry (LC-MS)-based metabolomics provides a rich inventory of metabolites present in a biological sample, but it does so at a fundamental cost: tissue architecture is destroyed during homogenization. Every spatial relationship — which metabolites localize to the tumor core versus the invasive margin, which lipids concentrate in white matter versus gray matter — is lost the moment the sample enters the extraction tube.
Spatial metabolomics addresses this information gap by coupling mass spectrometry imaging (MSI) with histological context. Rather than grinding tissue into a homogeneous lysate, MSI maps metabolites directly onto tissue sections, generating two-dimensional ion intensity maps registered to anatomical features. The result is a chemical photograph: each pixel in the image carries a full mass spectrum, and each m/z value can be rendered as a heatmap revealing where that ion concentrates within the tissue architecture.
The Information Gain: Why Location Matters in Metabolite Biology
The biological rationale for spatial resolution extends beyond visualization. Metabolite concentration gradients drive fundamental processes — immune cells infiltrating tumors follow chemokine and metabolic gradients, neurons maintain distinct axonal versus somatic metabolite pools, and drug candidates succeed or fail based on whether they penetrate hypoxic tumor cores at pharmacologically relevant levels. A bulk LC-MS/MS untargeted metabolomics measurement can report that a metabolite is elevated in diseased tissue but cannot distinguish enrichment in the affected cells from accumulation in the surrounding stroma or infiltrating immune population. Spatial metabolomics resolves this ambiguity by pinning each molecular measurement to a tissue coordinate.
This capability has transformed how researchers approach questions in oncology, neuroscience, drug development, and plant biology. In cancer research, MSI data have revealed metabolic heterogeneity within tumors that correlates with drug response gradients. In neuroscience, region-specific metabolite distributions have uncovered previously unrecognized metabolic specialization across brain substructures. For pharmaceutical developers, the ability to simultaneously image a drug candidate and its metabolic products in target tissues — without radiolabeling — has shortened decision cycles in preclinical PK/PD studies. Creative Proteomics supports these applications through both bulk and spatially resolved metabolomics workflows, with expertise spanning untargeted discovery, targeted validation, and spatial MSI analysis.
The Core Mass Spectrometry Imaging Technology Platforms
Spatial metabolomics is not a single technology but a family of ionization modalities sharing a common workflow: a tissue section is raster-scanned, analyte ions are generated at each coordinate, and mass spectra are collected into a data cube (x, y, m/z, intensity). The ionization mechanism — how molecules are desorbed and charged from the tissue surface — defines the capabilities and limitations of each platform.
MALDI-MSI — The Workhorse
Matrix-assisted laser desorption/ionization (MALDI) is the most widely deployed MSI modality for spatial metabolomics. A UV-absorbing organic matrix (commonly DHB, CHCA, or 9-aminoacridine) is deposited onto the tissue surface, co-crystallizes with endogenous analytes, and absorbs laser energy to facilitate desorption and ionization. MALDI offers the broadest molecular coverage among MSI platforms — from small polar metabolites (m/z 50–300) to lipids (m/z 600–900) and peptides — with spatial resolution typically in the 10–50 μm range on commercial instruments (for a detailed review of instrumental capabilities, see Buchberger et al., Anal Chem, 2018).
Recent instrumental advances have shifted the resolution ceiling dramatically. Transmission-mode MALDI (t-MALDI), in which the laser fires through the back of a thin tissue section, has achieved sub-micron lateral resolution, detecting upward of 200 lipid and nucleotide species at single-cell scale. MALDI-2, a post-ionization technique that fires a second laser pulse into the desorbed plume, boosts sensitivity by two to three orders of magnitude (Soltwisch et al., Science, 2015) and expands the detectable molecular range into metabolite classes previously invisible to standard MALDI.
A deeper treatment of MALDI-specific chemistry — matrix selection logic, sublimation versus spray coating, and matrix-tissue interaction effects — is provided in our companion article on MALDI mass spectrometry imaging. For lipid-focused applications, MALDI imaging lipidomics provides dedicated workflows optimized for lipid-class detection.
DESI-MSI — Ambient Ionization Alternative
Desorption electrospray ionization (DESI) operates on a fundamentally different principle: a stream of charged solvent droplets is sprayed at the tissue surface, desorbing and ionizing analytes under ambient conditions with no matrix required. This matrix-free operation eliminates the most labor-intensive step of the MALDI workflow and preserves the tissue in a state compatible with subsequent histological staining.
DESI's spatial resolution ceiling (50–200 μm on standard configurations) is coarser than MALDI's, dictated by the spray footprint and solvent spreading on the tissue surface. However, the technique's ambient nature makes it uniquely suited for high-throughput screening and applications where sample integrity for downstream analysis is paramount. Nano-DESI, a variant using a secondary capillary to form a liquid bridge with the tissue, has pushed DESI-family resolution below 10 μm and demonstrated single-cell metabolic profiling — though at substantially lower throughput than conventional DESI.
For researchers weighing ambient versus matrix-based approaches, our article on DESI mass spectrometry imaging examines the physics, solvent optimization, and application space in detail.
SIMS — Nanoscale Resolution for Elemental and Small-Molecule Imaging
Secondary ion mass spectrometry (SIMS) occupies the extreme high-resolution end of the MSI spectrum. A focused primary ion beam (typically Bi3+, Au3+, or C60+) sputters the tissue surface, generating secondary ions that are mass-analyzed. Spatial resolution reaches 50–500 nm — two to three orders of magnitude finer than conventional MALDI — enabling subcellular metabolite localization.
The trade-off is severe: the energetic primary ion beam fragments most biomolecules, restricting intact molecular detection to elements, small fragments, and a subset of lipids below approximately m/z 1,000. For elemental mapping and isotope-tracing experiments using 13C or 15N labels, SIMS is unmatched. 3D OrbiSIMS, combining TOF-SIMS with an Orbitrap mass analyzer, has improved mass resolution and molecular identification capability at single-cell level, though throughput remains low. For most metabolomics applications requiring broad molecular coverage with intact metabolite identification, MALDI or DESI provide more practical starting points.
LA-ICP-MS — Elemental and Metallomic Mapping
Laser ablation inductively coupled plasma mass spectrometry (LA-ICP-MS) images elemental distributions — metals, metalloids, and select non-metals — at 1–10 μm resolution. It is the method of choice for spatial metallomics: mapping Fe, Cu, Zn, Mn, and Se distributions in tissue sections, which informs redox biology, metal-dependent enzyme activity, and metal-drug accumulation. LA-ICP-MS does not provide molecular information (the plasma atomizes all sample components), so it is complementary to molecular MSI rather than competitive. A full discussion appears in our article on LA-ICP-MS imaging for spatial metallomics.
Emerging Platforms: nano-DESI, IR-MALDESI, and LDI
Three emerging modalities warrant attention. Nano-DESI achieves single-cell metabolomic profiling through a nanoscale liquid bridge under ambient conditions, with the advantage that the same spot can be re-sampled or subjected to complementary extraction. IR-MALDESI (infrared matrix-assisted laser desorption electrospray ionization) uses a mid-IR laser tuned to the O–H stretching frequency of endogenous water, enabling matrix-free ablation with electrospray post-ionization — effectively combining the spatial fidelity of laser sampling with the soft ionization of ESI. Laser desorption/ionization (LDI), using nanostructured surfaces instead of organic matrices, bypasses the low-mass interference problem that plagues MALDI for sub-200 Da metabolites. These platforms are not yet as broadly deployed as MALDI or DESI, but their unique capability profiles suggest they will claim growing shares of the spatial metabolomics landscape over the next five years.
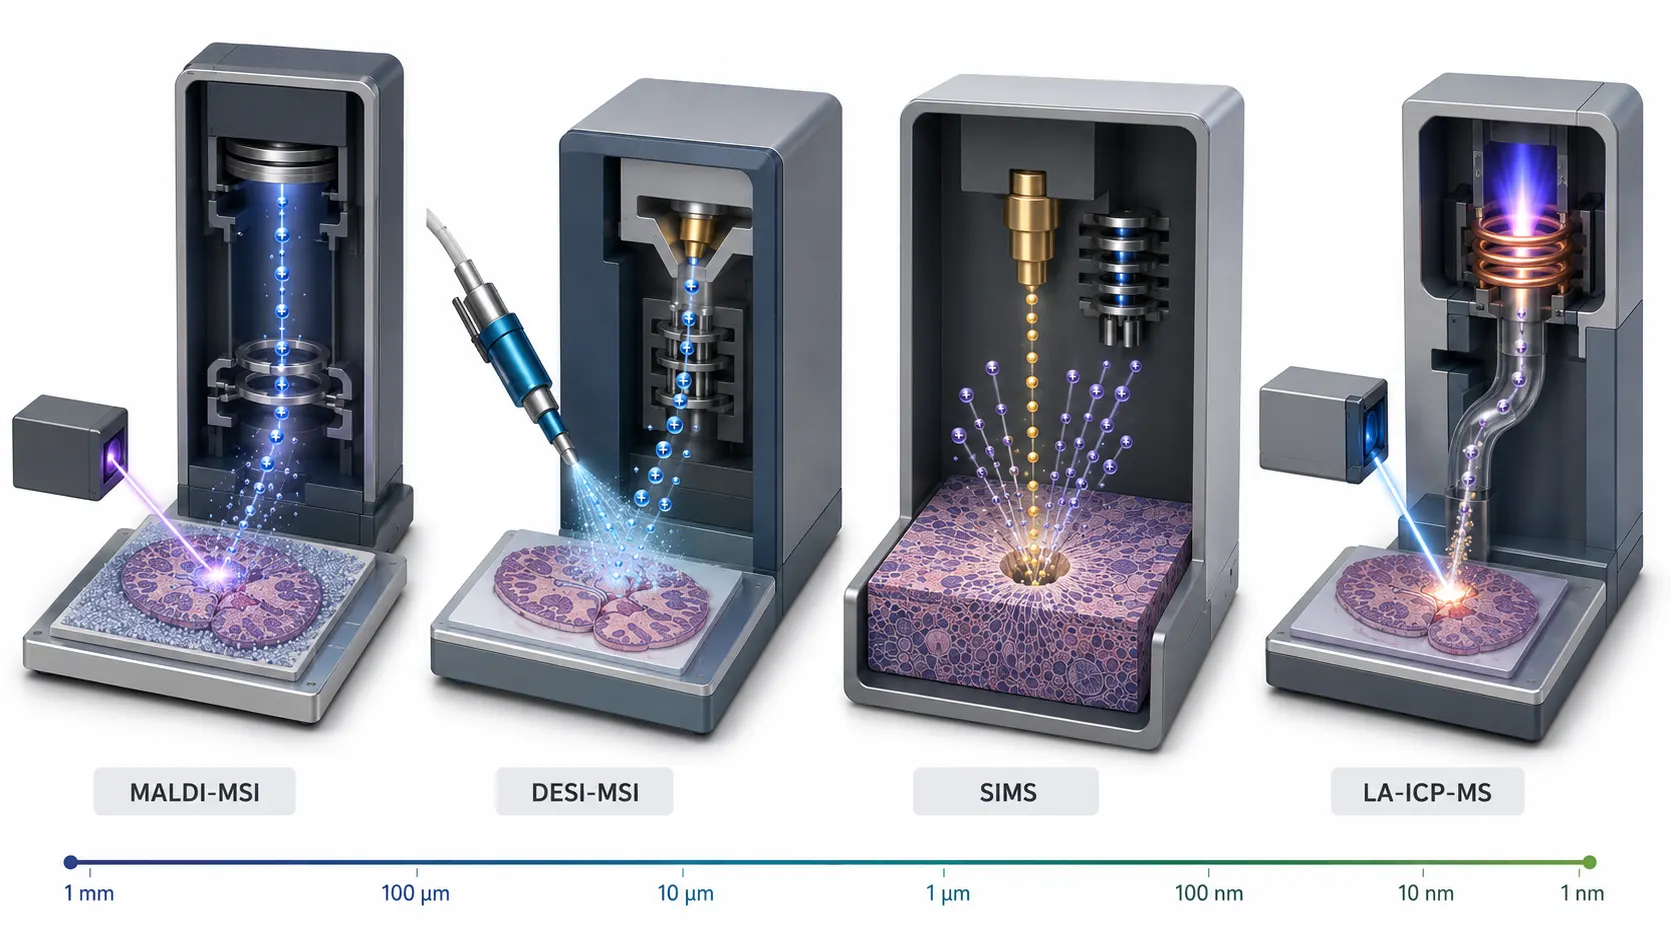 Figure 1: MSI technology landscape overview. Isometric 3D comparison showing the four major ionization platforms — MALDI, DESI, SIMS, and LA-ICP-MS — with their characteristic ion plumes, spatial resolution ranges, and detector configurations. Each platform occupies a distinct operational window defined by the interplay of ionization mechanism and mass analyzer pairing. This overview sets the stage for the four-axis decision framework introduced in Section 3.
Technology Selection Decision Framework
The question researchers ask most frequently — "which MSI platform should I use?" — has no universal answer. The right choice is a negotiation among four axes, and the dominant constraint changes from project to project. This section provides a structured decision framework organized around these four axes, concluding with a synthesis flowchart that maps typical research scenarios to platform recommendations.
Axis 1: Spatial Resolution Requirements
Spatial resolution dictates the smallest biological feature you can chemically distinguish. The requirements cascade from the biological question. At tissue-region level (100–200 μm), distinguishing cortex from medulla or tumor from adjacent normal tissue, all platforms are viable and DESI is often the most practical choice. At cellular level (5–20 μm), distinguishing individual cells and mapping tumor-immune boundaries, MALDI at 20 μm pitch or below, or nano-DESI, are indicated. At subcellular level (50 nm–1 μm), for organelle-scale localization and nuclear versus cytoplasmic metabolite partitioning, SIMS is the only current option.
An underappreciated consideration: pushing resolution upward reduces the amount of material sampled per pixel, which directly reduces ion counts and detection sensitivity. A 5-μm pixel squares samples roughly 25× less material than a 25-μm pixel square. For low-abundance metabolites, the sensitivity penalty of high resolution can erase the signal entirely. The decision is not simply "get the highest resolution available" but "match the resolution to the smallest feature your hypothesis requires."
Axis 2: Analyte Class
Different platforms favor different molecular classes. For broad metabolome coverage including lipids, polar metabolites, and peptides, MALDI with DHB or CHCA for positive mode or 9-aminoacridine for negative mode provides the best compromise. For lipids only, both MALDI and DESI perform well, with MALDI offering higher spatial resolution and DESI enabling ambient operation. For small polar metabolites below 300 Da, standard MALDI suffers matrix interference in the low-mass range; MALDI with on-tissue chemical derivatization (OTCD) or nano-DESI are superior alternatives. For elements and metals, LA-ICP-MS or SIMS are the methods of choice, sacrificing molecular information for elemental specificity. For intact proteins above 2 kDa, only MALDI is suitable. For drugs and xenobiotics, DESI is preferred for rapid screening and MALDI if higher spatial resolution is critical.
A critical nuance: matrix interference in the low-mass region (m/z < 300) is the single most common reason MALDI experiments fail to detect key metabolites. Amino acids, organic acids, and TCA cycle intermediates are frequently obscured by matrix cluster ions. On-tissue chemical derivatization (OTCD), discussed in the sample preparation section below, provides a workaround by shifting derivatized metabolites to higher mass ranges where matrix interference is negligible.
Axis 3: Sample Type and Preparation Constraints
Tissue properties constrain platform choice in ways that are often discovered only after an experiment fails. Fresh-frozen tissue is compatible with all platforms and is the gold standard. FFPE tissue restricts the researcher to MALDI and only for a restricted analyte set — primarily lipids and N-glycans, after deparaffinization and antigen retrieval, since metabolite loss during formalin fixation and paraffin embedding is extensive and irreversible. Hard or calcified tissue such as bone and cartilage requires cryofilm sectioning or EDTA decalcification; MALDI is preferred due to the physical robustness of the matrix-coated preparation. Small or irregular samples such as biopsies and isolated cells benefit from DESI's ambient nature and minimal preparation requirements. For clinical workflow compatibility, DESI's matrix-free, rapid acquisition cycle is better suited to high-throughput translational research workflows and large-cohort tissue screening studies.
Axis 4: Quantification Needs
Not all spatial metabolomics experiments require quantification — many are fundamentally discovery-phase comparisons of relative ion intensities between tissue regions. When absolute quantification is required, the platform choice matters. For relative quantification comparing Region A versus Region B, all platforms support this, with MALDI and DESI being most established and statistical normalization strategies described in our comparative spatial metabolomics guide. For absolute quantification, calibration against mimetic tissue standards with known analyte concentrations on a MALDI-QQQ platform in MRM mode provides the best sensitivity, outperforming full-scan approaches by 2- to 100-fold depending on the analyte. Our article on quantitative mass spectrometry imaging covers calibration strategies in depth. For isotope tracing with 13C or 15N, both SIMS and MALDI support isotope ratio imaging, with SIMS offering superior spatial resolution and MALDI offering broader molecular coverage.
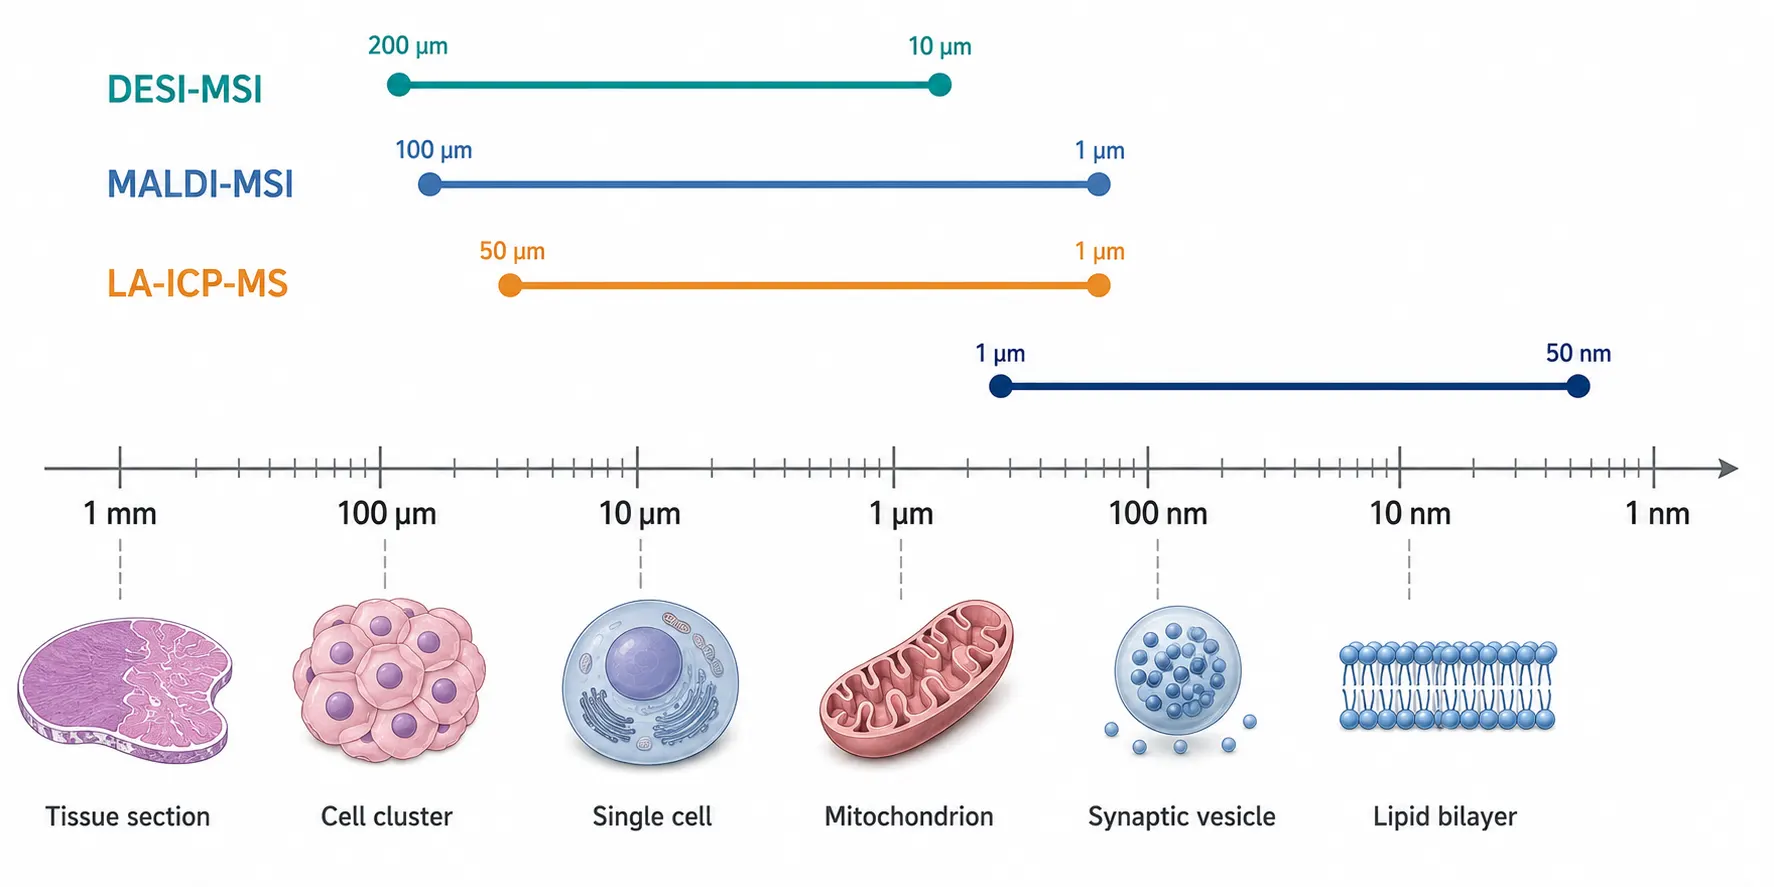 Figure 2: Spatial resolution spectrum. Horizontal infographic displaying the operational resolution ranges of DESI-MSI (200 um-10 um), MALDI-MSI (100 um-1 um), LA-ICP-MS (50 um-1 um), and SIMS (1 um-50 nm) on a logarithmic scale. Representative biological structures — tissue section, cell cluster, single cell, mitochondrion, synaptic vesicle, and lipid bilayer — are illustrated at their characteristic scales below the axis, connecting resolution to biological interpretability.
Pulling It Together: Synthesizing the Four-Axis Decision
The four axes do not operate in isolation — they interact. A project requiring cellular resolution and broad metabolome coverage on FFPE tissue faces an inherent conflict: the resolution requirement points to MALDI, the coverage requirement points to MALDI, but the sample type constraint severely restricts which metabolites can be detected regardless of platform choice. In such cases, the sample type constraint is the dominant axis, and the study must be designed around it: accept lipid-focused coverage, or prospectively collect fresh-frozen tissue.
The table below maps common research scenarios through all four axes to platform recommendations, making the constraint interactions explicit:
| Scenario | Resolution | Analyte Class | Sample | Quant | Recommendation |
|---|---|---|---|---|---|
| Tumor vs. normal metabolic discovery | Cellular (20-50 um) | Broad metabolome | Fresh-frozen | Relative | MALDI-MSI with DHB matrix |
| High-throughput drug distribution screening | Tissue-region (100 um) | Drug & metabolites | Fresh-frozen | Relative | DESI-MSI |
| Nuclear vs. cytoplasmic metabolite localization | Subcellular (100 nm) | Small molecules | Fresh-frozen, vacuum-compatible | Relative | TOF-SIMS or 3D OrbiSIMS |
| Metal accumulation in neurodegeneration | Cellular (5 um) | Elements (Fe, Cu, Zn, Mn) | Fresh-frozen | Relative or absolute | LA-ICP-MS |
| Broad metabolome from FFPE archives | Cellular (20 um) | Lipids & N-glycans only | FFPE (deparaffinized) | Relative | MALDI-MSI; acknowledge polar loss |
| Absolute drug concentration in tissue | Cellular (10 um) | Single drug analyte | Fresh-frozen | Absolute (mimetic calibrants) | MALDI-QQQ MRM mode |
When no scenario precisely matches, return to the four axes in sequence: start with the most constrained axis (often sample type or analyte class), narrow the platform options, and then optimize for resolution and quantification within the remaining candidates.
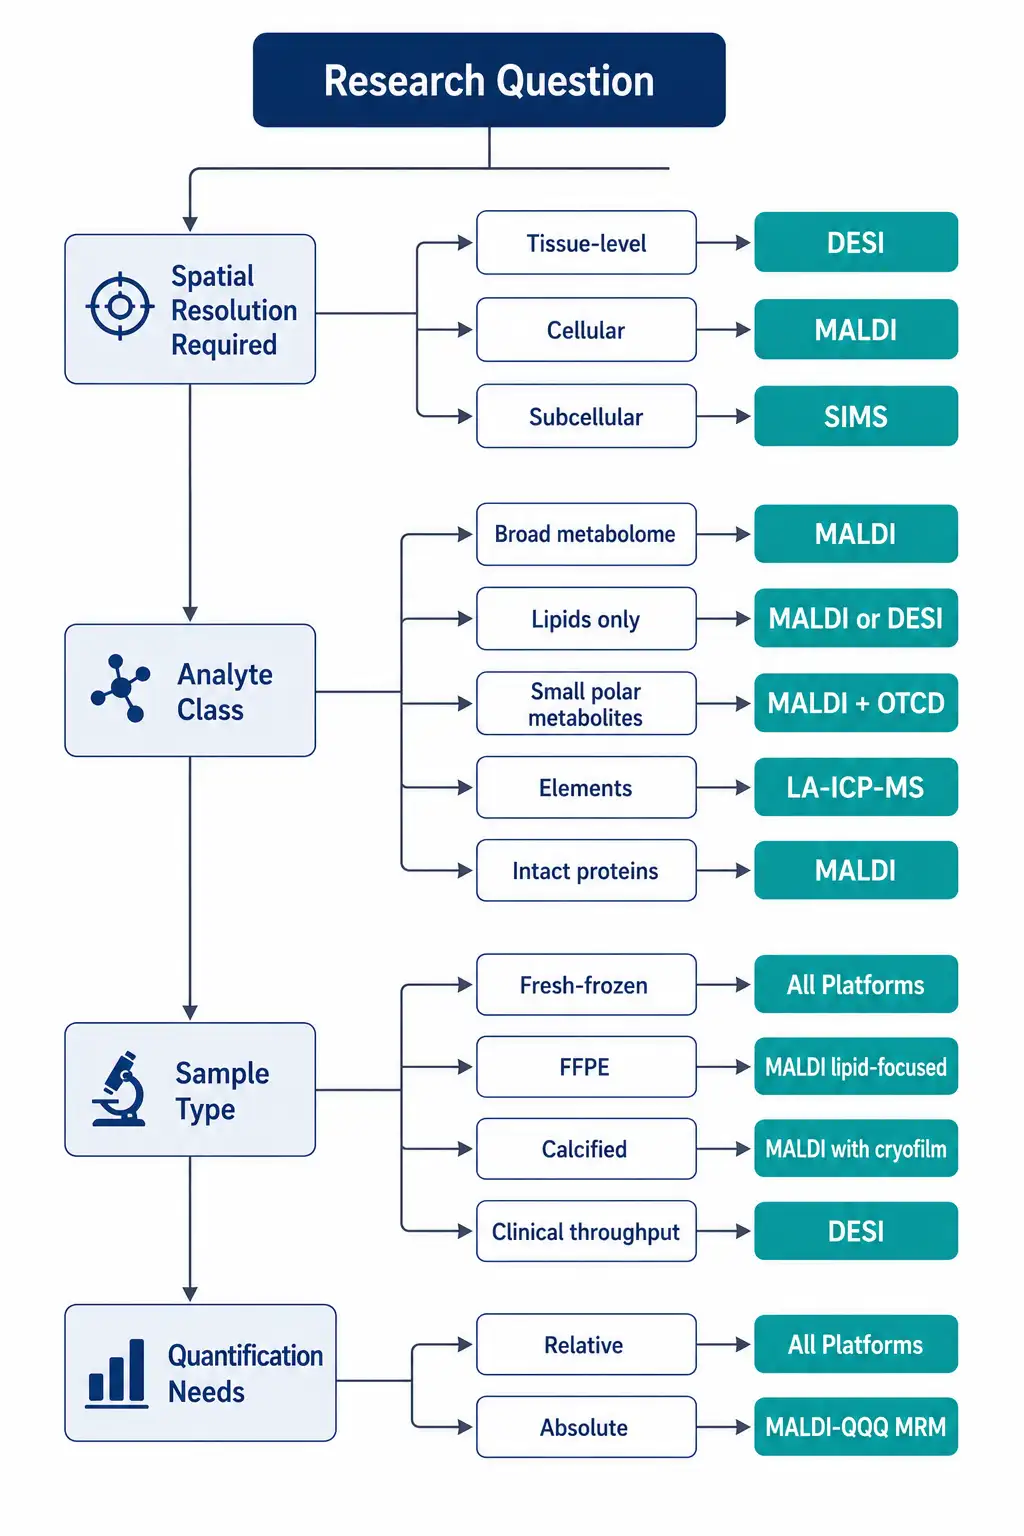 Figure 3: Technology selection decision flowchart. A branching logic diagram that operationalizes the four-axis framework by guiding readers from a research question through sequential decision nodes: spatial resolution required, analyte class, sample type, and quantification needs. Each terminal node maps to a specific platform recommendation. Use this flowchart in conjunction with the scenario table in Section 3 for initial experimental planning.
Sample Preparation Across MSI Platforms
Sample preparation is the step where spatial metabolomics experiments most commonly succeed or fail. Unlike bulk metabolomics, where extraction efficiency dominates, MSI sample preparation must satisfy two competing demands: preserve the spatial distribution of metabolites and render them accessible to the ionization source.
Metabolic Quenching and Tissue Harvesting — The Critical First 60 Seconds
Post-excision enzymatic activity degrades labile metabolites within seconds. ATP and glycolytic intermediates are particularly vulnerable; neurotransmitter levels in brain tissue shift measurably within 30 seconds of interrupted blood flow. The standard mitigation — immediate submersion in liquid nitrogen — is effective but operationally demanding. For tissues that require dissection or orientation before freezing, the excision-to-freezing interval must be tracked and minimized. For brain metabolomics studies where metabolic stability is paramount, in vivo quenching methods such as funnel-freezing and focused microwave irradiation preserve metabolic state more faithfully than post-excision freezing but require specialized equipment.
Embedding, Sectioning, and Mounting — Platform-Specific Considerations
Embedding medium selection is a make-or-break decision that novice users often get wrong. Acceptable media include carboxymethyl cellulose (CMC, 2–4%), HPMC+PVP hydrogel, and FSC22; these introduce minimal chemical interference. Forbidden media for MSI include OCT compound, which contains PEG polymers that cause massive ion suppression across the entire mass range, and paraffin, which extracts metabolites during processing. The damage from OCT is irreversible — once tissue is embedded in OCT, no washing step can remove the polymer contamination sufficiently for metabolomics-grade MSI.
Snap-freezing in liquid nitrogen or a dry ice/ethanol bath produces the fine ice crystals essential for tissue morphology preservation. Slow freezing in a −80°C freezer creates large ice crystals that rupture cellular architecture. For cryosectioning, sections of 10–15 μm thickness are standard for MALDI; tissue blocks are equilibrated at −15 to −20°C for 30–60 minutes before sectioning. Sections are thaw-mounted onto ITO-coated conductive glass slides, which are required for MALDI but not for DESI.
Matrix Application for MALDI — Sublimation vs. Spray vs. Dry Droplet
Matrix application quality directly determines MALDI image quality. Three methods dominate, in descending order of reproducibility and spatial fidelity. Sublimation, in which matrix powder is heated under vacuum and condenses as a uniform, fine-crystalline film on the cooled tissue surface, produces the smallest and most uniform crystals — typically below 1 μm — maximizing spatial resolution with excellent reproducibility. Its limitation is that dry-deposited matrix limits analyte extraction from the tissue; a post-sublimation recrystallization step, exposing the coated slide to solvent vapor, can improve sensitivity. Automated spray coating using a TM-Sprayer or iMLayer applies matrix solution pneumatically in controlled passes with tunable crystal size and coating density, offering a practical balance of reproducibility, sensitivity, and spatial fidelity for most applications. Manual dry droplet or sieve deposition produces poor reproducibility and inconsistent ion yields across the tissue and is not recommended for quantitative or comparative work.
Matrix selection — DHB for broad coverage in positive mode, CHCA for peptides and small molecules, 9-aminoacridine for acidic metabolites in negative mode — is covered comprehensively in our MALDI imaging guide.
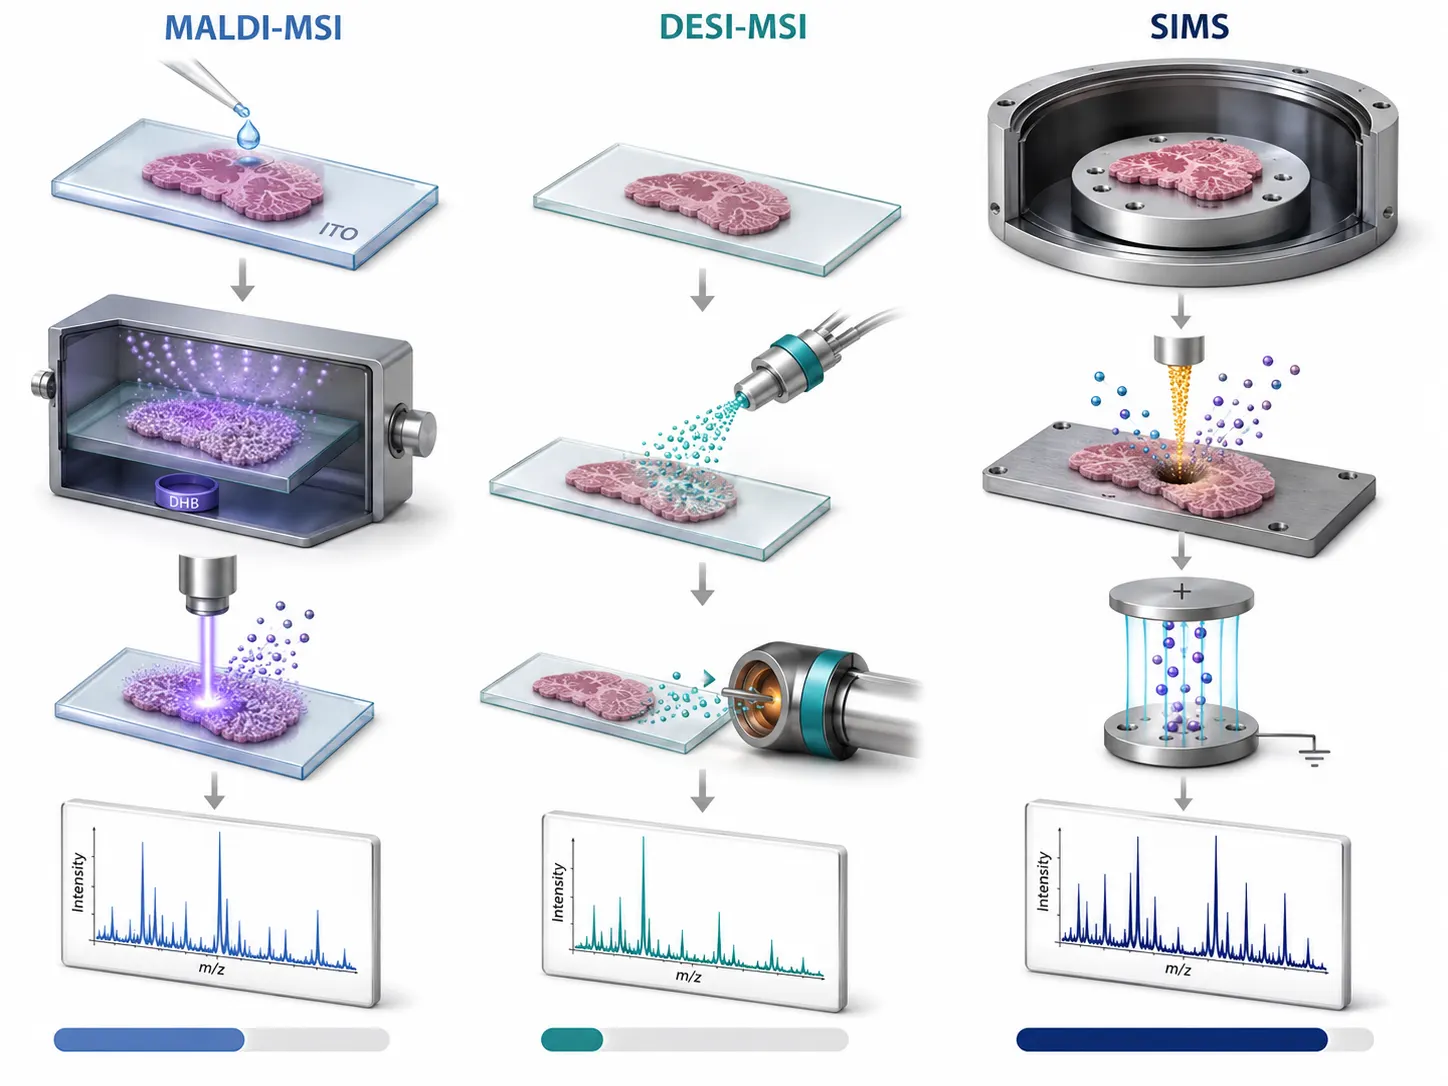 Figure 4: Sample preparation workflow comparison. Side-by-side 3D cutaway illustrations for MALDI-MSI, DESI-MSI, and SIMS showing the critical preparation steps: embedding and sectioning, matrix or solvent application, and MS acquisition. Relative preparation time is indicated by a timeline bar beneath each column — note the substantial differences in hands-on time and technical complexity across platforms, which should factor into platform selection when throughput is a consideration.
Fresh-Frozen vs. FFPE: What Works for Which Platform
Fresh-frozen tissue is the unequivocal gold standard for spatial metabolomics. FFPE tissue — the dominant archival format in clinical biobanks — is compatible only with a restricted subset of analytes. Formalin crosslinks proteins and nucleic acids, while the ethanol dehydration and xylene clearing steps of paraffin processing extract the majority of polar metabolites and a substantial fraction of lipids. What survives FFPE processing is primarily membrane-associated structural lipids, such as phosphatidylcholines and sphingomyelins, and protein-associated N-glycans.
For researchers with access only to FFPE archives: acknowledge the metabolite coverage limitation explicitly. MALDI analysis of deparaffinized FFPE sections with on-tissue antigen retrieval using citrate buffer at 95°C can recover some lipid and N-glycan signals, but polar metabolome coverage will be negligible. Whenever possible, prospectively collect and bank fresh-frozen tissue alongside FFPE blocks.
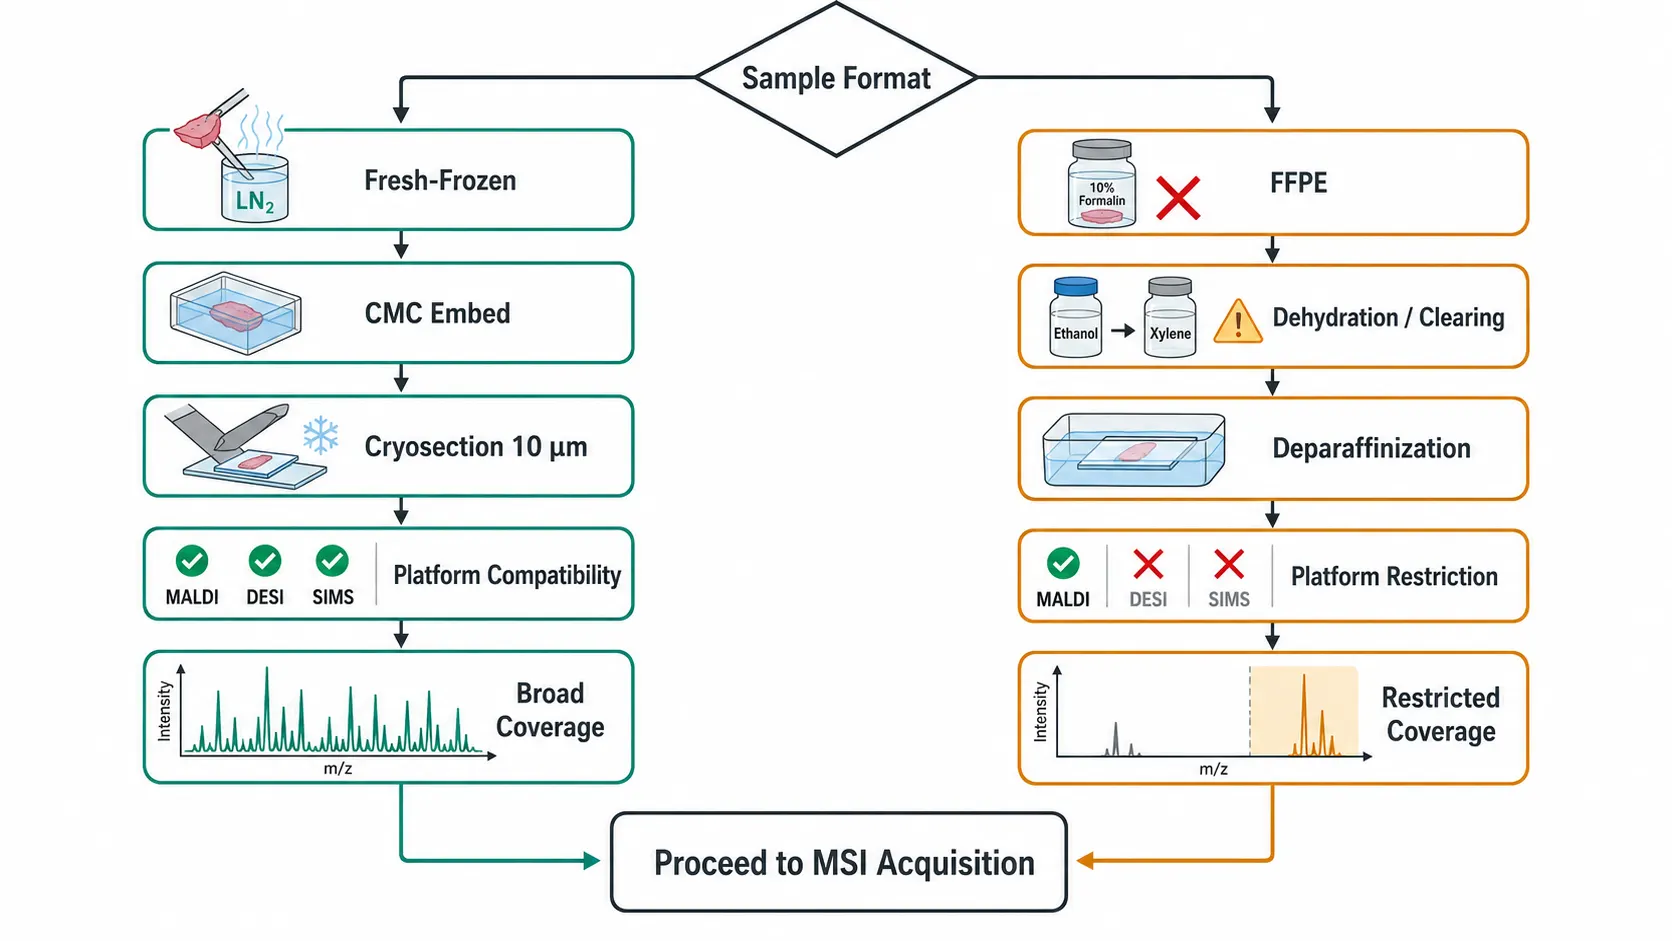 Figure 5: Fresh-frozen vs. FFPE decision logic flowchart. This branching diagram compares the two major tissue preservation routes for spatial metabolomics, showing compatible analyte classes, platforms, and expected metabolite coverage for each format. The fresh-frozen path (green) leads to full metabolome coverage across all platforms; the FFPE path (amber) narrows to MALDI-only analysis of lipids and N-glycans. Use this flowchart during study design to assess whether existing archival samples are suitable for your spatial metabolomics question.
On-Tissue Chemical Derivatization (OTCD) to Expand Coverage
OTCD addresses two persistent limitations of MALDI-MSI: poor ionization efficiency for low-abundance and polar metabolites, and matrix interference in the low-mass range. By reacting specific functional groups directly on the tissue surface, OTCD installs easily ionizable tags that shift derivatized metabolites into higher, interference-free mass ranges while simultaneously enhancing ionization efficiency.
For carbonyl-containing metabolites including aldehydes and ketones, Girard's T (GirT) reagent provides a +114 Da mass shift and has been successfully applied to ischemic brain metabolomics and plant aldehyde mapping. For carboxyl-containing metabolites, 4-APEBA combined with EDC crosslinker produces a +195 Da mass shift with a diagnostic bromine isotope signature that aids confident bioinformatic annotation; this approach has been validated in cancer metabolism and plant hormone studies. For amine-containing metabolites including neurotransmitters, coniferyl aldehyde (CA) derivatization enables spatial mapping of compounds otherwise invisible to MALDI.
A notable 2025 advance is the GirT/GirP parallel derivatization strategy combined with laser-assisted chemical transfer (LACT). When the same tissue feature appears at the expected 19.969 Da mass difference between the two derivatization channels, annotation confidence increases substantially compared to single-reagent approaches. This strategy has been shown to increase carbonyl annotation coverage by 2- to 3-fold relative to traditional incubation-based OTCD.
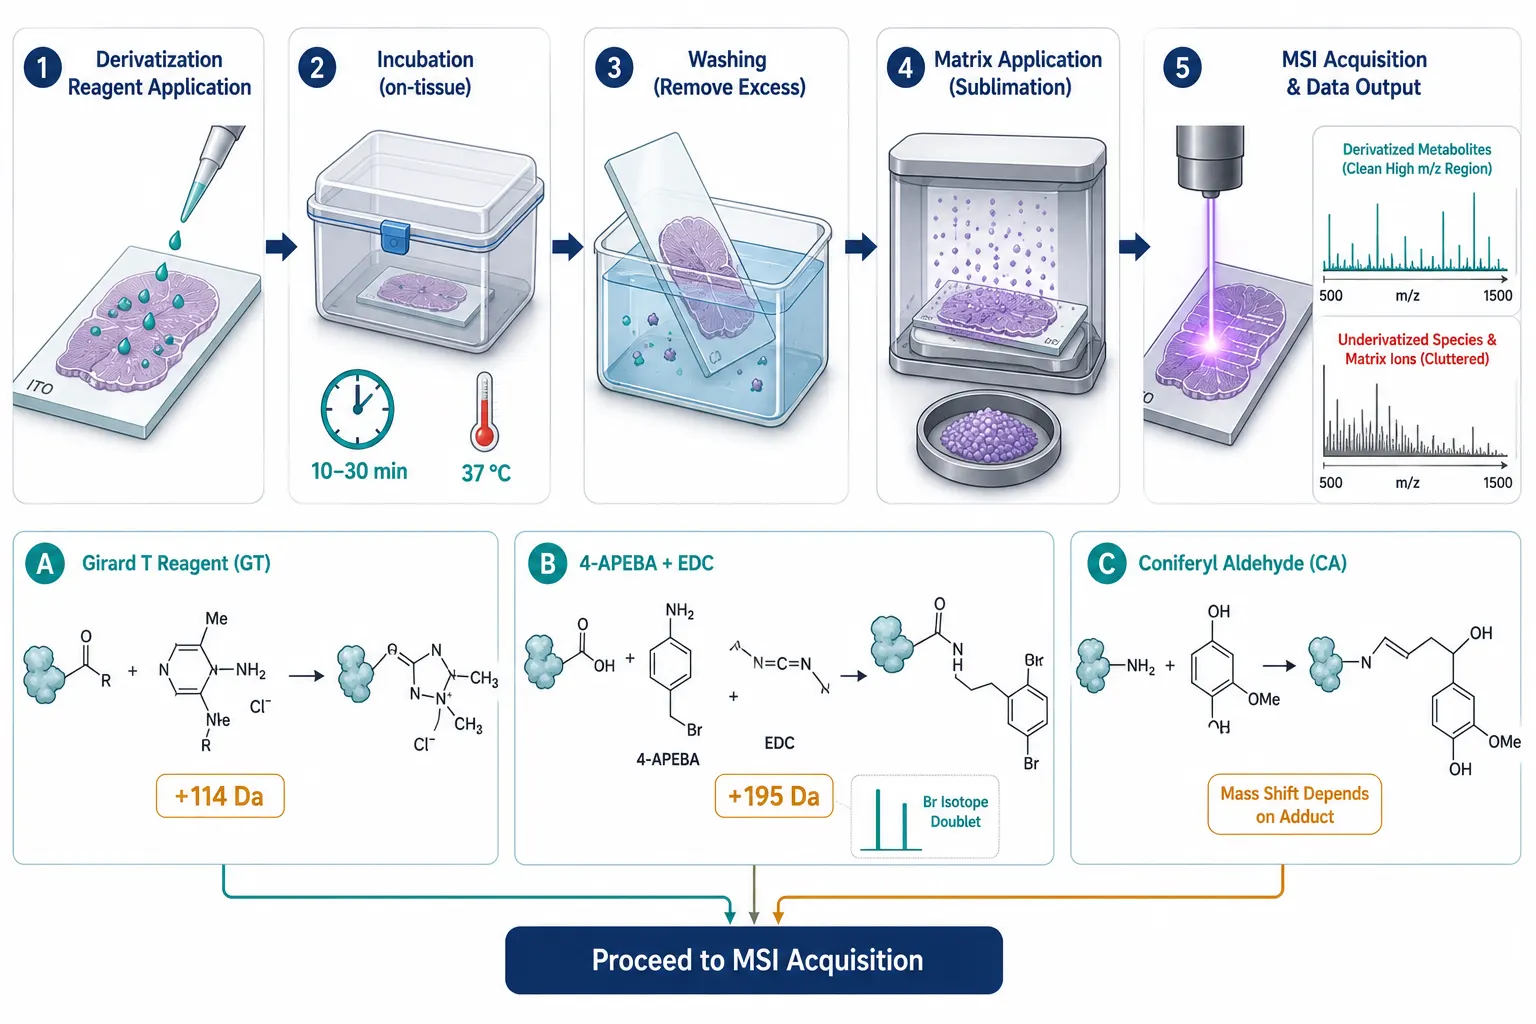 Figure 6: On-tissue chemical derivatization workflow. Horizontal process diagram showing the five-stage OTCD pipeline: reagent application, incubation, washing, matrix deposition, and MSI acquisition. Three inset panels detail the specific derivatization chemistries: Girard's T for carbonyls (+114 Da shift), 4-APEBA+EDC for carboxyls (+195 Da with bromine isotope doublet), and coniferyl aldehyde for amines. The mass-shift filtering step after acquisition — comparing GirT and GirP channels for the characteristic 19.969 Da difference — is the key annotation confidence booster for carbonyl metabolites.
Data Acquisition, Processing, and Analysis Overview
Data Formats and Computational Infrastructure
MSI datasets are large: a single tissue section imaged at 25 μm resolution generates tens of thousands of spectra, each containing thousands of m/z bins. The raw data cube can exceed tens of gigabytes per section. The community standard format is imzML, an XML-based open format that stores both spectral data and spatial coordinates. Most vendor-specific raw formats can be converted to imzML via msConvert from the ProteoWizard toolkit or vendor-provided exporters. Computational requirements scale with dataset size; a workstation with 32–64 GB RAM and a CUDA-capable GPU is recommended for full-resolution processing.
From Raw Spectra to Ion Images: Preprocessing Pipelines
The preprocessing chain consists of five linked stages, each building on the output of the previous:
1. Spectrum smoothing and baseline correction. Savitzky-Golay or moving-average filters reduce spectral noise, followed by baseline subtraction with TopHat or SNIP algorithms to remove chemical background. This stage is particularly critical for low-intensity metabolites whose signals approach the noise floor.
2. Peak picking. Profile spectra are centroided into discrete m/z-intensity pairs. Signal-to-noise thresholding — typically S/N of 3 to 5 — filters spurious peaks while retaining genuine metabolite features. The threshold choice is itself a trade-off: stricter S/N ratios reduce false positives but risk discarding low-abundance metabolites.
3. m/z alignment. Cross-pixel and cross-section drift correction uses internal calibrants as lock-mass references or computational alignment via the Cardinal and MALDIquant packages in R. Without proper alignment, the same metabolite appears at slightly different m/z values across pixels, fragmenting ion images and corrupting downstream statistics.
4. Normalization. Total ion current (TIC) normalization is most common; root-mean-square (RMS) and internal standard-based alternatives provide options for specific experimental designs. The choice of normalization method significantly affects downstream statistical results and should be reported explicitly in methods sections.
5. Ion image generation. Each aligned m/z feature is rendered as a spatial heatmap, producing the chemical maps that are the primary output of an MSI experiment.
Software platforms supporting these preprocessing stages include SCiLS Lab for comprehensive commercial analysis, Cardinal for open-source R/Bioconductor users, METASPACE for cloud-based metabolite annotation, and ImageJ with the MSIReader plugin for quick visualization. Most laboratories use a combination: for example, Cardinal for preprocessing and initial statistics, METASPACE for metabolite annotation against community databases, and SCiLS Lab or custom R scripts for publication-quality figure generation.
Statistical Approaches: Univariate, Multivariate, and Spatial Statistics
Statistical analysis of MSI data must account for spatial autocorrelation — neighboring pixels are not independent observations. Three tiers of analysis are commonly employed. Univariate per-ion analysis uses region-of-interest (ROI)-based intensity comparisons with t-tests or Mann-Whitney tests and Benjamini-Hochberg multiple-testing correction; it is straightforward but ignores spatial structure. Multivariate multi-ion analysis employs PCA, t-SNE, and UMAP for dimensionality reduction and hierarchical clustering or k-means for segmentation, identifying groups of co-localized ions that define tissue regions. Spatial statistics using Moran's I and related spatial autocorrelation metrics explicitly test whether ion distributions are random or structured; spatially aware clustering methods incorporate neighbor information into the classification. Our statistical analysis service and bioinformatics for metabolomics platform provide end-to-end support from MSI data processing through biological interpretation.
AI/ML Integration: Where Deep Learning Is Changing MSI Data Analysis
Machine learning is reshaping MSI analysis at multiple levels. At the preprocessing level, self-supervised deep learning models now perform m/z drift correction and cross-batch harmonization with accuracy competitive with manual calibration. At the annotation level, deep learning-based spectral prediction trained on large MS/MS libraries assists in assigning metabolite identities to MSI features that lack fragmentation spectra. At the interpretation level, convolutional neural networks (CNNs) trained on H&E-stained adjacent sections can predict tissue regions that are subsequently used as spatial priors for MSI segmentation, and graph neural networks are being applied to model metabolite co-localization networks as spatial molecular pathways.
The key developments to track in 2025–2026 are interpretable AI methods — SHAP and Grad-CAM applied to MSI — which address the black-box criticism by highlighting which spectral features drive model decisions, and the emergence of large-scale spatial metabolomics atlases that aggregate MSI data across laboratories.
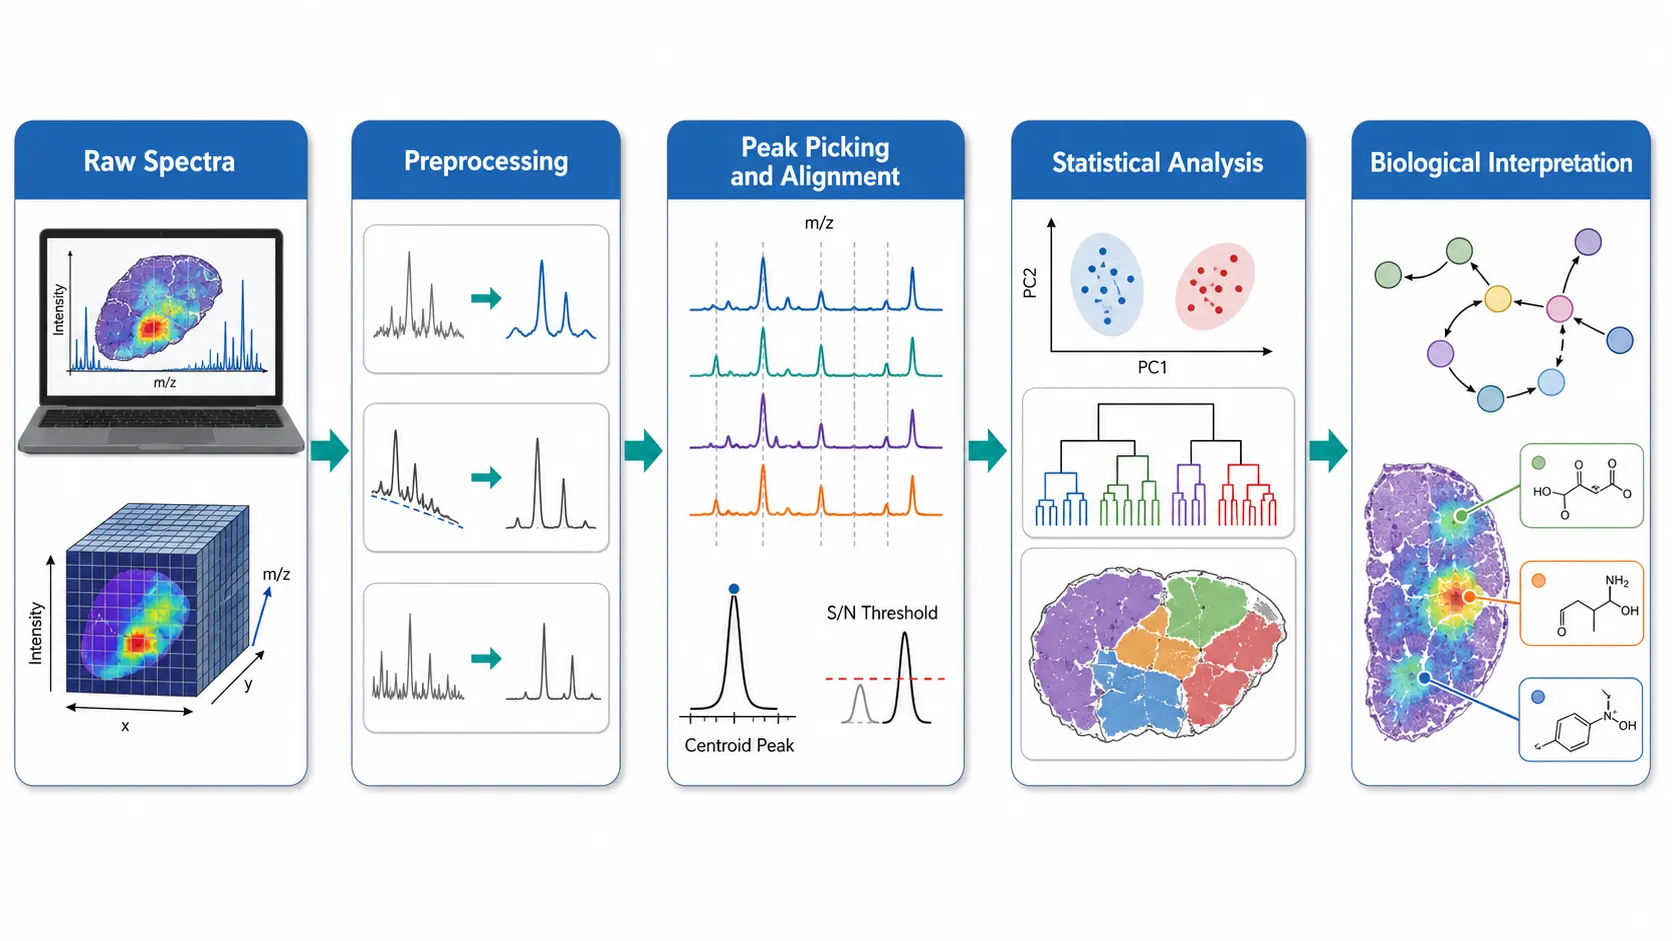 Figure 7: MSI data analysis pipeline. Five-stage horizontal workflow connecting Raw Spectra through Preprocessing, Peak Picking and Alignment, Statistical Analysis, to Biological Interpretation. Each stage is represented by a visual icon — from raw spectral profiles to PCA score plots to annotated pathway maps — illustrating the progressive transformation of data from instrumental output to biological insight. The software tools listed beneath each stage (SCiLS Lab, Cardinal, METASPACE, ImageJ) indicate which platforms support that analysis phase.
Applications Across Disciplines
Oncology and Tumor Microenvironment
Spatial metabolomics has arguably made its deepest impact in cancer biology. MSI experiments have revealed that the metabolic profile of a tumor is not homogeneous: the tumor core, invasive margin, and adjacent stromal compartments each carry distinct metabolic signatures. MALDI-MSI studies of colorectal and ovarian tumors have identified metabolite-defined immune niches — regions where specific glycerophospholipid species co-localize with CD204-positive tumor-associated macrophages — that are invisible to bulk metabolomics. In drug development, MSI-based tumor penetration mapping quantifies whether candidate compounds reach hypoxic, poorly vascularized tumor cores, a question that directly determines efficacy. Our spatial drug distribution analysis guide examines this application in depth.
Neuroscience and Neurodegenerative Disease
Brain tissue is the prototypical spatially organized sample: anatomical substructures with sharply distinct functions — cortex layers, hippocampal subfields, striatal compartments — sit adjacent to one another at sub-millimeter scales. MALDI-MSI at 10–20 μm resolution resolves metabolite distributions across these substructures, revealing metabolic specialization that matches transcriptomic and proteomic patterns. In Alzheimer's disease models, lipid imaging around amyloid plaques has identified ceramide and sulfatide enrichment patterns that suggest local lipid dysregulation. In Parkinson's disease research, dopamine and its metabolites are directly imageable by MALDI-MSI following on-tissue derivatization, enabling spatial correlation with tyrosine hydroxylase immunohistochemistry.
Drug Discovery and Pharmaceutical Development
MSI addresses three critical questions in preclinical drug development: where does the compound go, is it metabolized in target tissues, and does its distribution explain efficacy or toxicity? Unlike whole-body autoradiography, which requires radiolabeling and cannot distinguish parent drug from metabolites, MSI simultaneously images the drug and its metabolic products based on their distinct masses. This label-free, multiplexed approach has made MSI a standard component of pharmaceutical development workflows, particularly for CNS-penetrant compounds where blood-brain barrier penetration must be confirmed, oncology candidates where tumor penetration depth matters, and nephrotoxic drugs where kidney compartment accumulation can explain toxicity. For a full discussion of pharmacokinetic applications, see our article on in situ PK/PD profiling by MSI.
Plant and Food Science
In plant biology, spatial metabolomics maps secondary metabolite accumulation to specific cell types and tissues — alkaloids in vascular bundles, flavonoids in epidermal layers, saponins in root nodules. These distribution patterns inform biosynthetic pathway hypotheses and guide genetic engineering strategies. For example, MALDI-MSI of Catharanthus roseus leaf cross-sections has revealed that vinca alkaloid biosynthetic intermediates accumulate in distinct epidermal cell types, a discovery that directly guided the engineering of heterologous production systems by identifying the spatially restricted final-step enzymes. Methodologically, plant tissues present unique challenges not encountered in mammalian samples: the rigid cellulose cell wall impedes matrix penetration and alters crystallization dynamics, and abundant photosynthetic pigments can dominate the spectrum in leaf tissue. Adjusting matrix concentration upward (typically 1.5-2x the mammalian protocol) and incorporating a brief chloroform wash to remove chlorophyll prior to matrix deposition substantially improve signal quality.
In food science, MALDI-MSI has been applied to map flavor compound distributions in fermented products such as cheese and cured meats, track pesticide penetration depth in produce, and spatially resolve nutrient localization in cereal grains. A notable application is the visualization of chlorogenic acid redistribution during coffee bean roasting, where spatial MSI revealed that the inner bean compartment retains significantly higher phenolic content than the surface layers, with implications for roasting protocol optimization. These cross-disciplinary applications underscore a core theme of this guide: spatial context transforms chemical measurements into actionable biological and industrial insights.
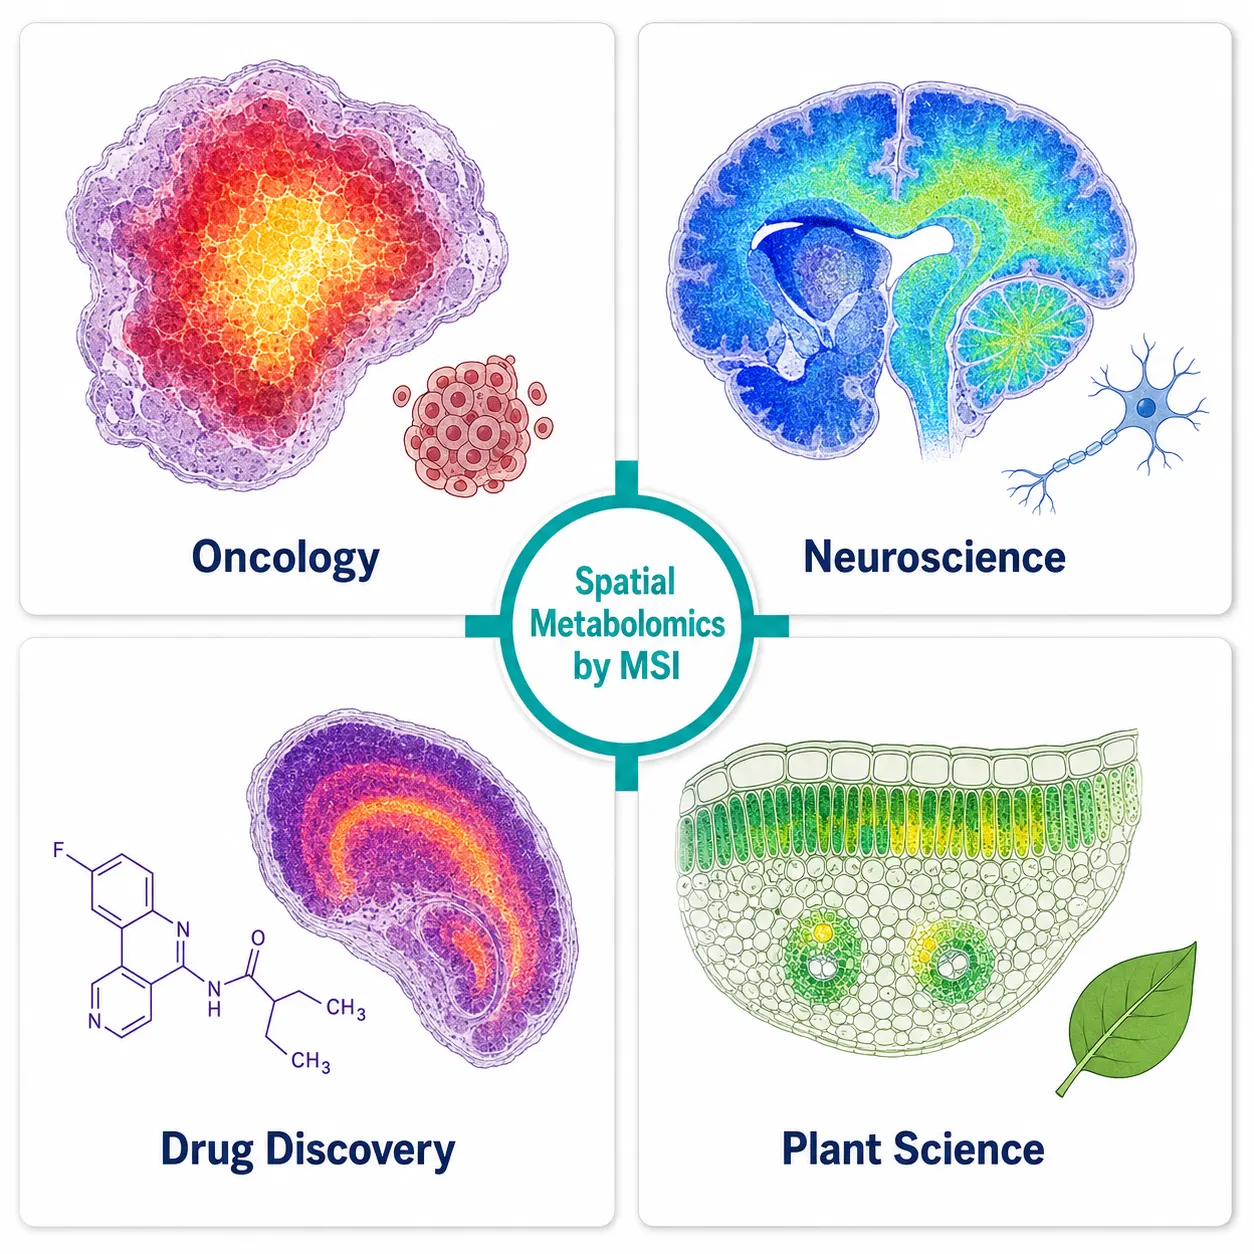 Figure 8: Application areas overview. A 2x2 quadrant infographic displaying the four major application domains of spatial metabolomics — Oncology, Neuroscience, Drug Discovery, and Plant Science — each with a representative tissue ion image showing spatial metabolite distributions. The heatmap overlays illustrate the core value proposition of MSI: the same analyte panel, applied to different tissue types and research questions, yields fundamentally different spatial patterns that drive domain-specific biological insights.
Limitations, Pitfalls, and Future Directions
Current Resolution-Sensitivity Trade-offs
The spatial resolution a researcher wants and the spatial resolution that yields usable signal are often different numbers. At 5 μm pixel size, the ion count per pixel for a metabolite present at low-micromolar tissue concentration can drop below the detection threshold on all but the most sensitive instruments. Even when ions are detected, low counts produce noisy ion images with poor spatial coherence. The practical resolution floor for untargeted MALDI metabolomics on most commercial instruments is approximately 10–20 μm; pushing below this requires specialized instrumentation such as t-MALDI or targeted acquisition modes such as MRM on a triple quadrupole.
Standardization Challenges Across Labs
MSI data from different laboratories are not directly comparable without substantial harmonization effort. Matrix application method, laser fluence, mass analyzer type, and data processing parameters all influence the resulting ion images. A metabolite detected with high confidence in one laboratory's dataset may be absent from another's purely due to differences in sample preparation rather than biological variation. Community efforts toward standard operating procedures — including the METASPACE annotation platform and the imzML data format — are addressing this, but cross-laboratory reproducibility remains a significant barrier to the field's maturation.
The Multimodal Future: MSI + Spatial Transcriptomics + Proteomics
The most transformative trend in spatial biology is not improvement within any single modality but the integration of multiple modalities on the same tissue. The typical 2026 high-impact workflow images a single tissue section or serial sections with MALDI-MSI for metabolomics and lipidomics, then applies spatial transcriptomics — 10x Visium or MERFISH — on an adjacent section, and optionally targeted spatial proteomics via IMC or MIBI to map cell-type markers. Co-registering these data layers creates a molecularly resolved tissue atlas in which metabolite distributions can be attributed to specific cell types and transcriptional states. The bioinformatics challenge — aligning datasets with different spatial resolutions, feature spaces, and noise profiles — is substantial but is being actively addressed. For researchers planning multi-omics integration, our integrated proteomics and metabolomics analysis and MS-based spatial proteomics services provide complementary capabilities. The single-cell spatial metabolomics frontier extends this integration to the individual cell level.
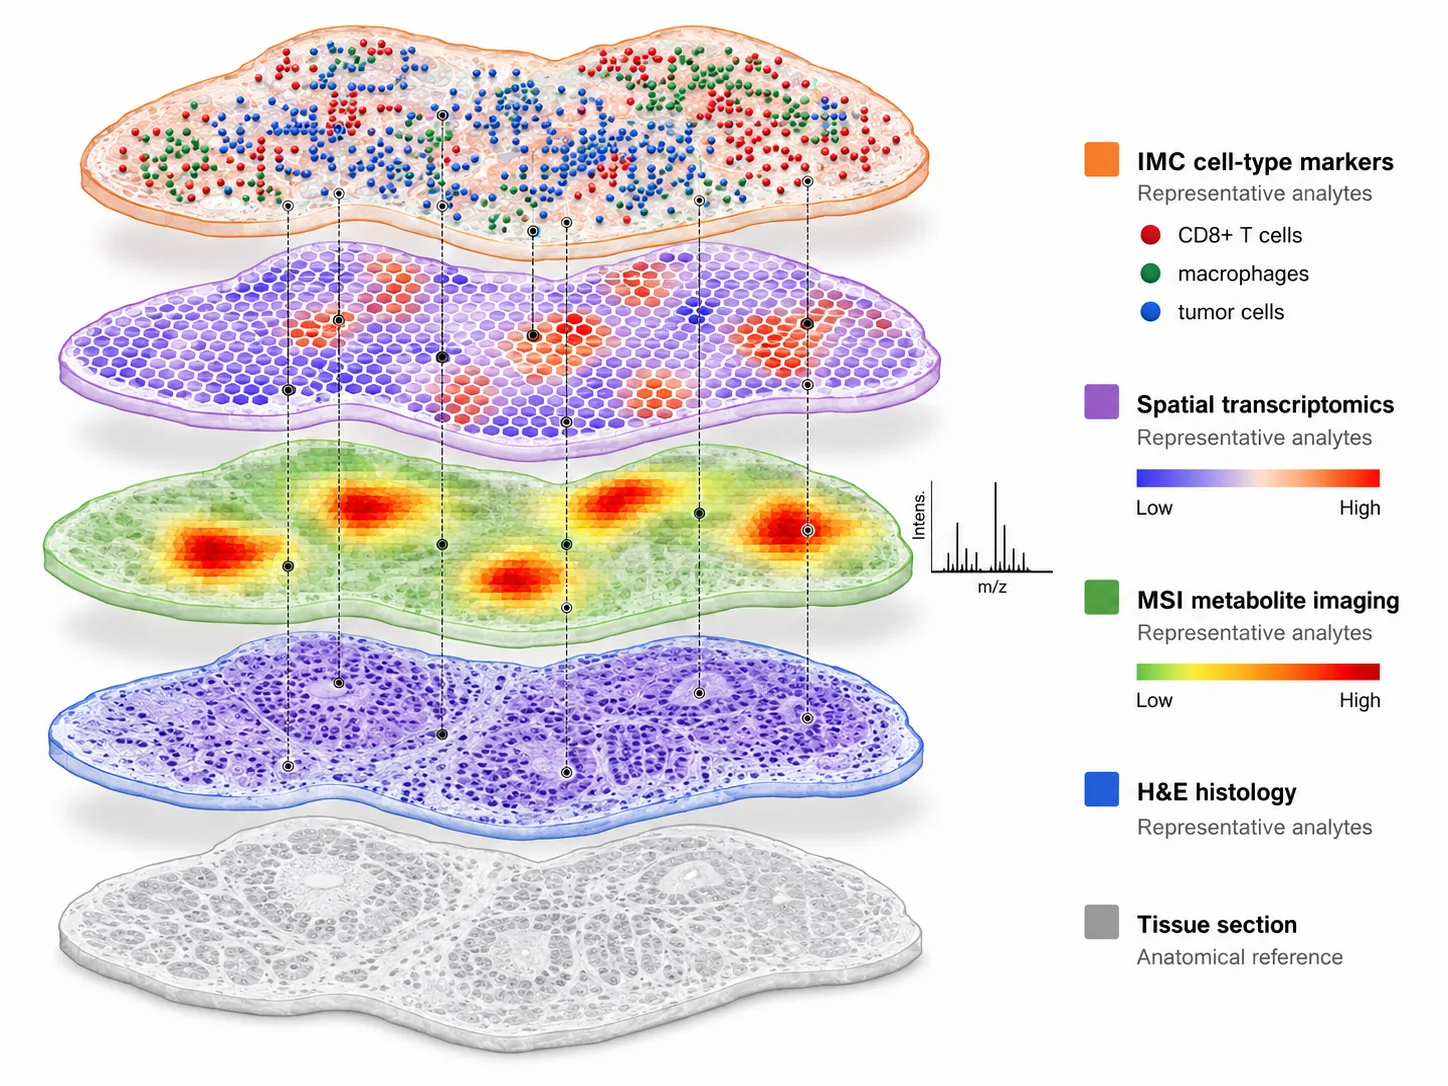 Figure 9: Multimodal spatial omics integration. Layered 3D conceptual diagram showing four data modalities co-registered on a single tissue section: H&E histology (blue base layer), MSI metabolite heatmaps (green layer), spatial transcriptomics Visium spots (purple hexagonal grid), and IMC cell-type markers (orange scattered dots representing CD8+ T cells, macrophages, and tumor cells). Dashed connector lines link co-localized features across layers, illustrating how multimodal integration attributes metabolite distributions to specific cell types and transcriptional states — the central analytical challenge and opportunity of 2026-era spatial biology.
All spatial metabolomics services described in this article are provided for Research Use Only (RUO). These workflows are not intended for diagnostic, therapeutic, or clinical decision-making purposes.
FAQ
Q: I am new to spatial metabolomics. Which platform should I start with?
A: MALDI-MSI is the most practical entry point for most metabolomics researchers. It offers the broadest molecular coverage, the most extensive literature and community support, and a mature commercial instrument ecosystem. Start with fresh-frozen tissue at 25–50 μm spatial resolution using DHB as the matrix for positive ion mode, and refine your protocol from that baseline.
Q: How many biological replicates do I need for a spatial metabolomics experiment?
A: A minimum of n = 3 per group for pilot studies, and n = 5–8 for publication-quality comparative studies. Within-group biological variability in tissue metabolite levels is substantial, and spatial heterogeneity within each section adds a second layer of variance. Power calculations based on pilot data are strongly recommended before committing to large-scale studies.
Q: Can I use FFPE tissue for spatial metabolomics?
A: Only for a restricted analyte set, primarily membrane-associated lipids and N-glycans. Polar metabolite coverage from FFPE is negligible. If FFPE is your only available sample type, design the study around lipid-focused questions and explicitly acknowledge the metabolite coverage limitation. Always bank matched fresh-frozen tissue alongside FFPE when prospectively collecting samples.
Q: What is the single most common mistake in MSI sample preparation?
A: Using OCT embedding medium. OCT contains polyethylene glycol polymers that ionize efficiently and suppress endogenous metabolite signals across the entire mass range. The damage is irreversible — once tissue is embedded in OCT, no washing step can remove the polymer contamination sufficiently for metabolomics-grade MSI. Use CMC, HPMC+PVP, or FSC22 instead.
Q: How does on-tissue chemical derivatization help, and when should I use it?
A: OTCD expands metabolite coverage by two mechanisms: first, installing easily ionizable tags on poorly ionizing functional groups such as carbonyls, carboxyls, and amines; and second, shifting derivatized metabolites to higher m/z ranges where matrix cluster interference is absent. Use OTCD when your target metabolite class is invisible or barely detectable in underivatized tissue — this is especially common for small organic acids, neurotransmitters, and steroid hormones.
Q: How do I choose between relative quantification and absolute quantification in MSI?
A: If your biological question is "is metabolite X higher in region A than region B?", relative quantification with appropriate normalization suffices. If your question is "what is the tissue concentration of metabolite X, and does it exceed the IC50 for its target?", absolute quantification against calibrated mimetic tissue standards is required. Absolute quantification in MSI is substantially more involved — see our quantitative MSI guide for the full protocol.
Q: What software should I use for MSI data analysis?
A: SCiLS Lab (commercial) is the most widely used platform with comprehensive preprocessing, visualization, and statistical tools. Cardinal (open-source R/Bioconductor) provides equivalent capabilities for users comfortable with R. METASPACE (cloud-based, free for academic use) focuses on metabolite annotation and offers a growing library of community-annotated MSI datasets. ImageJ with the MSIReader plugin is useful for quick visualization. Most laboratories use a combination of all four.
References:
- Alexandrov T. Spatial metabolomics: design, pitfalls and data interpretation. EMBO Journal, 2026; 45: 1-17. doi:10.1038/s44318-026-00797-x
- Yang CC, Lin CY, Yuan HY, Huang HC, Juan HF. Mass spectrometry-based human spatial omics: fundamentals, innovations, and applications. Journal of Biomedical Science, 2026; 33: 16. doi:10.1186/s12929-026-01219-0
- Hill CB, et al. Single-cell mass spectrometry imaging: platform advances for multimodal spatial omics. Analytical and Bioanalytical Chemistry, 2026; 418: 1253-1272. doi:10.1007/s00216-026-06644-6
- Fecke A, et al. Refined on-tissue chemical derivatization expands MALDI-MSI capabilities for spatial metabolomics of mammalian organs. ChemRxiv, 2026. doi:10.26434/chemrxiv.10001970/v1
- Nakagawa K, Okamoto M, Nishida M, et al. On-tissue derivatization for mass spectrometry imaging reveals the distribution of short chain fatty acids in murine digestive tract. Frontiers in Cellular and Infection Microbiology, 2025; 15: 1584487. doi:10.3389/fcimb.2025.1584487
- Farhan A, Wang YS. Recent applications of artificial intelligence and related technical challenges in MALDI MS and MALDI-MSI: a mini review. Mass Spectrometry (Tokyo), 2025; 14: A0175. doi:10.5702/massspectrometry.A0175
- Li S, Wang Y, Zhang H, et al. Spatially resolved plant metabolomics. Metabolites, 2025; 15(8): 539. doi:10.3390/metabo15080539
- Hartmann FJ. Spatial immunometabolism: integrating technologies to decode cellular metabolism in tissues. European Journal of Immunology, 2025; 55: e70094. doi:10.1002/eji.70094
- Stahl PL, et al. Spatially resolved integrative analysis of transcriptomic and metabolomic changes in tissue injury studies. Nature Communications, 2025; 16: 2061. doi:10.1038/s41467-025-68003-w
- Zhang T, Fu X, Wei S, et al. Ambient ionization mass spectrometry imaging in pharmaceutical and biomedical analysis: advances and transformative perspectives. Journal of Pharmaceutical Analysis, 2026. doi:10.1016/j.jpha.2026.101669















