LCM-Guided Spatial Proteomics Service | ROI LC-MS/MS Analysis
Precision Proteomics for Defined Tissue Regions
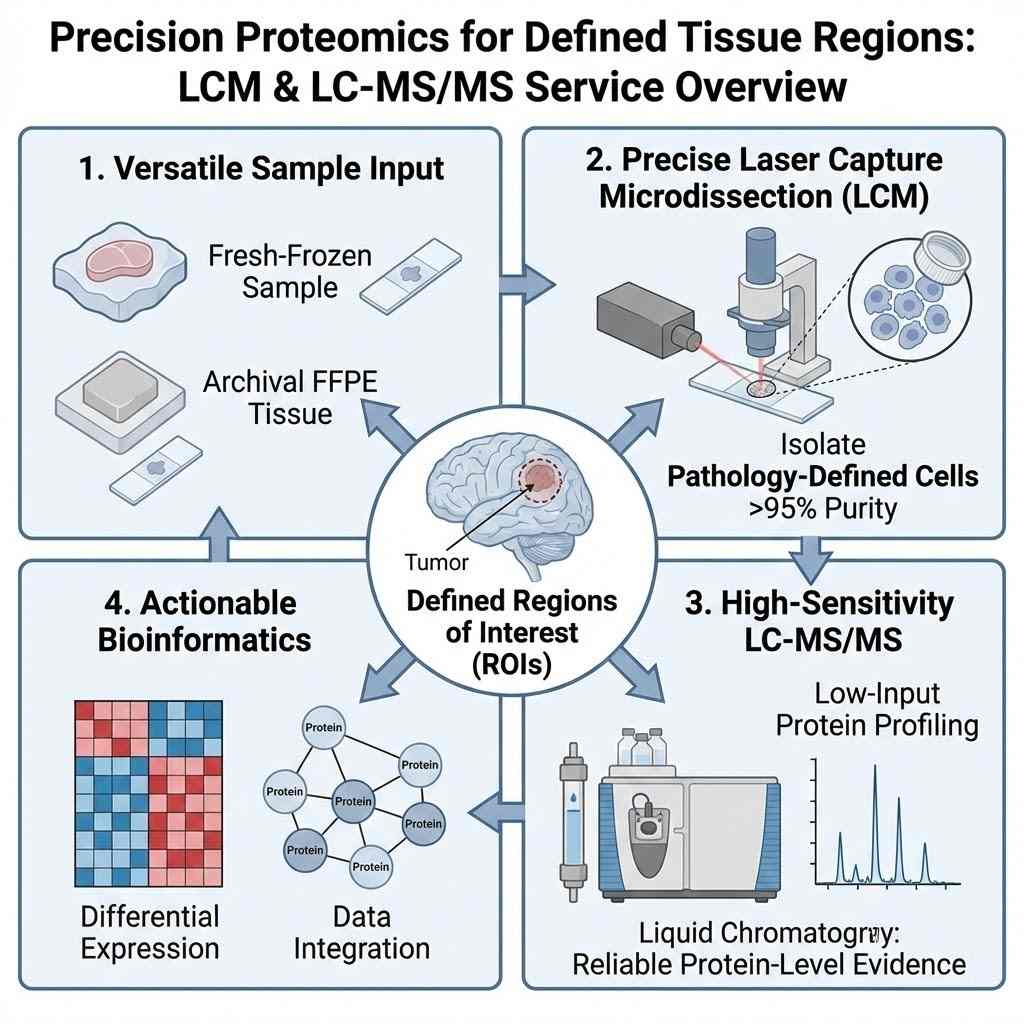
This Laser Capture Microdissection (LCM) Proteomics Service is built for projects where you already know where the biology happens—and now require reliable protein-level evidence from those defined tissue regions. By combining precise laser microdissection (LCM/LMD) with high-sensitivity, low-input LC–MS/MS, we help researchers profile proteins directly from pathology-defined regions of interest (ROIs).
This service supports both fresh-frozen samples and archival FFPE tissue sections, making it a versatile tool for translational research.
- Pathology-Guided ROI Standardization
- High-Sensitivity Low-Input LC-MS/MS
- Compatible with FFPE & Frozen Tissue
- Decision-Ready Quantitative Outputs
- Introduction
- The Challenge
- Applications
- Workflow
- Quality Control
- Samples
- Case Study
- FAQ
- References
Introduction: Precision Proteomics for Defined Tissue Regions
By combining precise laser microdissection (LCM/LMD) with high-sensitivity, low-input LC–MS/MS, we help researchers profile proteins directly from pathology-defined regions of interest (ROIs). Unlike bulk analysis that averages signals across the whole tissue, masking critical spatial heterogeneity, our workflow isolates specific niches. Whether you are investigating the invasive tumor front, immune-excluded zones, fibrotic stroma, or specific neural layers, we ensure your data reflects the biology of the ROI, not the noise of the surrounding tissue.
This service is designed for cohort consistency, quantitative stability, and decision-ready outputs. It supports both fresh-frozen samples and archival FFPE tissue sections, making it a versatile tool for translational research and retrospective clinical studies. We bridge the gap between histology and deep proteomic profiling, transforming stained slides into quantitative molecular maps.
[Research Use Only (RUO). Not for use in diagnostic procedures.]
The Challenge: Why Spatial Proteomics is Hard (And How We De-risk It)
LCM-guided proteomics is widely recognized as a powerful tool for spatial biology, but it is technically unforgiving. Most failed spatial proteomics projects do not fail at the mass spectrometer; they fail earlier due to poor ROI planning, uncontrolled variability during dissection, or downstream sample loss. High-value projects succeed only when these risks are identified and managed upfront.
We have structured our service to systematically address the four critical failure modes in spatial analysis:
1. The Low-Input Challenge & Surface Adsorption
- Unlike bulk proteomics where milligrams of protein are available, LCM samples often yield nanograms. At this scale, physical laws change: proteins stick avidly to tube walls and pipette tips (adsorption), leading to catastrophic sample loss before the sample ever reaches the instrument.
- Our Solution: We utilize a specialized "one-pot" digestion workflow and ultra-low-adsorption consumables designed specifically for micro-scale samples. By minimizing liquid transfer steps and optimizing surfactant chemistry, we maximize recovery. This allows for robust quantification even from small ROI inputs that would be undetectable in standard workflows.
2. The ROI Consistency Challenge
- In comparative cohort studies, the definition of the ROI is as important as the measurement itself. If "ROI A" (e.g., "Tumor Core") in Patient 1 includes significant stroma, while "ROI A" in Patient 2 is purely epithelial, the resulting proteomic differences will reflect sampling error, not biology.
- Our Solution: We implement a Pathology-Guided ROI Standardization step. Before a single laser cut is made, we align ROI definitions (using H&E or IF guidance) across the entire cohort. We define exclusion criteria (e.g., "exclude necrosis," "maintain >50μm distance from margin") to ensure biological comparability.
3. The Contamination Risk
- In spatial proteomics, "spatial" implies separation. However, during microdissection, cross-contamination can occur if excised tissue fragments scatter or if the laser ablation plume settles on adjacent regions.
- Our Solution: We employ gravity-assisted or laser-pressure catapulting methods (LMD) that physically avoid contact between the collected ROI and the remaining tissue. Furthermore, we collect ROIs into separate cap-controlled environments and process them individually, significantly reducing the risk of cross-talk between distinct biological compartments.
4. The Context Challenge (Hidden Phenotypes)
- Sometimes visual selection based on morphology (H&E) isn't enough to define complex molecular phenotypes. You may need to excise a region defined by a metabolic gradient or a specific drug distribution.
- Our Solution: For projects requiring molecularly-defined ROIs prior to excision, we offer a MALDI-MSI Add-on. This allows you to guide microdissection based on metabolic or lipid distributions mapped first by imaging mass spectrometry, ensuring you capture the functional niche, not just the visible structure.
Applications: Who This Service Is Built For
This service is optimized for pharmaceutical teams, biotech researchers, and academic labs working on high-value, decision-driven projects. It serves those who have moved beyond "what is in the tissue?" to "what is happening in *this specific part* of the tissue?".
Tumor Heterogeneity and Clonal Evolution
- Tumors are rarely uniform. Sub-clones with distinct mutations and proteomic profiles often drive resistance and relapse.
- Application: We enable the separate isolation of primary tumor cores, metastatic seeds, and invasive margins. By comparing the proteomes of these distinct regions, researchers can reconstruct the trajectory of tumor evolution and identify proteins specific to the most aggressive sub-clones.
- Value: Identifies targets that are present in the dangerous invasive cells but diluted out in bulk analysis.
Tumor Microenvironment (TME) Dissection
- The interplay between cancer cells and their surroundings is critical for immunotherapy response. Bulk lysis conflates the tumor signal with the immune and stromal signal.
- Application: We precisely excise immune niches (e.g., Tertiary Lymphoid Structures), Cancer-Associated Fibroblasts (CAFs), and endothelial structures separately from the tumor cells.
- Value: Uncovers the signaling networks mediating immune exclusion or exhaustion, providing clear data on stromal biology that is often invisible in bulk datasets.
Biomarker Discovery & Validation
- Many potential biomarkers are expressed only in specific tissue structures. If a marker is highly expressed in a small duct but absent elsewhere, bulk analysis may report it as "low abundance" or miss it entirely due to dilution.
- Application: By enriching the sample for the relevant histological structure (e.g., glomeruli in kidney, islets in pancreas, amyloid plaques in brain), we dramatically increase the effective concentration of structure-specific proteins.
- Value: Improves the sensitivity of biomarker discovery and provides immediate spatial validation of the marker's location.
Mechanism of Action (MOA) & Pharmacodynamics
- Drugs often penetrate tissues unevenly. Understanding how a drug affects the proteome requires knowing *where* the drug is and *where* the effect is happening.
- Application: In conjunction with imaging modalities that locate the drug, we can excise regions of high vs. low drug exposure and perform differential proteomics to assess the local pharmacodynamic response.
- Value: Distinguishes between "lack of efficacy" and "lack of delivery," a critical distinction in pre-clinical drug development.
Neuroscience & Neurodegeneration
- The brain's complexity demands spatial resolution. A protein change in the hippocampus may be meaningless if averaged with the cortex.
- Application: We support the isolation of specific brain sub-regions, layers, or pathological features like plaques and tangles.
- Value: Connects proteomic changes to specific neural circuits or pathological aggregates.
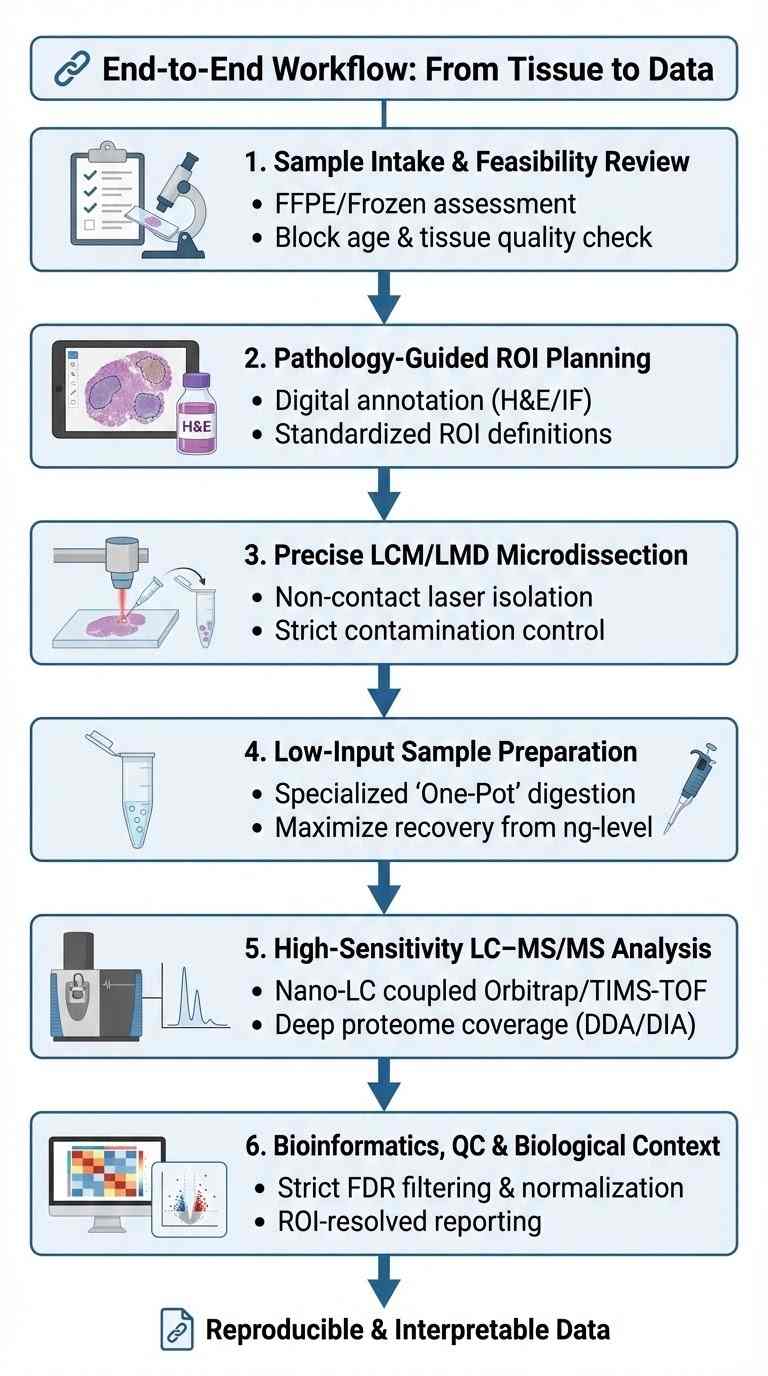
End-to-End Workflow: From Tissue to Data
Our process ensures that every step, from sample intake to data delivery, contributes to a reproducible and interpretable result. We view the workflow as a chain of custody for biological information.
1. Sample Intake & Feasibility Review
Rigorous assessment of sample history (FFPE/Frozen), block age, and tissue quality to ensure project feasibility before starting.
2. Pathology-Guided ROI Planning
Standardized digital annotation of ROIs using H&E or Immunofluorescence (IF) guidance to align definitions across the entire cohort.
3. Precise LCM/LMD Microdissection
Non-contact laser microdissection to isolate specific tissue regions with strict contamination control and ROI pooling strategies.
4. Low-Input Sample Preparation
Specialized "One-Pot" digestion using ultra-low-adsorption consumables to maximize protein recovery from nanogram-level inputs.
5. High-Sensitivity LC–MS/MS Analysis
Nano-LC separation coupled with high-sensitivity Orbitrap or TIMS-TOF mass spectrometry (DDA or DIA modes) for deep proteome coverage.
6. Bioinformatics, QC & Biological Context
Strict FDR filtering, normalization, and ROI-resolved reporting to map protein abundance back to specific tissue compartments.
Quality Control & Methodological Rigor
We do not just "run samples"; we validate the process. Our QC framework is designed to detect issues early and ensure data integrity, especially given the inherent variability of clinical tissue.
Contamination Control
- Blanks: We run "dissection blanks" (caps left open in the machine but no tissue cut) and "process blanks" to detect environmental contaminants (keratins, dust).
- Carryover Monitoring: We monitor LC-MS wash runs between samples to ensure no peptides from a high-abundance sample bleed into the next low-abundance sample.
Quantitative Stability & Batch Effects
- Internal Standards: We can spike in heavy-isotope labeled peptides (iRT kit) to monitor retention time stability and instrument sensitivity across the entire project.
- Batch Correction: For large cohorts processed over multiple days or weeks, we employ statistical batch correction methods (like ComBat) if necessary, based on the performance of bridging samples (a pooled sample run repeatedly).
Cohort-Level Standardization
- Run Order: We randomize the run order of samples. We never run "all controls" then "all treatments," as this confounds biological signal with instrument drift.
- Exclusion Criteria: We pre-define QC failure criteria (e.g., "samples with<500 protein IDs are excluded from PCA"). This prevents low-quality outliers from skewing the statistical analysis.
Sample Requirements & Spec Sheet
To ensure the best possible outcome, please review the following requirements. We encourage a consultation to discuss specific project needs, as "one size fits all" rarely applies to spatial proteomics.
| Parameter | Typical Requirement | Notes & Best Practices |
|---|---|---|
| Tissue Type | FFPE or Frozen Tissue | FFPE blocks should optimally be<5 years old for best recovery. Frozen tissue should be embedded in OCT. Check specific LCM constraints |
| Section Thickness | ~8–12 μm | Thicker than standard histology (4μm) to maximize protein yield per unit area. 10μm is often the "sweet spot" for LMD. |
| Slide Type | Membrane Slides (PPS/PEN) | Crucial: LMD requires tissue on special membrane slides (PEN or PPS). Standard glass slides cannot be used for lift-out/catapulting. We can provide these or section your blocks for you. |
| ROI Area | ~20,000–50,000 μm² | This is a rough minimum target for deep proteomic profiling (>2000 proteins). Smaller areas (e.g., single cells) require specialized "ultra-low input" workflows and yield fewer IDs. |
| Staining | Unstained, H&E, or specific IF | Stains must be MS-compatible. We avoid Mayer's Hematoxylin (if possible) and recommend specific rapid staining protocols to minimize hydrolysis. |
| Storage | -80°C | Once sectioned, slides should be stored at -80°C immediately to prevent oxidation and degradation, especially for frozen sections. |
Note on Feasibility: Pricing and turnaround timelines depend on the number of cases, ROIs per case, and acquisition method. Please contact us for a customized estimate.
Case Study: Spatially Resolved Proteomics in Action
Application Example: Uncovering Microenvironmental Drivers of Resistance
(Illustrative Workflow Based on Service Capabilities)
- Background
- Methods
- Results
- Conclusions
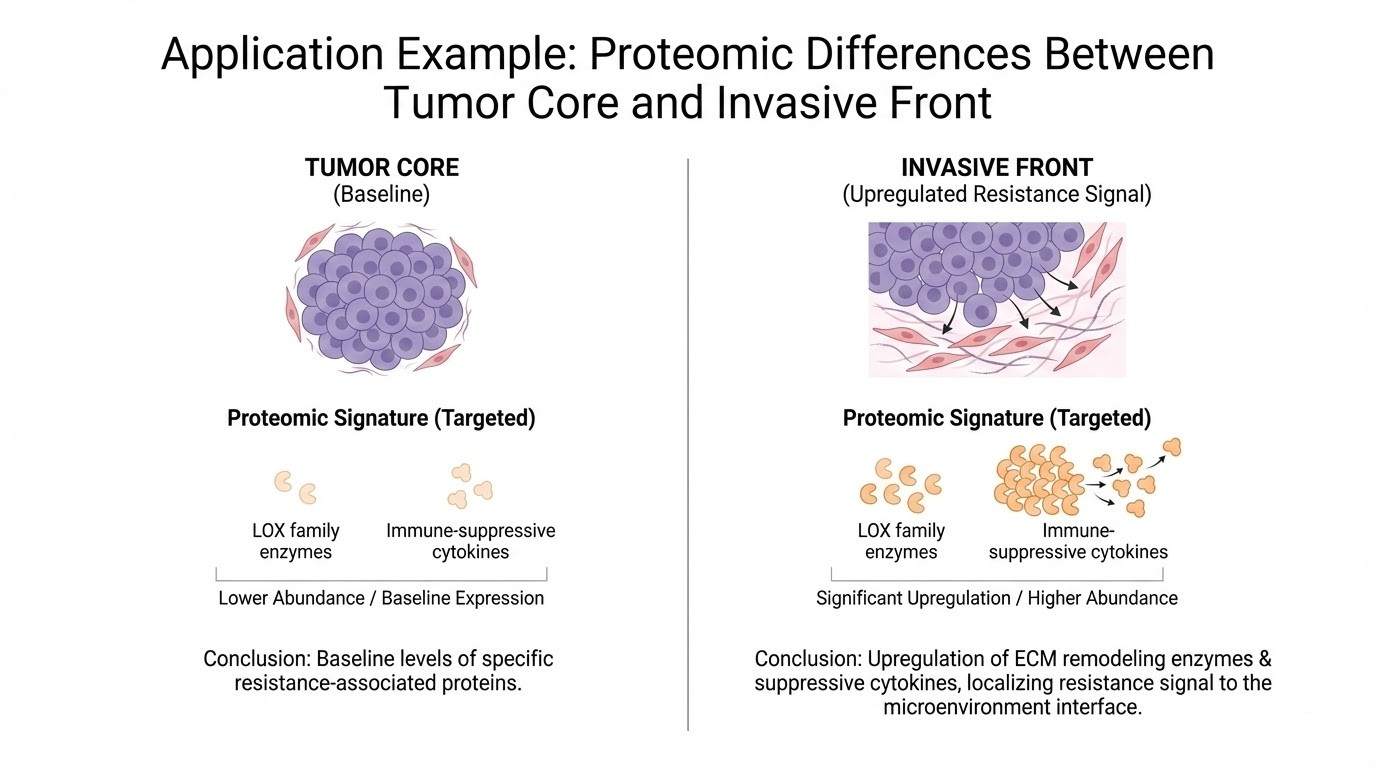
A translational oncology study aiming to understand resistance mechanisms in the tumor microenvironment (TME) required separating cancer cells from the surrounding fibrotic stroma. Bulk sequencing suggested fibrosis was involved, but could not pinpoint the effector proteins.
Using our LCM-guided workflow, pathologist-guided ROIs were defined for "Tumor Core," "Invasive Front," and "Associated Desmoplastic Stroma." Tissue was collected via LMD and processed for LC-MS/MS.
The spatial analysis revealed distinct proteomic signatures. The stromal ROI showed significant upregulation of specific extracellular matrix remodeling enzymes (e.g., LOX family) and immune-suppressive cytokines that were not detected in the tumor core or the bulk control.
The data provided clear, localized targets for stromal-modulating therapies, demonstrating that the resistance signal was compartmentalized in the stroma, not the tumor cell itself.
Frequently Asked Questions (FAQ)
Q: Can you analyze samples that are already stained?
Yes, we can often analyze H&E or specific immunofluorescence (IF) stained slides. However, the staining protocol must be reviewed. Standard clinical H&E is generally compatible, but we prefer to stain fresh sections using our MS-optimized protocol to minimize protein degradation and contamination.
Q: How many proteins can I expect to identify?
Protein ID numbers vary significantly based on ROI size, tissue type, and cellularity. A 50,000 µm² ROI from a tumor might yield 1,500–3,000 proteins, while the same area from adipose tissue yields fewer. We focus on quantitative consistency across the cohort rather than maximizing IDs in a single run.
Q: Do I need to provide the slides, or can you process blocks?
We can accept both, but sending blocks is often safer. If you send blocks, we section them onto the correct membrane slides (PEN/PPS) in our facility, ensuring optimal thickness and quality. If you must send slides, please contact us for shipping instructions to prevent membrane damage.
Q: What is the difference between this and MALDI Imaging?
LCM-MS/MS (this service) physically isolates tissue for deep proteomic sequencing (bottom-up proteomics). MALDI Imaging scans the tissue surface to map lipids, metabolites, or drugs without digestion. They are often used together: MALDI to *map* the target, LCM to *sequence* it.
Q: Can you do single-cell proteomics?
Our standard LCM service targets "regions" (typically 10–100+ cells) to ensure robust depth. Single-cell proteomics (SCP) requires a different, specialized workflow. If your ROIs are single cells, please specify this during consultation so we can assess feasibility for our SCP pipeline.
Q: Is this service suitable for clinical diagnosis?
No. This service is for Research Use Only (RUO). The data provided is for discovery and development purposes and has not been validated for clinical diagnostic use/CLIA certification.
Q: How do you handle the data analysis?
We provide a comprehensive report including the protein abundance matrix (ROI-resolved), PCA plots, volcano plots comparing ROI groups, and pathway enrichment analysis. We can also provide the raw .raw files for your internal bioinformatics team.
Learn about other Q&A.
References
- Springer Nature Primer. Laser capture microdissection. Nature Reviews Methods Primers, 2025. DOI: 10.1038/s43586-025-00453-4
- Nature Protocols. Spatially resolved analysis of FFPE tissue proteomes by quantitative mass spectrometry. Nature Protocols, 2020. DOI: 10.1038/s41596-020-0356-y
- Molecular & Cellular Proteomics. Spatially resolved proteome mapping of laser capture microdissected tissue by nanoPOTS-based proteomics. Mol Cell Proteomics, 2019. DOI: 10.1074/mcp.TIR118.000686
- Cell Systems. A framework for ultra-low-input spatial tissue proteomics. Cell Systems, 2023. DOI: 10.1016/j.cels.2023.07.004
- Critical Reviews in Analytical Chemistry. MALDI mass spectrometry imaging–guided spatial proteomics workflows. Crit Rev Anal Chem, 2025. DOI: 10.1080/14789450.2025.2537212
Ready to Start Your Spatial Project?
Don't let ROI variability compromise your study. Contact us to discuss your biological questions, and let our scientists help you design a feasible LCM-MS/MS workflow.


