Proteomics Service
Comprehensive Proteomics Solutions—From Global Discovery to Precise PRM/DIA
We deliver end-to-end, MS-based proteomics—global discovery and targeted validation—to quantify proteins, profile PTMs (phospho, glyco, acylations, ubiquitin, histone marks), and resolve protein–protein interaction networks across complex matrices (cells, tissues, plasma/serum, exosomes, membranes). Our workflows span label-free, TMT/iTRAQ, SILAC, DIA, PRM/SRM, Top-Down and peptidomics—backed by rigorous QC and reproducible bioinformatics.
Problems we solve + Advantages:
- Low-abundance proteins: Deep coverage with optimized depletion/enrichment and DIA/PRM targeting.
- PTM ambiguity: Site-specific localization with HCD/ETD and orthogonal enrichment chemistries.
- Matrix complexity: Plasma/serum and exosome proteomics with interference control and curated panels.
- Quant bias & variability: Isotope-labeled standards, multi-point calibration (R² ≥ 0.995), CV ≤ 10–15% intra-batch.
- Data confidence: Strict FDR control (peptide/protein), blank/replicate checks, benchmarked pipelines (MaxQuant, Spectronaut).
Submit Your Request Now
×
- Overview
- Proteomics Service
- Technical Platforms
- Workflow
- Applications
- Demo
- FAQs
- Case & Publications
- Sample Requirements
What is Proteomics?
Proteomics is the large-scale study of proteins—the functional 'workhorses' of the cell. Unlike genomics (which shows potential), proteomics analyzes the actual protein expression, modifications, and interactions, providing direct insights into biological functions and disease states.
Find Your Solution: Which Service is Right for My Research?
| Your Research Goal | Recommended Service Category | Key Techniques |
|---|---|---|
| "What proteins are in my sample?" (Identify everything based on a database) | Protein Identification | Shotgun Proteomics, In-Gel Digestion |
| "How do protein levels differ between my groups?" (Compare quantities, biomarker discovery) | Quantitative Proteomics | TMT, iTRAQ, Label-free (LFQ), DIA |
| "I need to precisely measure specific proteins." (Validate known targets) | Targeted Proteomics | PRM, SRM / MRM, Absolute Quantification (AQUA) |
| "What other proteins does my protein bind to?" (Find interaction partners) | Protein-Protein Interaction Analysis | Co-IP/MS, Pull-Down/MS, BioID, CX-MS |
| "Where is my protein modified?" (e.g., Phosphorylation, Glycosylation) | Post-Translational Modification (PTM) Analysis | Phosphoproteomics, Glycoproteomics, Ubiquitination Analysis |
| "Where in the cell is my protein located?" (e.g., Membrane, Exosome) | Subcellular Proteomics | Exosome Proteomics, Cell Surface Proteomics, Organelle Proteomics |
| "What is the sequence of my new antibody/protein?" (Unknown sequence, not in database) | De Novo Sequencing | De Novo Antibody Sequencing, De Novo Protein Sequencing |
| "I want to analyze intact proteins, not peptides." (Full-length PTMs, isoforms) | Top-Down Proteomics | Top-Down Sequencing, Intact Mass Analysis |
| "I want to study small peptides, not proteins." (e.g., Biomarkers, immunopeptidome) | Peptidomics Analysis | Comprehensive Peptidomics, Immunopeptidomics |
Proteomics Service in Creative Proteomics
Service Contents
- Protein Post-translational Modification Analysis
- Protein-Protein Interaction Networks
- Protein Gel and Imaging
- Protein Identification Services
- Protein Quantification
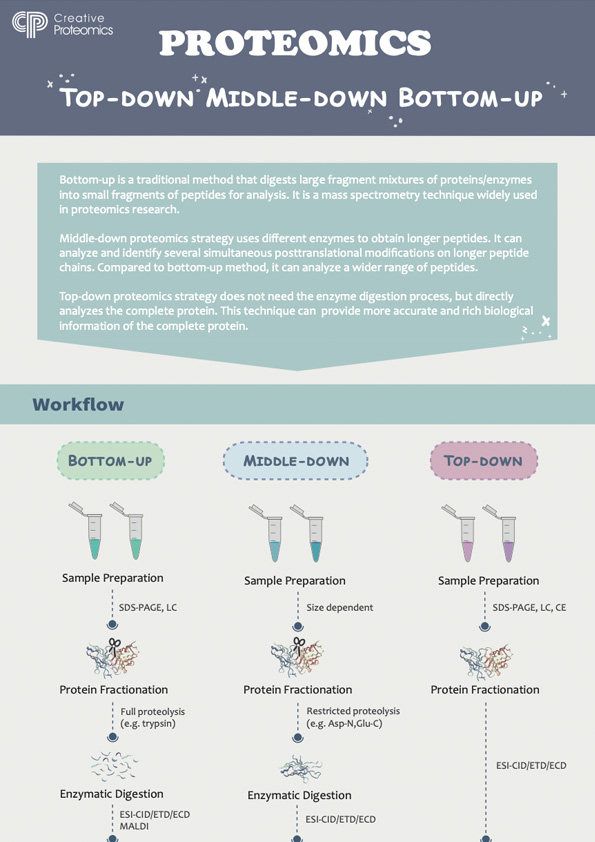
- Top Down Proteomics
- Peptidomics Analysis
- Subcellular Proteomics Service
- Exosome Proteomics
- Cell Surface Proteomics
- Plasma/Serum Proteomics Service
- Others Service
Protein Post-translational Modification Analysis
- Crotonylation Proteomics Analysis Service
- Protein Glutathione Sites Identification Service
- Histone PTMs Analysis Service
- Identification of Protein Hydroxylation Site
- Palmitoylation Site Identification Service
- Propionylation Analysis Service
- Protein Lipidation Analysis Service
- S-prenylation Site Identification Service
- Succinylation Analysis Service
Selecting Your PTM Analysis Strategy
| PTM Type | Primary Enrichment Method | Recommended Quant. | Key Challenge |
|---|---|---|---|
| Phosphorylation | TiO2 / IMAC | TMT, Label-free | Precise site localization. |
| Ubiquitination | K-ε-GG (di-Gly) Antibody | TMT, Label-free | Low signal; requires high depth. |
| Acetylation | Pan-Acetyl Lysine Antibody | TMT, Label-free | Antibody specificity. |
| Glycosylation (N-linked) | Lectin Affinity / HILIC | Label-free | Structural complexity (glycopeptides). |
Choosing the Right Quantitative Proteomics Method
| Method | Multiplexing (Samples/Run) | Best For... | Depth (Coverage) | Reproducibility (CV%) | Key Limitations |
|---|---|---|---|---|---|
| Label-Free (LFQ) | N/A (One sample per run) | Large cohorts (>20), biomarker discovery, budget constraints. | Medium-High | Medium (~15-30%) | Missing values; susceptible to batch effects. |
| TMT / iTRAQ | High (Up to 18-plex) | Medium cohorts, PTM quant, drug response, high precision needs. | High | High (<10-15%) | Ratio compression; higher cost per sample. |
| DIA | N/A (One sample per run) | Maximum depth, data re-usability, high reproducibility. | Highest | Highest (<10%) | Computationally intensive; requires a spectral library. |
| SRM / MRM | High (Targeted) | Validating known targets, clinical assays, absolute quantification. | Targeted Only | Highest (<5-10%) | Low throughput; only pre-defined targets can be measured. |
| PRM | Medium (Targeted) | Validating targets, high specificity & confidence (uses Orbitrap). | Targeted Only | Highest (<5-10%) | Higher specificity than SRM, but lower throughput. |
Peptidomics Analysis
Subcellular Proteomics Service
Focuses on proteomic analysis of specific organelles, including membranes, chloroplasts, mitochondria, and exosomes, to elucidate their protein compositions and functions.
Exosomes, lipid vesicles secreted by cells, carry proteins, lipids, and RNA, playing key roles in cell communication, immune response, and disease processes. Our service provides precise exosome isolation, advanced mass spectrometry, and bioinformatics for detailed protein profiling and biomarker discovery.
Cell surface proteins mediate vital cellular functions like signaling and immune recognition. Creative Proteomics employs cutting-edge LC-MS/MS technologies and advanced enrichment methods to ensure accurate identification and quantification.
Plasma/Serum Proteomics Service
Blood proteomics investigates circulating proteins for disease biomarkers. Advanced mass spectrometry and bioinformatics workflows enable analysis of plasma and serum proteins, focusing on low-abundance, early disease markers.
We provide customized proteomics services tailored to your specific research needs, ensuring flexibility and reliable, high-quality results.
Analytics Platform for Proteomics Services
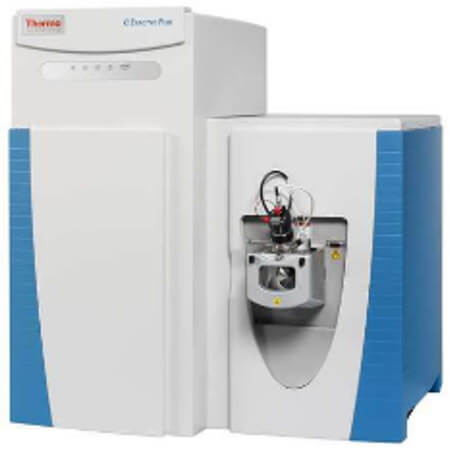
Thermo Q ExactiveTM series
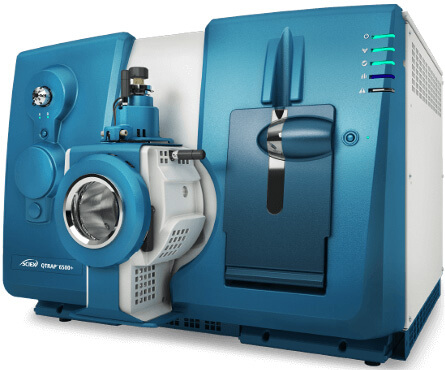
AB Sciex 6500+
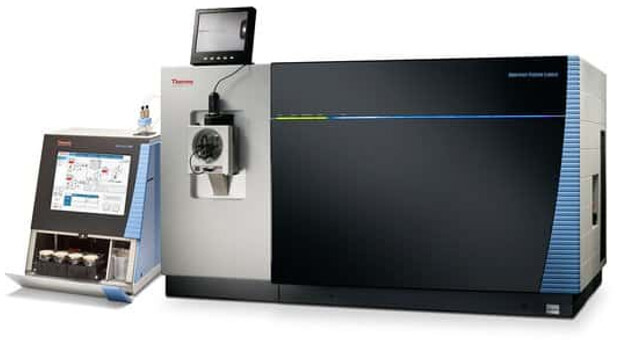
Thermo Orbitrap Fusion Lumos
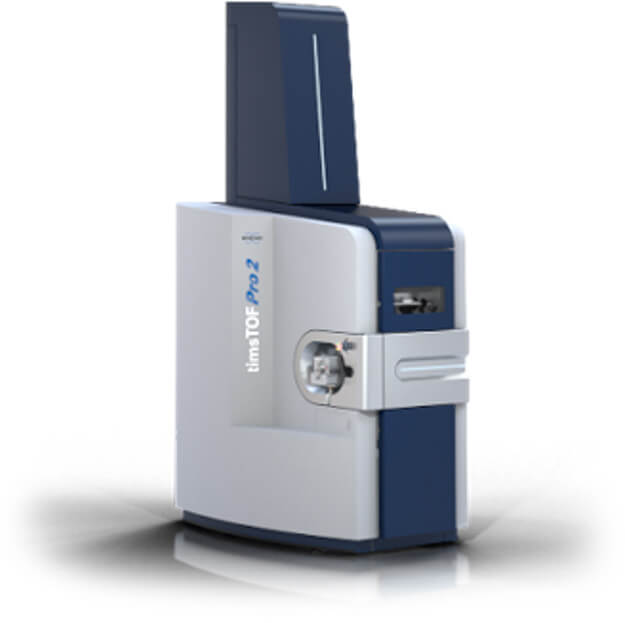
Bruker timsTOF Pro
Why Creative Proteomics?
- Professional detection and analysis capability: Experienced research team, strict and matured techniques.
- Breadth: we could skillfully deal with protein samples derived from a wide range of sources, encompassing animal and plant tissues, bacteria, blood, membrane proteins, nuclear proteins, secreted proteins, etc.
- High stability and reproducible: Obtain consistent and reproducible inter- and intra- assay results for data analysis.
- High specificity and accuracy: Skillful quantification proteomics techniques, and PTMs enrichment methods.
- High resolution and sensitivity: Triple TOF 5600, Q-Exactive, Q-Exactive HF, Orbitrap Fusion™ Tribrid.
Workflow of Our Proteomics Services
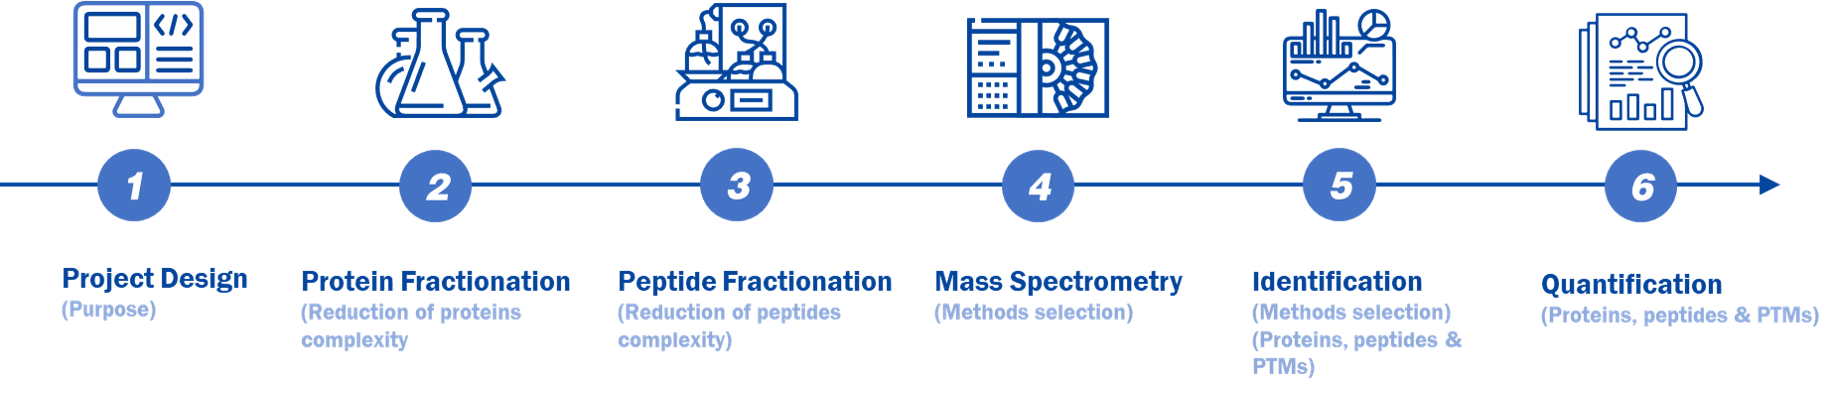 Figure 1. A typical MS-based proteomic workflow.
Experimental Procedure
- Project Design (Purpose)
- Protein Fractionation (Reduction of proteins complexity)
- Peptide Fractionation (Reduction of peptides complexity)
- Mass Spectrometry (Methods selection)
- ldentification (Methods selection) (Proteins, peptides & PTMs)
- Quantification (Proteins, peptides & PTMs)
Technical Methods
Untargeted proteomics
Targeted proteomics
PTMs proteomics
Peptidomics
Subcellular proteomics
Exosome proteomics
Cell surface proteomics
1D or 2D gel electrophoresis
lsoelectric focusing
Capillary electrophoresis
Reversed-phase liquid chromatography (RPLC)
Size-exclusion/ lon-exchange/Affinity/ Column chromatography
Immunoprecipitation
Pull down with tagged proteins
Cell surface labeling
Active site labeling
Affinity depletion.
Phosphoflow
Glycocapture
Reversed phase High Performance Liquid Chromatography (RP-HPLC)
Strong cation exchange (SCX)
Weak anion exchange (WAX)
Hydrophilic interaction (HILIC)
Immobilized metal affinity (lMAC)
Titanium dioxide (TiO,), Zirconium dioxide(ZrO,)
Lectin affinity chromatography
Immunoprecipitation
Biotinylation
Fractional diagonal chromatography
lon Source
- Electrospray lonization (ESl)
- Electron lonization (El)
- Atmospheric Pressure lonization (APl)
- Matrix-assisted laser desorption/ ionization (MALDI)
- Chemical lonization (Cl)
Mass Analyzer
- Time-of-flight (TOF)
- Quadrupie
- Orbitrap
- lon trap
- Fourier-transform ion cyclotron MS (FT-ICR)
lon Activation
- Collision-induced dissociation (ClD)
- High energy collision dissociation (HCD)
- Electron-transfer dissociation (ETD)
- Electron-capture dissoclation (ECD)
MS scanning modes
- Data Dependent Acquisition (DDA)
- Data independent Acquisition (DlA)
Database searching
De novo sequencing
PSM
FDR control
Scoring
Search engines
- MaxQuant
- Peaks
- Protein Discovery
- Spectronaut
The Main Contents of Proteomics Research


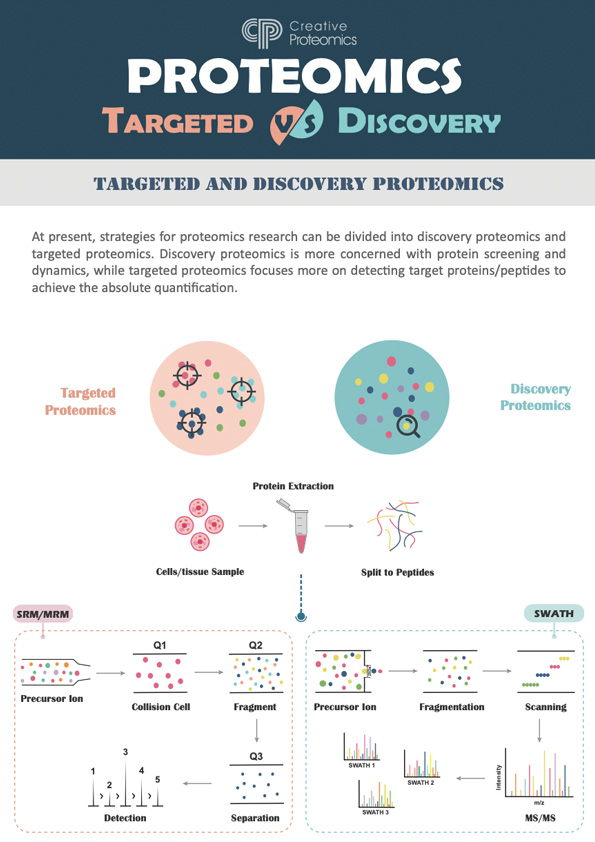
Discovery Proteomics
Proteomics identifies and catalogs proteins in biological samples, revealing uncharacterized proteins and post-translational modifications using mass spectrometry.
Targeted Proteomics
Targeted proteomics quantifies specific proteins using MRM and PRM, offering high sensitivity for studying pathways and diseases.
Differential Proteomics
Differential proteomics identifies proteins with altered expression between conditions, revealing disease mechanisms and potential biomarkers.
Functional Proteomics
Functional proteomics explores protein roles in cellular processes, including signaling, metabolism, gene regulation, and protein interactions.
Structural Proteomics
Structural proteomics studies protein structures using techniques like X-ray crystallography, NMR, cryo-EM, and modeling.
Spatial Proteomics
Spatial proteomics studies protein localization in cells, tissues, or organs using techniques like fluorescence microscopy and MALDI imaging.
Demo for Proteomics
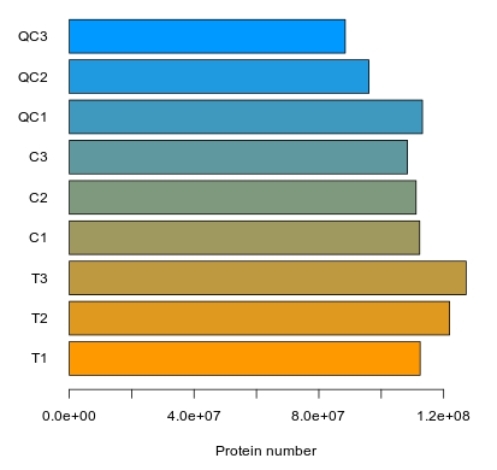
Bar Chart of Total Protein Identification
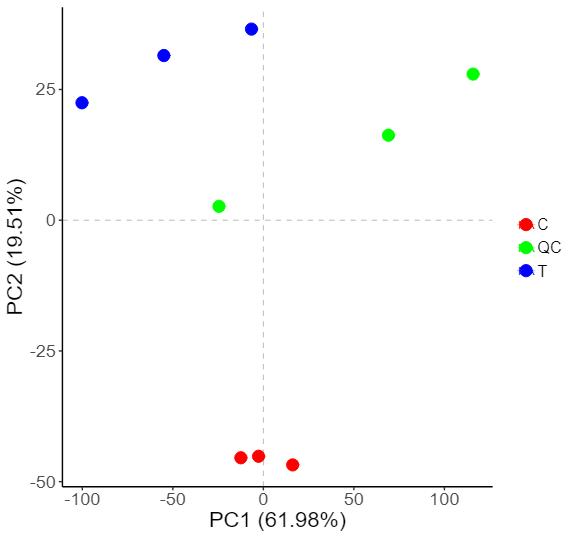
2D PCA Plot of Sample Grouping
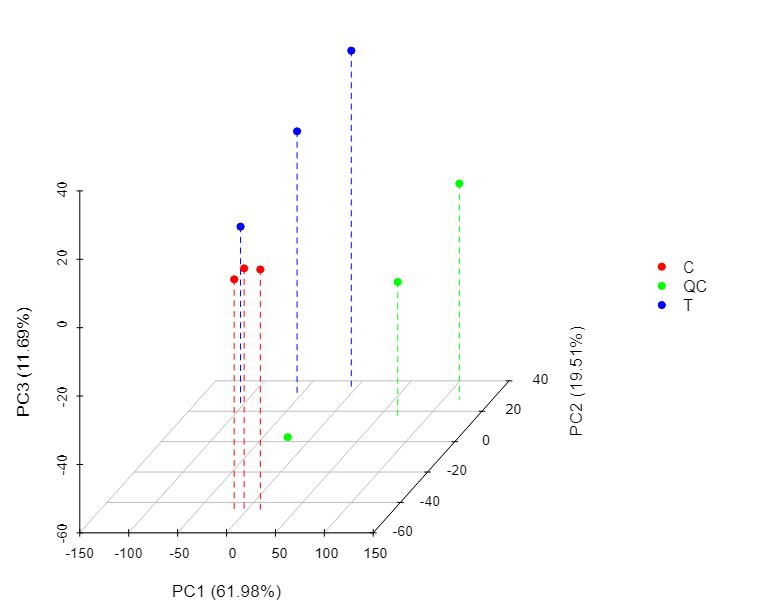
3D PCA Plot of Sample Grouping
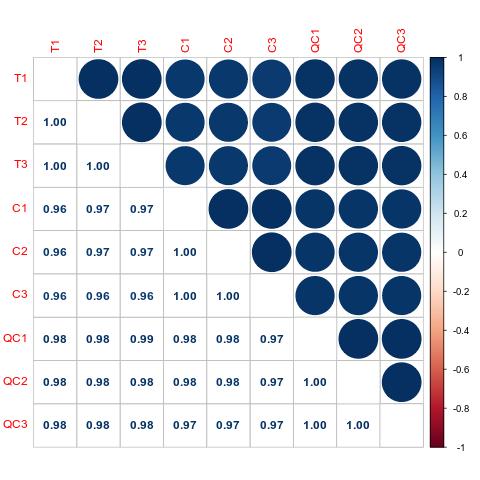
Pearson Correlation Analysis
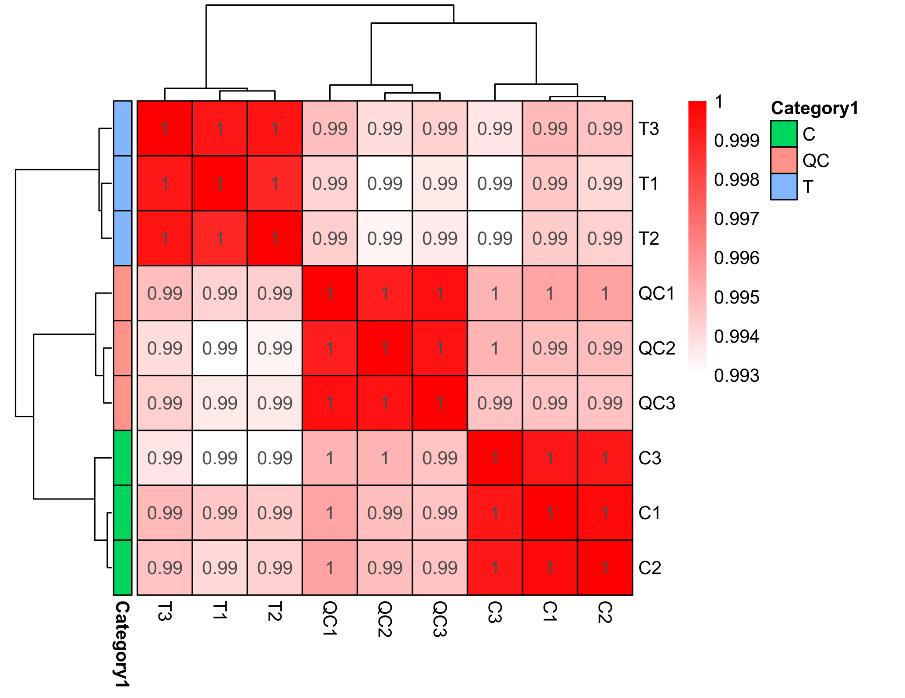
Sample Hierarchical Clustering
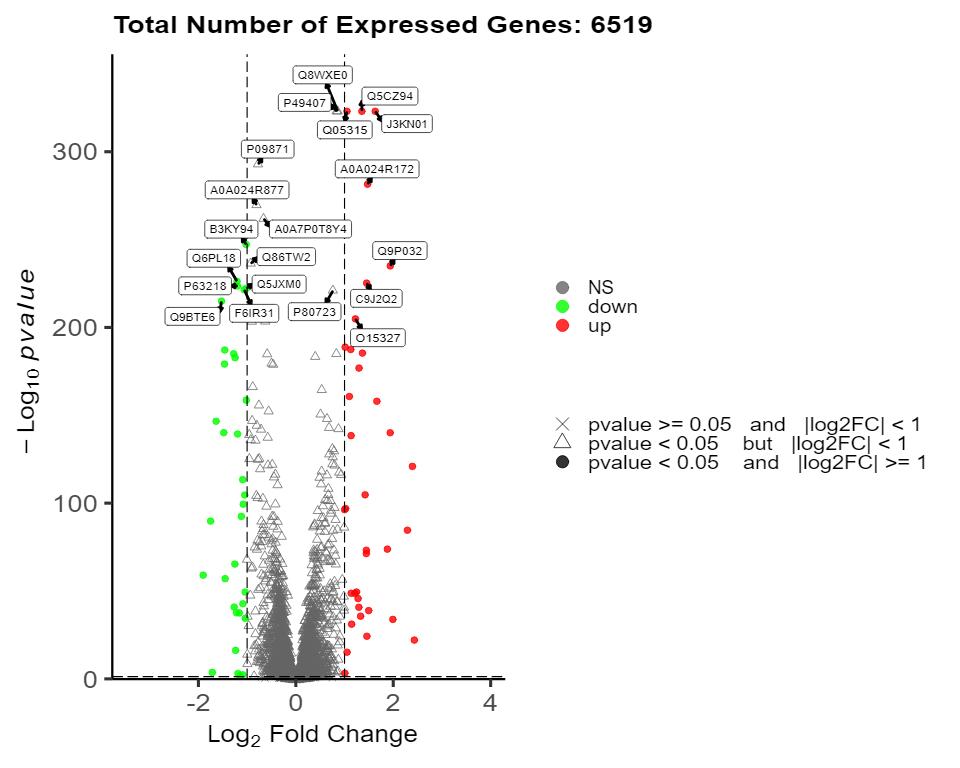
Volcano Plot of Differential Proteins
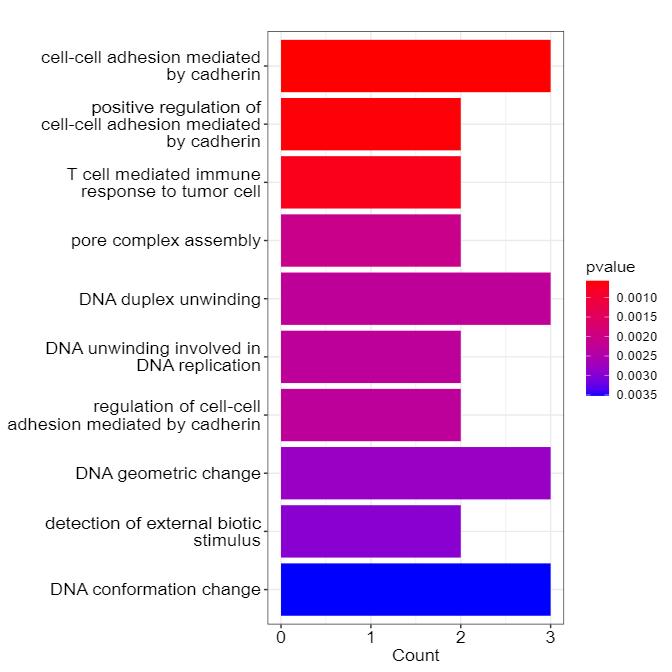
Bar Chart of GO Enrichment for Candidate Proteins
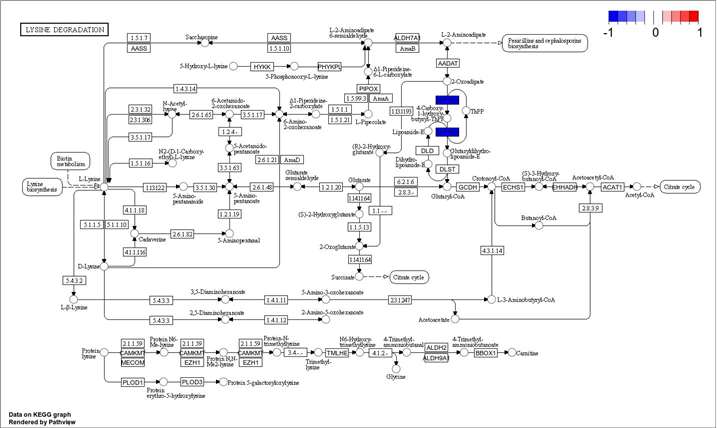
KEGG Pathway Enrichment of Candidate Proteins
Proteomics FAQs
How many biological replicates are generally recommended for proteomics?
In principle, the more biological replicates, the better, as this helps eliminate individual differences and results in more accurate identification of differential proteins, thereby increasing the success rate of validation. Considering budget constraints, statistical analysis requirements, and potential scrutiny from editors, it is recommended to have at least ten replicates per group for clinical samples, and at least three replicates per group for samples from other sources.
Which proteomics technique should I choose for my research?
TMT Labeling Technology: If your sample size is less than 18, TMT technology, which allows the simultaneous detection of up to 18 samples with good parallelism and accuracy, is recommended.
DIA Technology: If the sample size exceeds 16, DIA is more stable and reproducible, so it is recommended.
TMT vs. DIA: TMT can only detect proteins common to all samples and is not suitable for highly variable samples (e.g., different species or tissues). DIA, being label-free, can detect unique proteins in samples and is better for highly variable samples or when unique proteins are of interest.
Budget Constraints: If budget is a concern, Label-free technology can be chosen.
How should proteomics samples be shipped?
Standard biological samples such as tissues, cells, and fluids should be stored at low temperatures and shipped with dry ice. Gel strip samples can be shipped with ice packs.
Can proteomics detect unknown proteins or exogenous proteins not present in the sample species' database?
Proteomics results are compared against known protein databases, so unknown proteins cannot be predicted. If you need to detect unknown proteins, sequencing or other methods should be used. If the protein of interest is not in the database, it cannot be detected. However, the protein sequence can be added to the database as a search file for analysis.
Why are fewer proteins detected?
This could be due to a small database, leading to fewer detected results. You may expand the database or select a related, well-studied species or model organism database for analysis. Additionally, check the gel images to see if there are few bands in the sample itself or if high-abundance proteins are present, as high-abundance proteins can affect the detection quantity.
Why is there a significant difference between the molecular weight of identified proteins and those estimated from the gel electrophoresis?
Due to in vivo or in vitro factors, the same protein may undergo different modifications, cleavage, or degradation, resulting in protein bands of varying molecular weights seen on the gel electrophoresis. However, during mass spectrometry identification, these proteins point to the same theoretical, full-length, unmodified protein sequence in the database. Hence, the molecular weight seen in the gel (actual molecular weight) may differ from the identified protein's theoretical molecular weight.
How are differential proteins selected?
The criteria for selecting differential proteins mainly combine the p-value from a T-test and the FC (fold change) value. Generally, for labeled products, the criteria are FC > 1.2 or FC < 0.83, p < 0.05; for unlabeled products, FC > 1.5 or FC < 0.67, p < 0.05. During actual selection, the criteria can be relaxed or tightened, typically controlling within 20% of detected results, with 5-10% being optimal.
What validation methods should be used after proteomics?
The conventional protein validation methods include WB (Western Blot), ELISA, and PRM. If the number of proteins of interest is small and corresponding commercial test kits or antibodies are available, ELISA or WB is recommended for validation as these methods are more mature. If many proteins are of interest and commercial antibodies are unavailable, PRM is recommended. If the budget allows, antibody preparation is also a good option.
Why was the protein detected by Western Blot not detected by mass spectrometry or only detected with one peptide?
Western Blot detects target proteins by amplifying the signal many times, making it very sensitive and almost unaffected by the abundance of background proteins in complex samples (except for specificity binding). In mass spectrometry, proteins with higher abundance in the sample are preferentially detected multiple times, while lower-abundance proteins may be masked due to weak peptide signals and thus not detected. Therefore, if the target protein in the sample has low abundance, even if WB can detect it, mass spectrometry may not or may only detect a few peptides.
Why do transcriptomic data show downregulation while proteomics results show upregulation for the same batch of samples?
This is a normal phenomenon, as the relationship between upstream and downstream is not one-to-one. The conventional correlation coefficient between mRNA and proteins is only 0.4 to 0.5. The expression of a protein is controlled by many factors, including transcription factors, enhancers, inhibitors, and DNA and RNA modifications, in addition to the corresponding mRNA.
How can I improve protein yield from low-abundance samples?
For low-abundance samples, you can improve protein yield by:
- Enrichment Methods: Use protein enrichment techniques such as immunoprecipitation or fractionation to concentrate low-abundance proteins.
- Optimized Lysis Buffers: Choose lysis buffers that are effective for your specific sample type and contain protease and phosphatase inhibitors to prevent protein degradation.
- Concentrate Sample: Use techniques like ultrafiltration or lyophilization to concentrate the sample before analysis.
What are common challenges in proteomics data interpretation, and how can they be addressed?
Data Overload: Proteomics generates large datasets, which can be overwhelming. Using specialized bioinformatics tools and software can help manage and analyze the data efficiently.
False Positives/Negatives: Statistical noise or variability can lead to false positives or negatives. Applying stringent statistical criteria and validating key findings with independent methods like WB or ELISA can mitigate this.
Sample Heterogeneity: Biological variability between samples can complicate data interpretation. Ensuring sufficient biological replicates and proper experimental design can reduce the impact of sample heterogeneity.
How do I select the appropriate controls for a proteomics experiment?
- Negative Controls: Use samples that do not have the condition or treatment of interest to identify background noise or non-specific signals.
- Positive Controls: Include known proteins or peptides that should be detected to ensure the system is working correctly.
- Internal Standards: Adding stable isotope-labeled peptides or proteins as internal standards can help with quantitation and normalization across samples.
What factors should be considered when designing a proteomics experiment?
Negative Controls: Use samples that do not have the condition or treatment of interest to identify background noise or non-specific signals.
Positive Controls: Include known proteins or peptides that should be detected to ensure the system is working correctly.
Internal Standards: Adding stable isotope-labeled peptides or proteins as internal standards can help with quantitation and normalization across samples.
How can I address issues with protein solubility during sample preparation?
Protein solubility issues can be managed by:
- Choosing Appropriate Buffers: Use lysis buffers containing detergents (e.g., SDS, Triton X-100) or chaotropes (e.g., urea, guanidine hydrochloride) to solubilize proteins.
- Adjusting pH and Salt Concentrations: Modifying the pH or salt concentration in the buffer can improve solubility for specific proteins.
- Sonication or Mechanical Disruption: Applying sonication or mechanical disruption can help break down cellular structures and improve protein extraction.
Learn about other Q&A about other technologies.
Proteomics Case study
This poster showcases published research articles from our clients.

Publications
Here are some publications in Proteomics research from our clients:

- Pair bonding and disruption impact lung transcriptome in monogamous Peromyscus californicus. 2023. https://doi.org/10.1186/s12864-023-09873-6
- Morphological and genetic screens reveal mechanisms of BiDAC-induced plasma membrane protein degradation. 2024. https://doi.org/10.21203/rs.3.rs-4438596/v1
- Extracellular vesicles secreted by TDO2-augmented fibroblasts regulate pro-inflammatory response in macrophages. 2021. https://doi.org/10.3389/fcell.2021.733354
- The Interplay between GSK3β and Tau Ser262 Phosphorylation during the Progression of Tau Pathology. 2022. https://doi.org/10.3390/ijms231911610
- Control of ribosomal protein synthesis by the Microprocessor complex. 2021. https://doi.org/10.1126/scisignal.abd2639
Sample Requirements
| Sample type | Recommended sample size | |
|---|---|---|
| Animal tissues | Hard tissues (bones, hair) | 300-500mg |
| Soft tissues (leaves, flowers of woody plants, herbaceous plants, algae, ferns) | 200mg | |
| Plant tissues | Hard tissues (roots, bark, branches, seeds, etc.) | 3-5g |
| Microbes | Common bacteria, fungal cells (cell pellets) | 100μL |
| cells | Suspension/adherent cultured cells (cell count/pellet) | >1*107 |
| Fluids | Plasma/serum/cerebrospinal fluid (without depletion of high abundance proteins) | 20μL |
| Plasma/serum/cerebrospinal fluid (with depletion of high abundance proteins) | 100μL | |
| Follicular fluid | 200μL | |
| Lymph, synovial fluid, puncture fluid, ascites | 5mL | |
| Others | Saliva/tears/milk | 3-5mL |
| Culture supernatant (serum-free medium cannot be used) | 20mL | |
| Pure protein (best buffer is 8MUrea) | 300μg | |
| FFPE | Each slice: 10µm thickness, 1.5×2cm area | 15-20 slices |
Reference
- Shibata, Hirofumi et al. "A Non-targeted Proteomics Newborn Screening Platform for Inborn Errors of Immunity." Journal of clinical immunology vol. 45,1 33. 25 Oct. 2024.