Integrated Transcriptomic and Proteomic Analysis
Solve the Right Biological Questions, Not Just Generate Two Datasets
Link gene expression to actual protein output to reveal the mechanisms that move your project forward. Creative Proteomics integrates RNA-seq and mass-spectrometry proteomics so you can quantify regulation end-to-end, prioritize targets, and make confident decisions.
- End-to-end quantification: transcripts → proteins → pathways
- Concordance/discordance mapping to expose post-transcriptional control
- Publication-grade QC with transparent, numeric performance metrics
- Flexible study designs: discovery, perturbation, dose–response, time-course
Submit Your Request Now
×- What We Provide
- Advantages
- Technology Platform
- Sample Requirement
- Demo
- FAQ
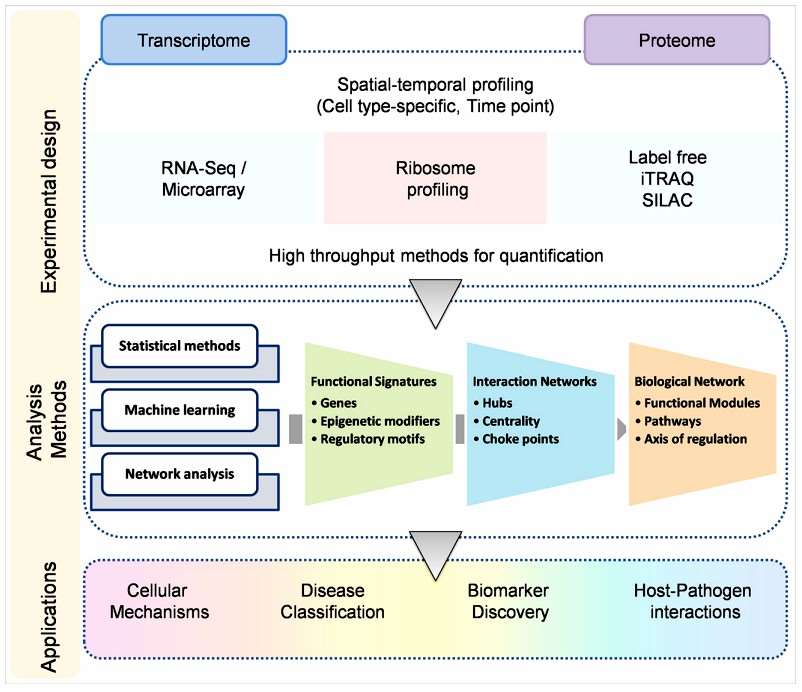
Why Integrate Transcriptomics and Proteomics in Your Study?
Understanding how biological systems respond to stimuli—or fail to—requires more than RNA-seq or proteomics alone. That's because mRNA abundance only tells half the story: protein levels are modulated by translation rates, degradation, and post-translational events that RNA cannot capture.
Integrated transcriptomic and proteomic analysis combines RNA-seq and quantitative mass spectrometry to reveal how transcriptional changes translate into actual protein-level outcomes—pinpointing which molecular shifts are functionally relevant and which are buffered or compensated.
Typical Insights Gained:
- mRNA ↑ but protein ↔ or ↓ → Suggests translational repression or rapid protein turnover
- mRNA ↔ but protein ↑ → Indicates post-transcriptional regulation or protein stabilization
- Both mRNA and protein ↑ → High-confidence biological response or drug effect
- Divergence between RNA and protein → Flags regulation at splicing, translation, degradation, or trafficking levels
This level of resolution is critical when:
- Gene expression results are inconsistent with phenotype
- You need to prioritize biomarkers or drug targets with functional output
- Regulatory networks behave unexpectedly across cell states, time points, or perturbations
By aligning molecular layers, integrated omics reveals the mechanisms that single-omics miss—and lets you act on them with confidence.
What's Included in Our Integrated Transcriptomic and Proteomic Analysis Services
Service Contents
- Transcriptomic Services (RNA-seq)
- Proteomic Services (LC–MS/MS)
- Multi-Omics Integration & Analytics
Transcriptomic Services (RNA-seq)
- Bulk RNA-seq (poly(A)+ / total RNA): Strand-specific, deep transcriptome profiling for gene-level and isoform-level quantification
- Low-Input / Degraded Sample RNA-seq: Optimized workflows for FFPE, microdissected, or low-RNA-content samples
- rRNA-Depleted RNA-seq: Capture coding and non-coding RNA, including lncRNA, circRNA, and pre-mRNA
- Time-course or Perturbation RNA-seq: Suitable for kinetic studies, dose-response, or gene knockdown/knockout experiments.
- Transcript Variant & Fusion Detection: Detect novel isoforms, splice variants, and gene fusions when relevant
- DIA-Based Label-Free Quantitative Proteomics: Reproducible, library-free quantification of >8,000 proteins per sample
- TMTpro Multiplexed Proteomics (16/18-plex): High-throughput comparison of multiple conditions with internal ratio control
- Targeted Proteomics (PRM/MRM): Absolute or relative quantification of selected proteins of interest
- Post-Translational Modification (PTM) Profiling: Phosphoproteomics, acetylation, or ubiquitination aligned with transcript changes
- Subcellular Proteomics (optional): Fractionation-based analysis of nuclear, cytosolic, or membrane-enriched proteomes
Multi-Omics Integration & Analytics
- Joint DEG/DEP Analysis: Identify regulated genes/proteins with statistical concordance scoring
- mRNA–Protein Concordance/Discordance Mapping: Classify expression shifts due to transcriptional vs. post-transcriptional regulation
- Pathway and Network Analysis: GO, KEGG, Reactome enrichment, GSEA, protein–protein interaction overlay
- Regulatory Activity Inference: Estimate TF or kinase activity shifts using downstream RNA/protein signatures
- Time-Series and Multi-Factor Modeling: Support for longitudinal data, dose gradients, or complex factorial designs
- Publication-Ready Reporting & Visualizations: Volcano plots, PCA/UMAP, heatmaps, correlation scatterplots, integrated pathway diagrams
 Integrating transcriptomics and proteomics to decipher disease biology (Kumar D, et al,. 2016)
Advantages of Our Integrated Approach
- Transcriptome depth: typical ≥ 50 M paired-end reads/sample; Q30 ≥ 85%; uniquely mapped reads ≥ 90%; strand specificity ≥ 95%.
- Proteome depth:
DIA (60-min nanoLC): > 8,000 protein groups in human cell lysate; median CV ≤ 15% across biological replicates.
TMTpro (deep fractionation): > 10,000 protein groups in human cell lysate; reporter-ion interference minimized via SPS-MS³. - Reproducibility: protein-level Pearson r ≥ 0.95 across technical replicates; iRT alignment R² ≥ 0.99.
- False discovery control: RNA and protein level FDR controlled at ≤ 5% (BH); peptide/protein-level FDR ≤ 1%.
- Dynamic range: RNA: ≥ 5 logs (counts-based); Proteins: ≥ 5–6 logs (Orbitrap-class).
- Integration quality: median mRNA–protein Spearman ρ typically 0.4–0.6 for well-powered designs; discordance classification with confidence scoring.
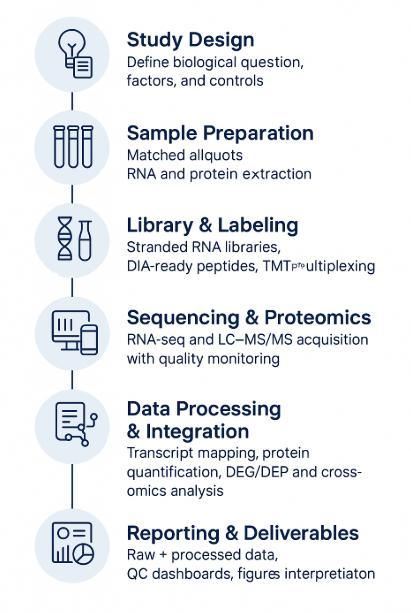
Workflow for Integrated Transcriptomic and Proteomic Analysis
- Study Definition — biological question, factors, power analysis, covariates, controls.
- Harmonized Sampling — matched aliquots, synchronized processing for RNA and proteins.
- Molecular Extraction — RNA isolation with DNase; protein extraction with denaturation/reduction/alkylation; peptide generation by trypsin/LysC.
- Library/Label Prep — stranded RNA libraries; DIA-ready peptides or TMTpro labeling; optional PTM enrichments.
- Sequencing & LC–MS/MS — platform and gradient matched to depth/throughput goals; routine QC runs.
- Primary Processing — mapping/quantification for RNA; identification/quantification for proteins; strict FDR control.
- Cross-Omics Integration — DEG/DEP calls, concordance/discordance mapping, pathway/network inference, regulator activity scoring.
- Reporting & Handover — raw + processed data, QC dashboards, figures, and an interpretation narrative aligned to decisions you need to make.
Technology Platform for Integrated Transcriptomic and Proteomic Analysis Service
Transcriptomic Analysis (RNA-seq)
Sequencing Platforms: Illumina NovaSeq X Plus, NextSeq 2000 — high-throughput, strand-specific sequencing
Read Configuration: Paired-end 150 bp (PE150) for deep transcriptome coverage
Library Prep Options: Poly(A)+ mRNA, total RNA (rRNA-depleted), or low-input protocols
Typical Metrics: ≥ 50M reads/sample, Q30 ≥ 85%, unique mapping rate ≥ 90%
Supported Features: Isoform-level quantification, splice variant detection, fusion transcript discovery
Proteomic Analysis (LC–MS/MS)
Mass Spectrometry Platforms: Orbitrap Exploris 480, Orbitrap Eclipse, Bruker timsTOF Pro 2
Quantification Modes:
- Label-Free DIA for deep coverage (≥ 8,000 proteins/sample)
- TMTpro Multiplexing (16/18-plex) for comparative studies
- Targeted PRM/MRM for high-precision validation
LC Setup: EASY-nLC 1200, Evosep One with long C18 columns (75 µm × 25–50 cm)
Key Performance Metrics: Protein-level CV ≤ 15%, dynamic range ≥ 5 logs, peptide FDR ≤ 1%
Optional: Phosphoproteomics (TiO₂/Fe-NTA enrichment), subcellular fractionation
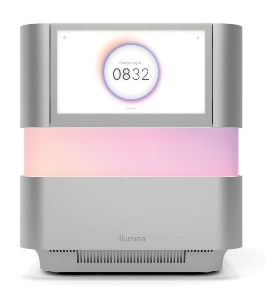
NextSeq 2000 (Figure from Illumina)
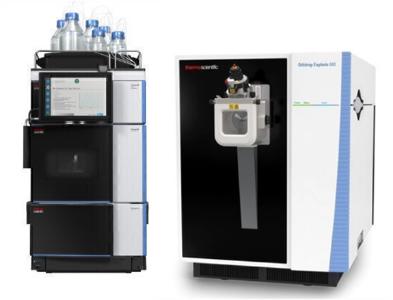
Orbitrap Exploris 480 (Figure from Thermo)
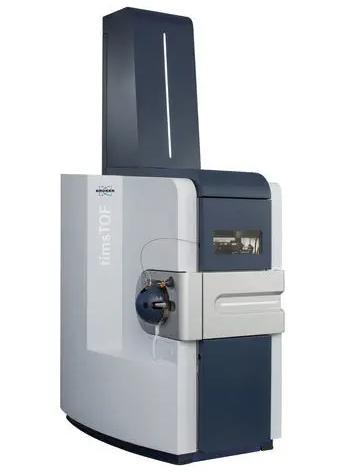
Bruker timsTOF Pro 2 (Figure from Bruker)
Sample Requirements for Integrated Transcriptomic and Proteomic Analysis Service
| Assay | Material | Amount (minimum) | Quality Criteria | Buffer/Container | Storage & Shipping |
|---|---|---|---|---|---|
| Bulk RNA-seq (poly(A)+) | Total RNA | ≥ 1 µg (≥ 200 ng acceptable with low-input kits) | RIN ≥ 7.0, A260/280 = 1.8–2.1, rRNA < 5% | RNase-free water/EB; low-bind tubes | −80 °C; ship on dry ice |
| Bulk RNA-seq (rRNA-depleted) | Total RNA | ≥ 1 µg | RIN ≥ 6.5 (degraded-tolerant), A260/230 > 1.8 | As above | As above |
| RNA-seq (from tissue/cells) | Cell pellets or tissue | ≥ 1×10⁶ cells or ≥ 20 mg tissue | Fresh-frozen preferred; no RNAlater salts in MS aliquot | Cryo vials | −80 °C; dry ice |
| DIA Proteomics (label-free) | Protein lysate | ≥ 50 µg (≥ 200 ng for low-input runs) | A260/280 ~0.6; no SDS > 0.1% post-cleanup; salts < 50 mM | MS-compatible buffer; low-bind | −80 °C; dry ice |
| TMTpro Proteomics | Protein lysate per channel | ≥ 75–100 µg | Same as above; avoid primary amines in buffers | As above | −80 °C; dry ice |
| Phospho-Proteomics | Protein lysate | ≥ 500 µg (enrichment) | Phosphatase inhibitors during lysis | As above | −80 °C; dry ice |
Notes: Avoid guanidine and high SDS; Tris ≤ 50 mM for TMT; document any chaotropes/detergents used. Provide matched aliquots for RNA and proteomics when possible.
Use Cases
Target Prioritization in Drug Discovery
Confirm that transcript hits produce coherent protein-level changes and pathway activation; de-prioritize transcriptional noise.
Biomarker Shortlisting
Cross-check RNA signals with quantitative proteomics to nominate markers that are detectable, stable, and assayable.
Mechanism-of-Action Clarification
Map DEG/DEP concordance, PTM shifts, and regulator activity to explain phenotypes and off-target effects.
Perturbation Studies (CRISPR/siRNA/compounds)
Identify pathways consistently altered across RNA and protein layers; reduce false positives from single-omics.
Time/Dose Response Profiling
Capture RNA–protein kinetics (translation, turnover, feedback) to interpret delays and sustained effects.
Bioprocess & Manufacturing QA
Verify that engineering changes translate to protein output and pathway performance; support process optimization.
Demo Results
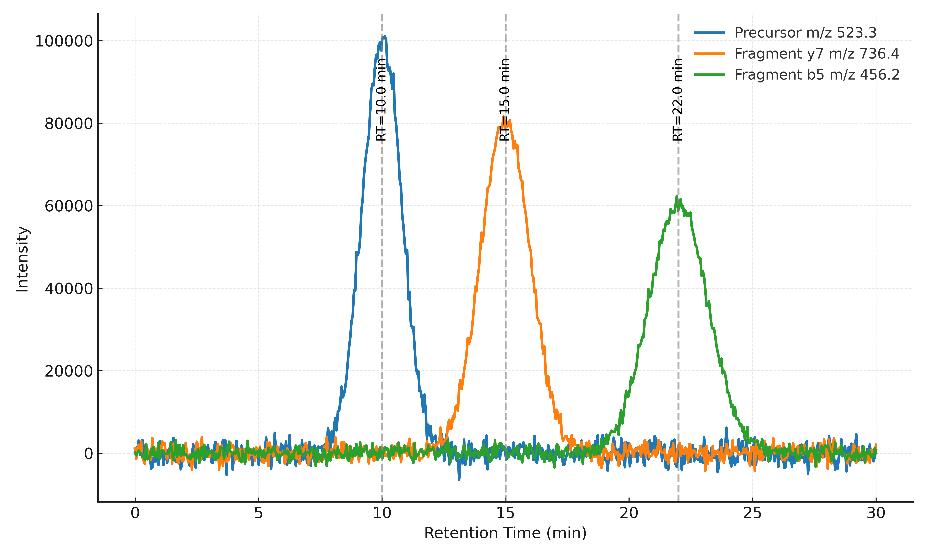
Extracted ion chromatogram (XIC) showing precursor and fragment ion traces. Peaks at distinct retention times confirm peptide detection and chromatographic separation.
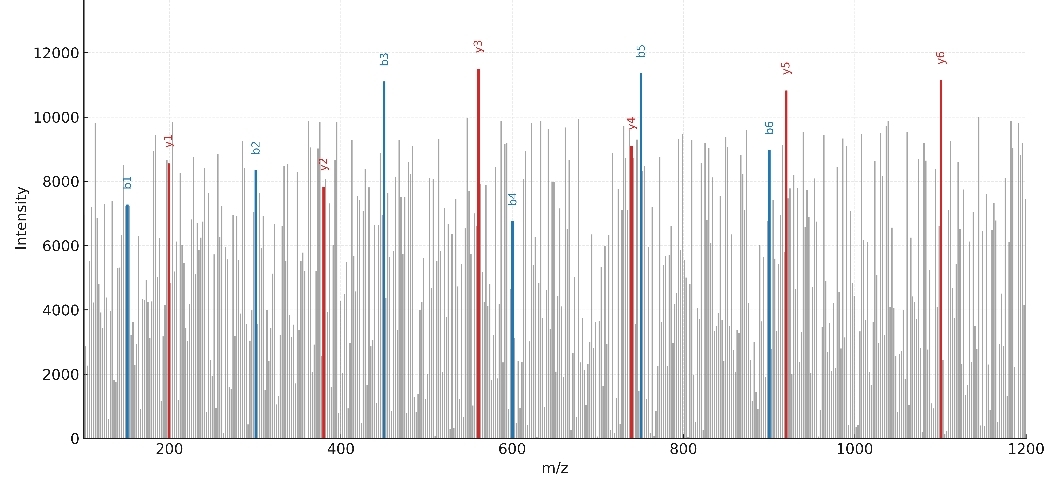
Representative MS/MS spectrum of a peptide with annotated b- and y-ion series. Fragment peaks confirm peptide sequence identification with high confidence.
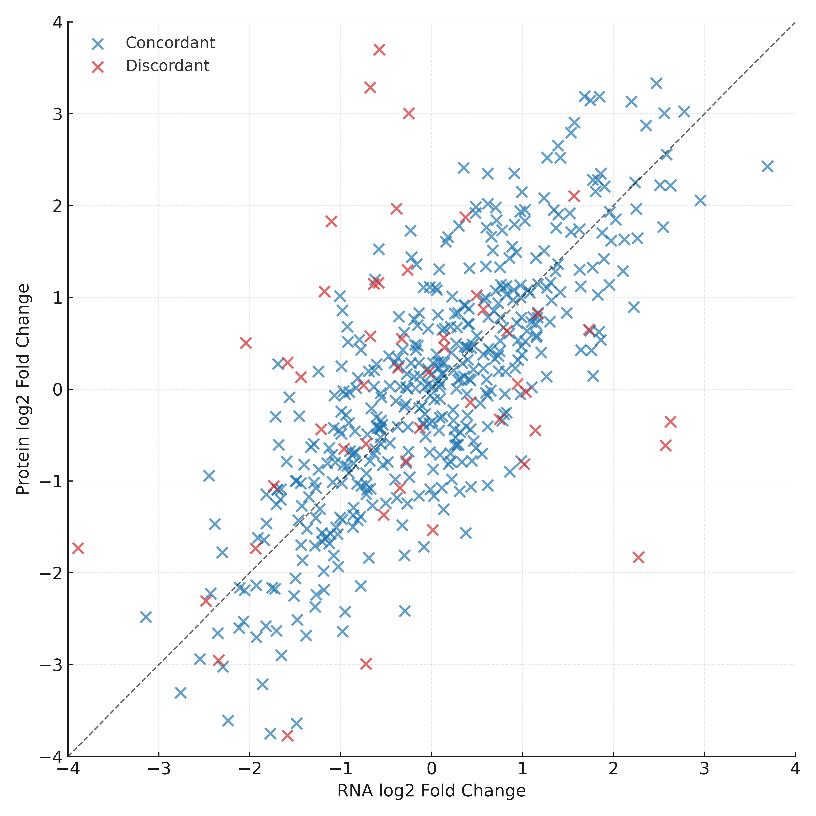
Scatter plot comparing RNA log2 fold change and protein log2 fold change. Concordant genes cluster along the diagonal, while discordant genes highlight post-transcriptional regulation or protein stability effects.
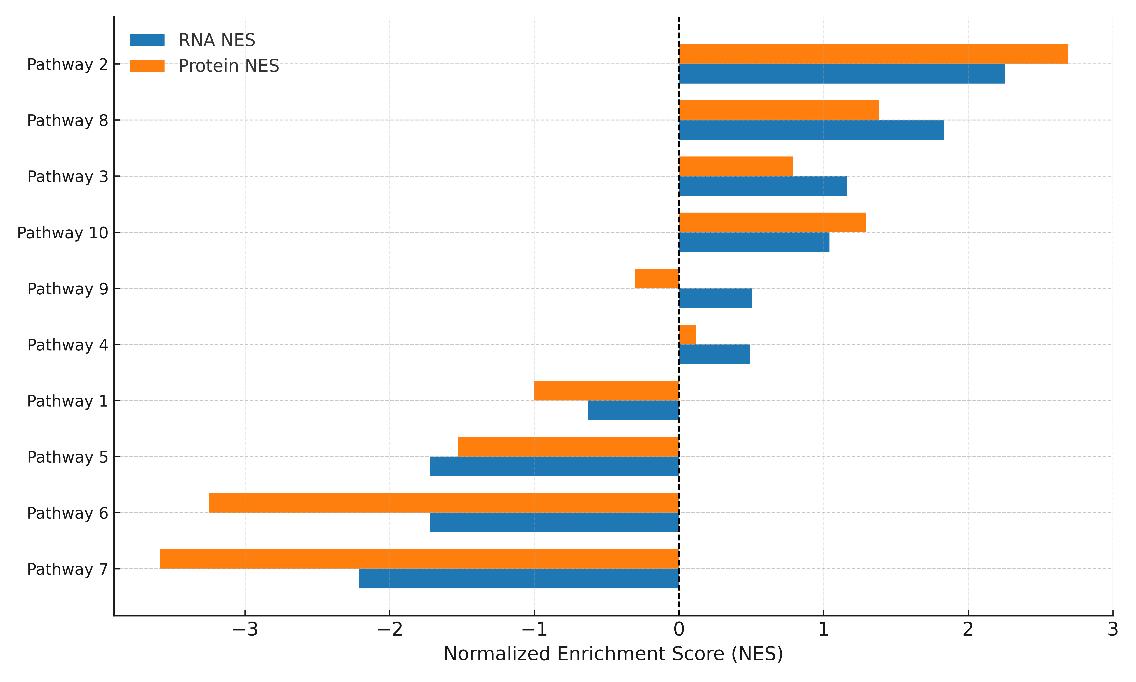
Comparison of normalized enrichment scores (NES) for key pathways based on RNA-seq and proteomic data. Parallel bars highlight concordant or divergent pathway activity across omics layers.
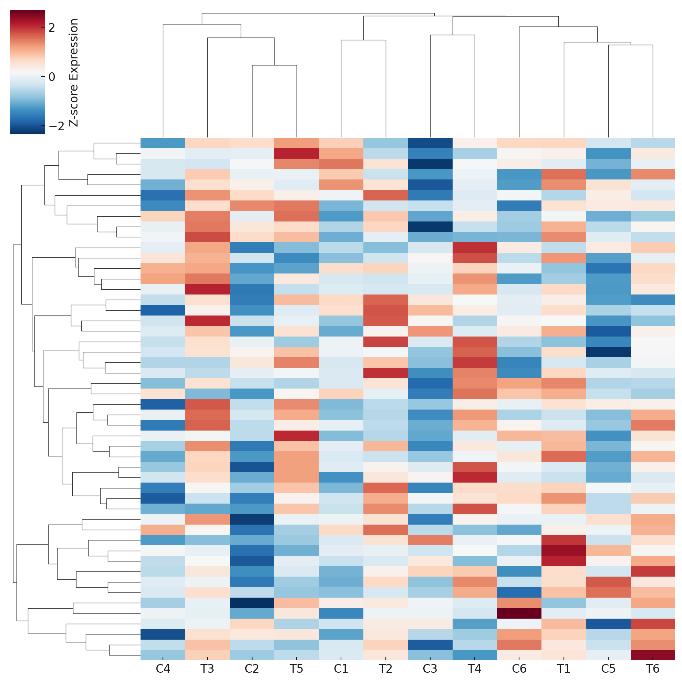
Heatmap of differential expression for representative genes across control and treatment samples. Hierarchical clustering reveals distinct group separation.
FAQ of Integrated Transcriptomic and Proteomic Analysis
How do I choose between DIA label-free and TMTpro multiplexing for an integrated study?
Use DIA for deeper dynamic range and minimal ratio compression when the number of conditions is modest; use TMTpro when many conditions must be compared in one run and you want channel-wise internal normalization. We harmonize either choice to RNA-seq via shared references and cross-omics scaling.
How is comparability ensured between RNA and protein layers?
Matched aliquots, synchronized extraction, unified randomization, shared reference materials, and post-hoc batch correction (e.g., ComBat/limma). Concordance is summarized with rank-based fusion and correlation metrics after independent normalization per layer.
How are non-detects and missing values handled in proteomics vs RNA-seq?
We distinguish Missing-At-Random from left-censored Missing-Not-At-Random. RNA counts use model-based shrinkage; proteomics uses intensity-aware imputation or censored-LS/MaxLFQ-compatible methods, then sensitivity analyses to confirm conclusions are robust to the imputation choice.
What statistics define "jointly regulated" targets?
DEG/DEP are called per layer with multiple-testing control; joint evidence uses meta-analysis (e.g., Stouffer/Lipták) or rank-product with concordant effect directions. Discordant hits are flagged and routed to mechanistic buckets (translation, stability, PTM).
How is mRNA–protein discordance interpreted operationally?
We classify patterns (↑/↔/↓) and annotate plausible mechanisms using translation/stability scores, ubiquitin–proteasome signatures, and pathway context. Prioritization rules favor protein-level changes aligned with pathway activation and phenotype.
How are PTMs incorporated without diluting total-protein signals?
PTM-enriched datasets are normalized separately, then mapped to substrates and kinases/TFs (e.g., KSEA, activity-inference frameworks). Total-protein abundance is used as an offset to avoid confounding phosphorylation stoichiometry with protein amount.
What about isoforms, paralogs, and shared peptides in protein inference?
Protein groups are reported with unique-peptide evidence; gene-level rollups are supplied for cross-layer mapping. Ambiguous peptides are retained for quant but excluded from "unique-only" validations when needed.
How do you align identifiers across RNA and protein unambiguously?
Stable gene IDs (Ensembl/Entrez) anchor mapping; protein accessions are cross-referenced via GENCODE/UniProt; versioning is frozen per project to guarantee re-analysis reproducibility.
How do you control batch effects when sequencing and LC–MS/MS are run separately?
Shared pooled references on every plate/run, interleaved acquisition orders, and layered QC (iRT, process blanks). Residual batch structure is modeled as covariates and verified with RLE/PCA diagnostics.
How should I decide on replicates and design complexity without overpaying?
Start from expected effect sizes and variance from prior or pilot data; emphasize biological replication over technical; use blocking and balanced randomization to maximize power at constant sample count.
Can time-course or dose-response studies be integrated reliably?
Yes—we use linear mixed models or spline-based trends per layer, then integrate at the level of model coefficients and pathway trajectories rather than per-contrast snapshots.
How are extreme abundance proteins or ribosomal RNA contamination prevented from biasing results?
For RNA, stranded poly(A)+ or rRNA-depletion is selected based on matrix; for proteins, dynamic range management uses optimized gradients/FAIMS and intensity-aware normalization; QC thresholds gate problematic libraries or runs.
How are multiple matrices (e.g., tissue vs cell line vs biofluid) compared in one project?
Matrix-specific extraction and LC–MS methods feed into a unified analysis where matrix is an explicit factor; contrasts are computed within matrix and then meta-analyzed to avoid composition bias.
What deliverable formats best support downstream modeling or LIMS ingestion?
Layer-specific matrices (counts/TPM/VST; peptide/protein intensities/normalized abundances), annotated contrasts with log2FC and FDR, and tidy long-format tables with harmonized IDs for direct import to R/Python pipelines.
How are outliers diagnosed and handled across omics?
Multi-metric QC (library complexity, mapping %, peptide IDs, CVs, iRT fit), robust PCA/UMAP, and influence diagnostics. Outliers are quarantined with a prespecified decision rule; conclusions are stress-tested with and without them.
Can single-cell RNA be integrated with bulk or DIA proteomics?
Integration is feasible at pathway or gene-set level: pseudo-bulk or cell-state signatures from scRNA-seq are correlated with bulk proteome changes; cell-type deconvolution helps interpret bulk protein shifts.
How do you prioritize actionable biomarkers/targets from hundreds of hits?
A scoring rubric ranks candidates by cross-layer consistency, effect size, pathway centrality, prior knowledge, assayability, and technical robustness (missingness, peptide uniqueness), producing a short, defensible list for follow-up.
What metadata are essential to avoid confounding?
Sample provenance, passage/lot, harvest conditions, inhibitors, storage history, extraction date, run order, operator, and instrument session. Complete metadata enables covariate modeling and audit-ready reproducibility.
Can additional omics (metabolomics, lipidomics) be added later without rerunning RNA/protein?
Yes—design-compatible aliquots and stable IDs allow staged expansion; cross-omics integration is layered so new modalities plug into existing contrasts and pathways without breaking provenance.
Learn about other Q&A about proteomics technology.
Publications
Below are some of the papers published by our clients:

- Physiological, transcriptomic and metabolomic insights of three extremophyte woody species living in the multi-stress environment of the Atacama Desert. 2024.
- Thermotolerance capabilities, blood metabolomics, and mammary gland hemodynamics and transcriptomic profiles of slick-haired Holstein cattle during mid lactation in Puerto Rico. 2024.
- Pair bonding and disruption impact lung transcriptome in monogamous Peromyscus californicus. 2023.