Amylopectin Chain Length Distribution Profiling
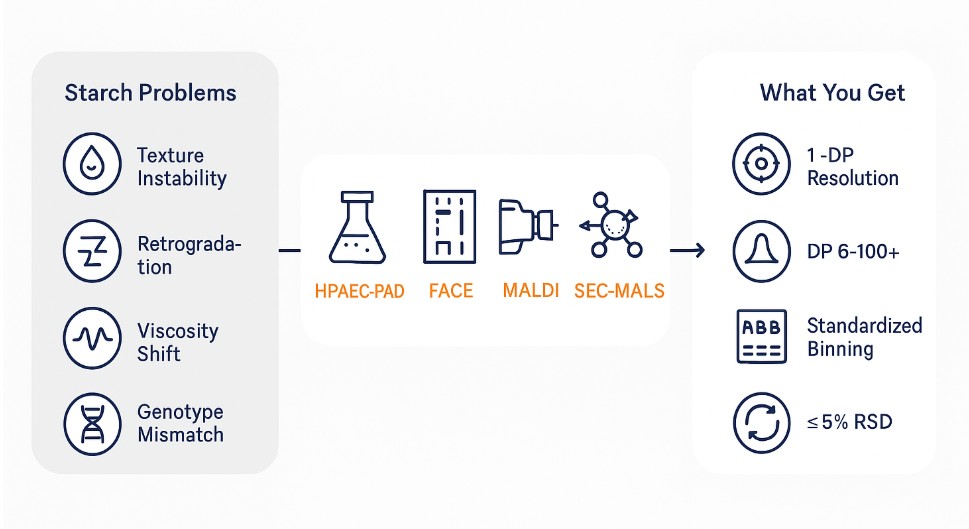
Starch performance swings when amylopectin chains shift. We profile chain length distribution to explain texture, viscosity, retrogradation, and processing tolerance—so you can select sources, tune processes, and de-risk formulation.
- Single-DP sensitivity in A/B1 ranges for detecting subtle structural shifts
- Broad DP coverage (≈6–100+) to capture short, intermediate, and long branches
- Orthogonal verification with MALDI-TOF and SEC-MALS for robust conclusions
- Decision-ready deliverables: clear plots, standardized bins (A, B1–B3+), concise interpretation
- Matrix-aware methods for native, modified, and engineered starches
- Comparability by design using consistent DP binning and overlay reporting
Submit Your Request Now
×
- What We Provide
- Advantages
- Workflow
- Method
- Sample Requirements
- What You Receive
- FAQs
Understand Amylopectin Structure to Optimize Starch Functionality
Amylopectin is the highly branched fraction of starch. It consists of α-1,4–linked glucan chains with α-1,6 branch points arranged in clustered domains. These clusters create short "A" chains and longer "B" chains that bridge layers and shape granule architecture.
Amylopectin chain length distribution profiling is essential for characterizing the molecular architecture of starches in food, agricultural, and industrial applications. As the major branched component of starch, amylopectin's structure directly influences gelatinization behavior, retrogradation, digestibility, and overall product performance.
Amylopectin chain length distribution profiling reveals how this architecture is built and how it behaves. We debranch native starch, quantify linear glucans across degree-of-polymerization windows, and map A and B chain classes. Results arrive as interpretable fingerprints you can compare across cultivars, treatments, and processing steps. The service includes clear figures, method notes, and an interpretation memo aligned to your research question.
Why Analyze Amylopectin Chain Length?
Variations in amylopectin chain length affect how starch behaves during heating, cooling, and enzymatic digestion. Short chains tend to improve solubility and reduce retrogradation, while longer chains enhance thermal stability and gel strength.
Common industry challenges include:
- Inconsistent texture in processed foods
- Unpredictable viscosity during formulation
- Limited shelf-life due to starch retrogradation
- Difficulties in breeding high-performance starch crops
Profiling the chain length distribution provides a molecular-level view to solve these issues and fine-tune starch performance.
Amylopectin Chain Length Profiling for Structural Starch Analysis
Creative Proteomics provides targeted analysis of amylopectin structure across a wide range of starch types and conditions. Our services include:
- Chain length distribution profiling of native and chemically or enzymatically modified starches
- Comparative structural analysis between wild-type and genetically modified lines or enzyme-treated samples
- Assessment of processing impact, such as heat, shear, or drying, on amylopectin branching and chain dynamics
- Support for breeding and crop evaluation through molecular characterization of starch traits linked to functionality
All analyses include high-resolution distribution plots, chain class annotations, and interpretation aligned with your research objectives.
Analyte Coverage: Short to Long Glucan Chains (DP6–100+)
Our profiling resolves linear glucan chains across a broad range of degrees of polymerization (DP), including:
- Short chains (DP 6–12) – Associated with crystallinity and rapid retrogradation
- Intermediate chains (DP 13–24) – Influence gelatinization and paste viscosity
- Long chains (DP >25) – Contribute to gel strength and thermal stability
- Very long chains (DP >100) – Detected depending on method sensitivity and sample quality; relevant for branching architecture
We analyze starches from diverse botanical origins, including maize, rice, potato, cassava, wheat, and custom-bred hybrids.
Table 1. Branch chain length distributions of amylopectins
| Source | Peak DP | % distribution | Highest detectable DP | ||||
|---|---|---|---|---|---|---|---|
| I | II | DP 6–12 | DP 13–24 | DP 25–36 | DP ≥ 37 | ||
| Normal maize | 13 | 48 | 17.9 | 47.9 | 14.9 | 19.3 | 80 |
| Waxy maize | 14 | 48 | 17.0 | 49.4 | 17.1 | 16.5 | 73 |
| Rice | 12 | 46 | 19.0 | 52.2 | 12.3 | 16.5 | 80 |
| Wheat | 12 | 41 | 19.0 | 41.7 | 16.2 | 13.0 | 77 |
| Tapioca | 12 | 49 | 17.3 | 40.4 | 15.6 | 26.7 | 79 |
| Hylon V | 16 | 48 | 9.7 | 43.9 | 20.3 | 26.1 | 86 |
| Hylon VII | 16 | 48 | 8.5 | 40.7 | 21.3 | 29.5 | 86 |
| Potato | 14 | 52 | 12.3 | 43.3 | 15.5 | 28.9 | 85 |
| Green leaf canna | 15 | 52 | 11.7 | 45.3 | 16.2 | 26.8 | 85 |
Advantages of Our Chain Length Profiling Service
- Single-DP Resolution: Detects chain differences as small as 1 DP unit, ideal for distinguishing A/B1 chains in the DP6–25 range.
- Wide Quantitation Window (DP 6–100+): Captures full chain spectrum—from short crystallinity-linked chains to long branches driving gel properties.
- Consistent Reproducibility (≤5% RSD): Low variance across runs ensures confidence in batch comparisons and trait screening.
- Matrix Flexibility: Works with native, modified, and processed starches from maize, rice, potato, cassava, and beyond.
- Interpretable Output: Reports link CLD features to starch behavior (e.g., retrogradation, gelatinization), aiding decision-making.
- Optional Cross-Validation: MALDI-TOF or SEC-MALS available to confirm chain size or link to molar mass profiles.
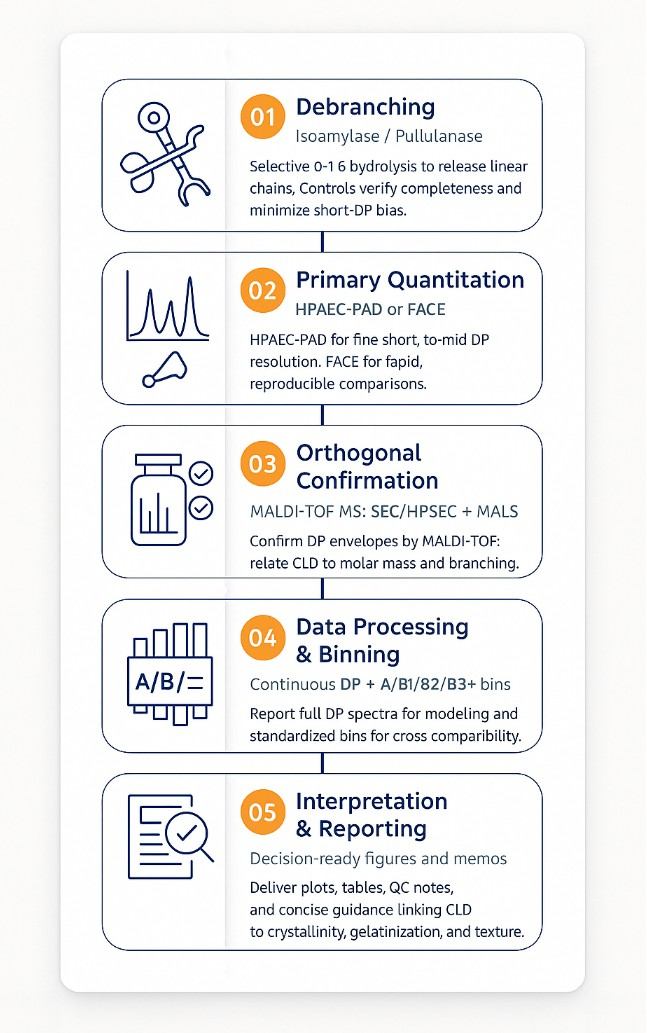
Branched Chain Amino Acid Analysis Workflow: Step-by-Step Process
- Debranching
Starch is enzymatically debranched using isoamylase and/or pullulanase to release linear glucans. Dual-enzyme treatment improves completeness and minimizes residual branching. Blanks and enzyme-only controls confirm specificity. - Primary Quantitation (method selected by sample type and target DP range)
- HPAEC-PAD – High resolution for short to mid-range DPs; sensitive to subtle shifts in A/B1 chains.
- FACE (fluorophore-assisted electrophoresis) – Fast, reproducible, ideal for comparative screens and modeling.
- Orthogonal Confirmation (as needed)
- MALDI-TOF MS – Mass-based confirmation of DP ranges and distribution shifts.
- SEC/HPSEC ± MALS – Provides whole-molecule insight; links CLD to molar mass and branching density.
- Data Processing and Binning
Results include both full DP distributions and standardized chain bins: A (short), B1, B2, B3+. Binning aids comparison; continuous data supports structural modeling. - Interpretation and Reporting
Deliverables include figures, tables, and a focused memo interpreting CLD patterns in context of starch behavior and your research goals. We also recommend follow-up assays where relevant.
Amylopectin Chain Length Distribution (CLD): Technical Notes & Platform Selection
| R&D goal / scenario | Primary platform | When to add | What you get | Keep in mind |
|---|---|---|---|---|
| Subtle shifts in short DP (A/B1) | HPAEC-PAD | — | Highest short–mid DP resolution; sensitive comparisons | Needs good desalting; watch carryover |
| Fast screening, many samples | FACE | MALDI-TOF (spot checks) | Rapid, reproducible patterns | Keep labeling/imaging consistent |
| Quick DP envelope confirmation | MALDI-TOF MS | HPAEC-PAD (if finer detail needed) | Mass-based DP across broad span | Minimize salts; manage adducts |
| Link CLD to size/branching | SEC/HPSEC ± MALS | HPAEC-PAD (recover short-DP detail) | Apparent molar mass + branching context | Gentle filtration; non-degrading solvents |
| Unknown or mixed matrices | HPAEC-PAD (pilot) | MALDI-TOF or SEC-MALS (as results dictate) | Reliable baseline CLD; then orthogonal view | Start small; expand only if signals warrant |
| Cross-batch/cultivar comparability | HPAEC-PAD + standardized bins | SEC-MALS (if whole-molecule context matters) | Continuous DP + A/B1/B2/B3+ bins | State effective DP window used |
Minimal QC (kept short): verify debranching completeness; report both continuous DP and standardized bins when comparability is critical.
Dionex ICS-5000+ (Figure from Thermo)
Bruker ultrafleXtreme (Figure from Bruker)
Sample Submission Guidelines for CLD Profiling
| Sample Type | Recommended Amount | Storage Conditions | Pre-treatment Notes |
|---|---|---|---|
| Purified starch powder | ≥ 10 mg | Room temp, desiccated | Preferably dried and finely ground. Avoid moisture absorption or heat exposure. |
| Plant tissue (dried) | ≥ 100 mg | Cool, dry place (≤25°C) | Remove excess skin/husk. Air- or oven-dry if moisture is >10%. Clearly label genotype. |
| Plant tissue (fresh/frozen) | ≥ 300 mg (fresh weight) | -20°C or below | Flash freeze in liquid nitrogen if possible. Avoid freeze–thaw cycles. |
| Food products (solid) | ≥ 1 g | 4°C for short-term; -20°C for longer | Minimize fat/protein content if possible. Provide ingredient info if processed. |
| Liquid samples / extracts | ≥ 1 mL at ≥1 mg/mL starch | 4°C or -20°C depending on stability | Submit in sealed cryovials or tubes. Specify solvent or matrix composition. |
| Modified starch (chemically or enzymatically treated) | ≥ 10 mg | Room temp or as required | Provide treatment details: enzyme, pH, time, modifiers used. |
| Custom or novel materials | Contact us | Case-dependent | We will assess matrix compatibility during intake. |
Additional Notes
- Label all samples clearly with sample name, source, treatment (if any), and replicate ID.
- Send replicate samples if statistical confidence is needed (we recommend n=2–3).
- Shipping tip: Use insulated packaging with ice packs for perishables. Avoid shipping before weekends.
What You Receive: Actionable Amylopectin CLD Data
- Chain length histograms and tables: Mole fraction or counts by DP and by A/B bins.
- Comparative overlays: Multi-sample plots for quick visual comparison across conditions.
- Method notes and QC summary: Debranching parameters, detector checks, and system suitability.
- Optional whole-molecule metrics: SEC/HPSEC ± MALS summaries to frame CLD in macromolecular context.
- Interpretation memo: Practical implications for processing, texture, and biosynthetic inferences.
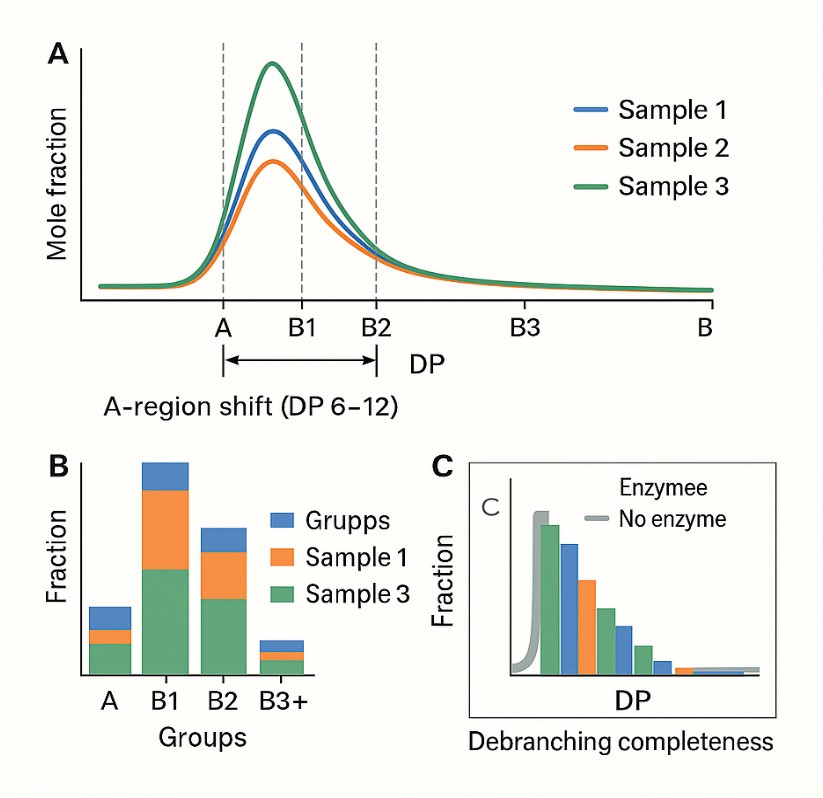
Short-to-Mid DP Resolution Overlay (HPAEC-PAD).
(A) Normalized mole-fraction curves across DP with guides at A, B1, B2 cutoffs reveal short-chain shifts between samples. (B) Binned fractions (A/B1/B2/B3+) enable cross-sample comparison. (C) Enzyme vs no-enzyme trace confirms debranching completeness.
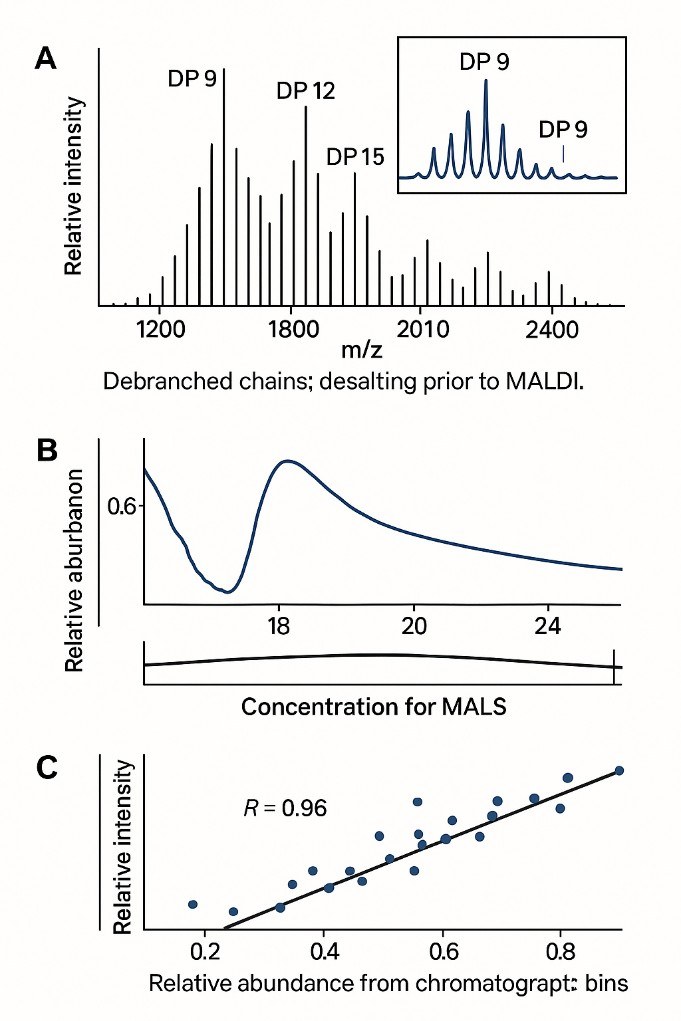
Orthogonal Confirmation Composite (MALDI-TOF + SEC-MALS).
(A) MALDI-TOF mass spectrum of debranched chains labeled by DP; inset zoom on short DP. (B) SEC-MALS chromatogram with concentration and molar-mass traces. (C) Correlation between chromatographic DP bins and MALDI intensities (R = 0.96).
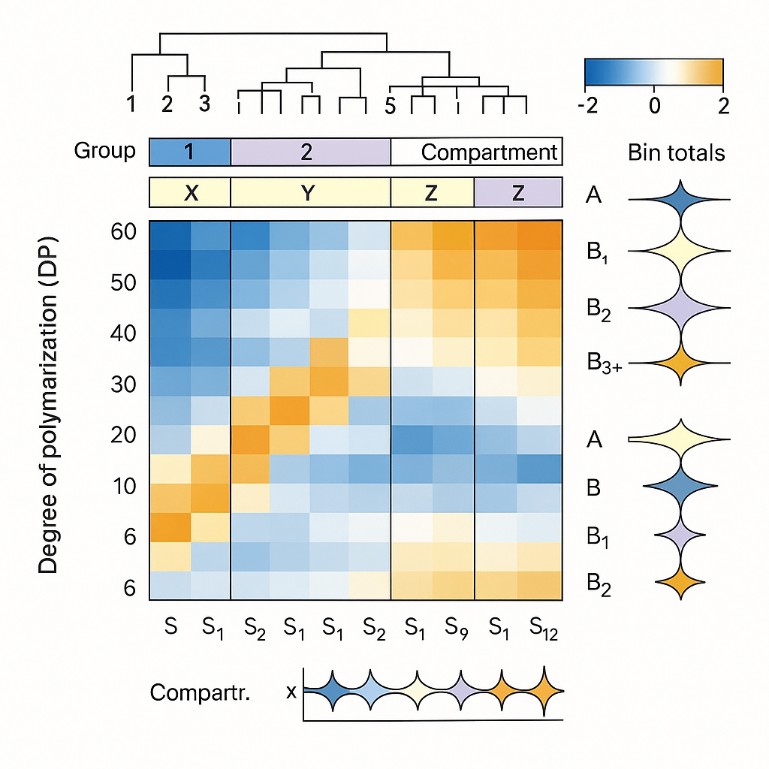
Comparative Matrix Heatmap (DP × Sample) with Dendrograms.
Z-score heatmap of DP 6–60 across samples with hierarchical clustering; annotation bars indicate groups and compartments; side violins summarize A/B1/B2/B3+ totals.
FAQ of BCAA Analysis Service
How is amylopectin CLD different from total starch or amylose content analysis?
CLD specifically characterizes the fine structure of amylopectin by resolving individual glucan chain lengths, while total starch or amylose assays measure bulk quantities without structural detail; CLD is essential for linking molecular architecture to texture, retrogradation, and functional performance.
Can CLD profiling help detect subtle changes caused by enzyme treatments or gene edits?
Yes, high-resolution CLD can sensitively detect changes in chain population distributions—such as an increase in B2/B3 chains or reduction in short A chains—making it useful for evaluating the effects of starch-modifying enzymes or CRISPR-based edits targeting branching enzymes.
Is it necessary to isolate starch before CLD profiling, or can crude samples be used?
While purified starch improves resolution and reproducibility, CLD profiling can be adapted to semi-purified plant materials or processed products, provided matrix composition is known and interfering substances (e.g., high fat, protein, or salt) are minimized.
How many replicates are recommended for statistically confident CLD comparison?
For research or breeding studies where small DP shifts matter, technical duplicates and biological triplicates are advisable. Replicate profiling ensures that observed differences in CLD are robust and not due to variability in extraction, debranching, or detection.
What's the difference between reporting DP as mole fraction vs weight fraction?
Mole fraction reflects the number of chains of each length, emphasizing branching patterns, while weight fraction scales with chain mass and may bias toward longer DP species; mole fraction is generally preferred for interpreting biosynthesis and enzyme activity.
Can this service be used to track process-induced changes over time, like aging or storage?
Yes, longitudinal CLD profiling can reveal how short-chain content increases or shifts in B-chain distribution occur during storage, freeze–thaw cycles, or post-processing—making it useful for shelf-life prediction and quality assurance.
Does CLD analysis distinguish between species-specific amylopectin patterns?
Absolutely. Each botanical source—e.g., maize, rice, potato—exhibits a distinct chain distribution fingerprint that reflects evolutionary adaptation and enzymatic machinery. CLD can support origin verification or hybrid differentiation in industrial contexts.
What happens if the sample has too little starch or too much background noise?
Low-starch or highly complex matrices may limit detection in short DP ranges or create baseline interference. In such cases, we recommend pilot screening, enrichment steps, or method adaptation to confirm feasibility before full profiling.
Learn about other Q&A about proteomics technology.
Publications
Here are some publications in Glycomics research from our clients:

- Conformational differences between functional human immunodeficiency virus envelope glycoprotein trimers and stabilized soluble trimers. 2019. https://doi.org/10.1128/jvi.01709-18
- Modulation of the Endomembrane System by the Anticancer Natural Product Superstolide/ZJ-101. 2023. https://doi.org/10.3390/ijms24119575
- Identification of the O-Glycan Epitope Targeted by the Anti-Human Carcinoma Monoclonal Antibody (mAb) NEO-201. 2022. https://doi.org/10.3390/cancers14204999
- Alternative glycosylation controls endoplasmic reticulum dynamics and tubular extension in mammalian cells. 2021. https://doi.org/10.1126/sciadv.abe8349


