Glycerophospholipids Analysis Service
Creative Proteomics provides high-resolution glycerophospholipid analysis covering 800+ lipid species across major classes.
We support your research in:
- Neurodegeneration, inflammation, and metabolic disorders
- Drug–lipid interaction profiling
- Lipid signaling and pathway elucidation
- Mitochondrial and membrane lipid remodeling
Data-driven, reproducible, publication-ready results.
Submit Your Request Now
×
- What We Provide
- Advantages
- Technology Platform
- Sample Requirements
- Demo
- FAQs
- Case Study
What are Glycerophospholipids?
Glycerophospholipids are a major class of lipids that form the structural foundation of cell membranes. They consist of a glycerol backbone linked to two fatty acid chains and a phosphate-containing head group. These molecules play key roles in membrane fluidity, cell signaling, and membrane trafficking, making them essential for various cellular functions.
Why Analyze Glycerophospholipids?
Quantitative and qualitative assessment of glycerophospholipids is vital for:
- Biomarker discovery in neurodegenerative diseases, cardiovascular disorders, and metabolic syndromes.
- Understanding lipid signaling cascades involved in inflammation and apoptosis.
- Evaluating therapeutic efficacy and drug-lipid interactions in pharmacological studies.
- Profiling lipid remodeling in membrane biology and lipidomics research.
Glycerophospholipids Analysis Service Offered by Creative Proteomics
- Comprehensive lipid profiling: Identification and quantification of hundreds of glycerophospholipid species across multiple classes.
- Targeted analysis of phosphatidylcholine (PC), phosphatidylethanolamine (PE), phosphatidylinositol (PI), phosphatidylserine (PS), phosphatidic acid (PA), phosphatidylglycerol (PG), and more.
- Metabolic pathway analysis: Mapping glycerophospholipid metabolites in KEGG and HMDB-based pathways.
- Lipid class distribution: Analysis of acyl chain composition, saturation levels, and head group variability.
- Custom lipidomics solutions: Tailored panels based on disease, organism, or research focus.
- Quantitative method validation: Standard curve-based absolute quantitation with internal standards.
List of Detected Glycerophospholipids and Associated Metabolites
| Lipid Class | Subclass / Type | Representative Species (Examples) | Related Metabolites | Involved Metabolic Pathways |
|---|---|---|---|---|
| Phosphatidylcholine (PC) | Diacyl-PC (PC aa), Ether-PC (PC ae) | PC(16:0/18:1), PC(18:0/20:4), PC(18:2/22:6), PC(O-16:0/18:1) | Lyso-PC, GPC (glycerophosphocholine), choline | Glycerophospholipid metabolism, Choline metabolism, Membrane remodeling |
| Phosphatidylethanolamine (PE) | Diacyl-PE (PE aa), Plasmalogen-PE (PE p) | PE(18:0/20:4), PE(16:0/22:6), PE(p-18:0/20:4) | Lyso-PE, GPE (glycerophosphoethanolamine), ethanolamine | Kennedy pathway, Ferroptosis, PE biosynthesis |
| Phosphatidylserine (PS) | Diacyl-PS | PS(18:0/20:4), PS(16:0/22:6), PS(18:1/18:1) | Lyso-PS, Serine | PS-mediated apoptosis, Phosphatidylserine decarboxylation |
| Phosphatidylinositol (PI) | Diacyl-PI | PI(18:0/20:4), PI(16:0/18:2), PI(18:1/18:1) | DAG, IP3, inositol phosphates | PI3K-AKT signaling, Inositol phosphate metabolism, Calcium signaling |
| Phosphatidic Acid (PA) | Diacyl-PA | PA(16:0/18:1), PA(18:1/18:2), PA(18:0/20:4) | DAG, Glycerol-3-phosphate | mTOR signaling, TAG biosynthesis, Membrane curvature modulation |
| Phosphatidylglycerol (PG) | Diacyl-PG | PG(16:0/18:1), PG(18:0/18:2) | Cardiolipin precursors, Glycerol | Mitochondrial lipid metabolism, Lung surfactant formation |
| Cardiolipin (CL) | Tetra-acyl CL | CL(18:2)₄, CL(16:0/18:1/18:2/22:6) | Monolysocardiolipin | Mitochondrial inner membrane structure, Electron transport chain |
| Lysophospholipids | Lyso-PC, Lyso-PE, Lyso-PI, Lyso-PS, Lyso-PG | Lyso-PC(18:1), Lyso-PE(18:2), Lyso-PI(20:4), Lyso-PS(18:0) | Free fatty acids, Glycerol, Head group metabolites | Inflammatory signaling, Lysophospholipid metabolism |
| Ether-linked Glycerophospholipids (Plasmalogens) | PC(O-), PE(O-), PE(P-) | PC(O-16:0/18:1), PE(O-18:0/20:4), PE(P-18:0/22:6) | Plasmanyl, Plasmenyl forms | Antioxidant function, Peroxisomal biosynthesis, Neuroprotection |
| Deacylated Metabolites | Glycerophosphates | GPC, GPE, GPS, GPI | Phosphoric acid derivatives | Glycerophosphodiester degradation, Secondary lipid metabolism |
Advantages of Glycerophospholipids Assay
- High Sensitivity: Detection limits as low as 0.05–0.1 ng/mL, suitable for trace-level lipid analysis.
- Broad Coverage: Profiles over 800 glycerophospholipid species, including PCs, PEs, PIs, PSs, PAs, PGs, CLs, and subclasses like ether-linked and lysophospholipids.
- Accurate Quantification: Internal standard-based quantitation with calibration curves R² > 0.995 and dynamic range up to 10⁴–10⁵ fold.
- Excellent Reproducibility: Inter- and intra-assay CVs consistently < 8%, ensuring reliable data across batches.
- Dual Ion Mode Analysis: Simultaneous positive and negative ESI detection for full class and subclass coverage.
- High-Resolution Separation: Retention time precision within ±0.05 min, enabling separation of isomers and co-eluting species.
- Reliable Annotation: Lipid identification accuracy >95% using LipidSearch™, MS-DIAL, and proprietary databases.
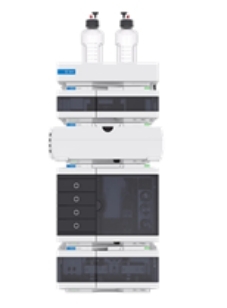
Technology Platform for Glycerophospholipids Analysis Service
Mass Spectrometry
SCIEX QTRAP® 6500+ LC-MS/MS: Optimized for targeted lipid quantification with MRM-based workflows.
Thermo Scientific™ Q Exactive™ HF Orbitrap: Mass accuracy<1 ppm, dynamic range up to 10⁶.
Chromatographic Separation
Agilent 1290 Infinity II UHPLC: Supports reverse-phase and HILIC separation with sub-2 µm columns.
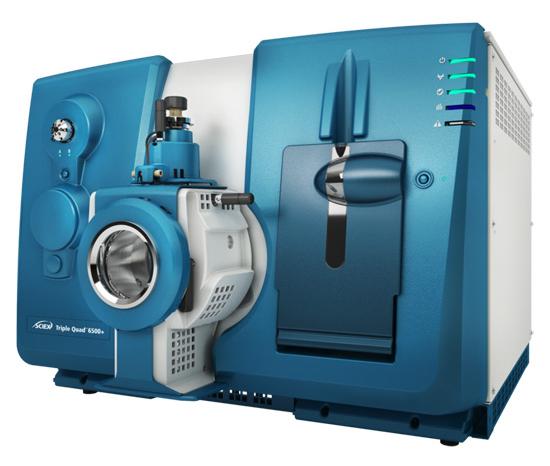
SCIEX Triple Quad™ 6500+ (Figure from Sciex)
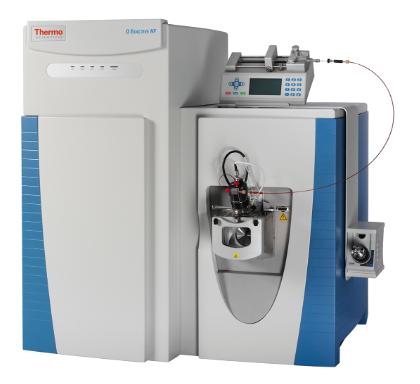
Q Exactive™ HF Orbitrap (Figure from Thermo)
Agilent 1260 Infinity II HPLC (Fig from Agilent)
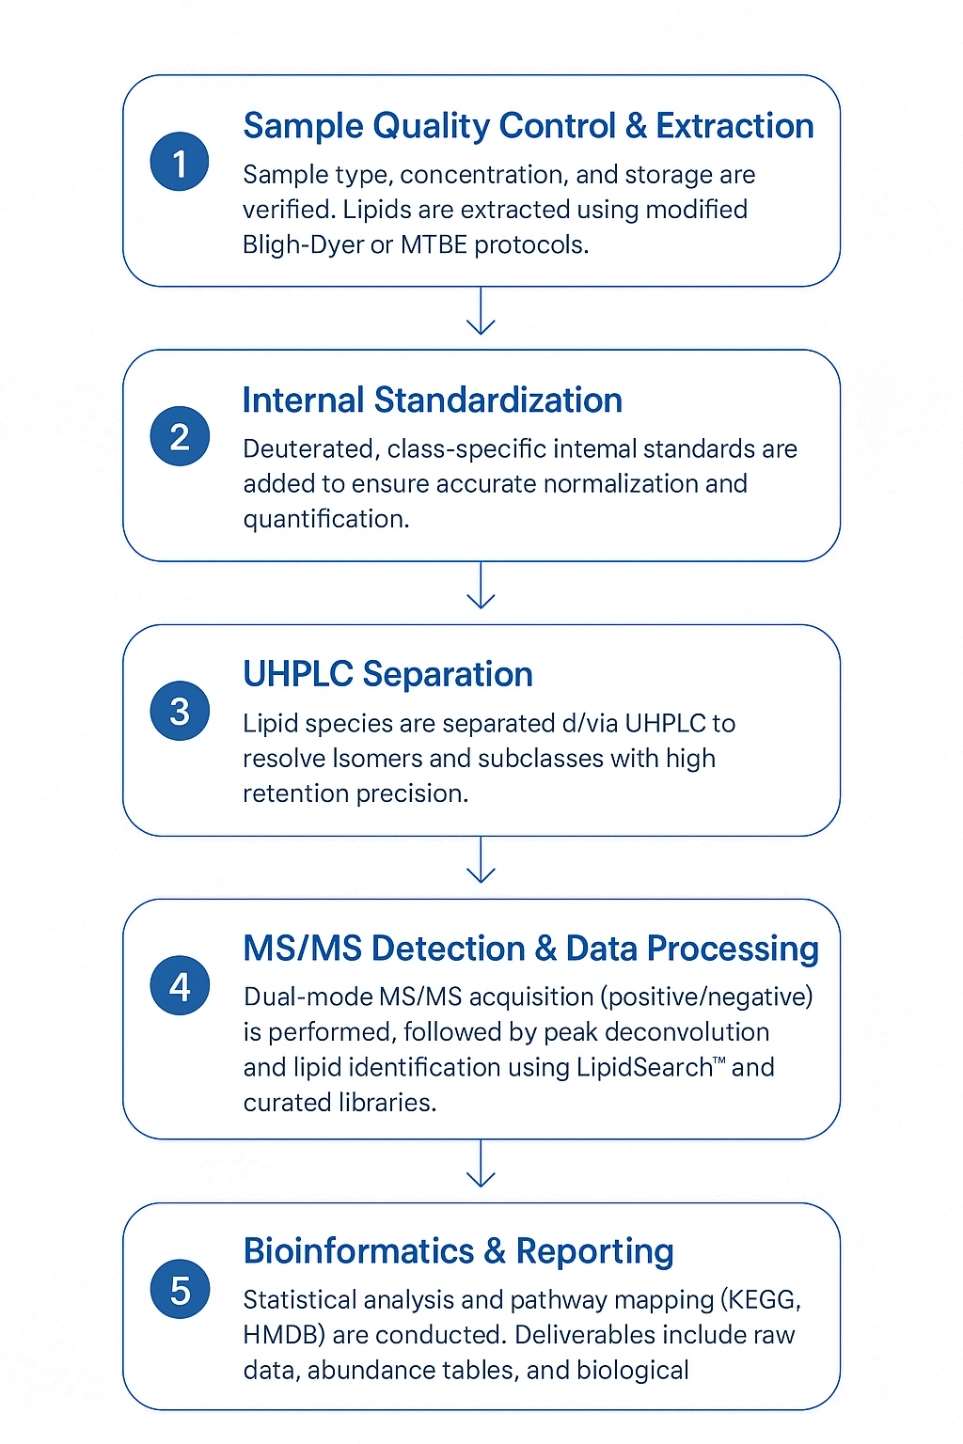
Workflow for Glycerophospholipids Analysis Service
Sample Requirements for Glycerophospholipids Analysis Service
Sample Requirements for Glycerophospholipid Analysis
| Parameter | Specifications | Critical Notes |
|---|---|---|
| Sample Type | Plasma, serum, tissue (brain/liver), cells, culture supernatant, lipid extracts | Avoid hemolysis (RBCs contain high phospholipids, affecting quantification) |
| Sample Volume | - Plasma/Serum: ≥200 μL - Tissue: ≥50 mg - Cells: ≥10⁶ cells | Low volume may cause detection limit issues |
| Anticoagulant | Plasma: EDTA-K₂ tubes (purple-top) | Avoid heparin (interferes with MS analysis) |
| Processing Time | - Plasma/Serum: Centrifuge within 2h - Tissue/Cells: Snap-freeze in LN₂ within 30min | Delayed processing activates phospholipases |
| Storage | - Short-term (≤72h): -80°C - Long-term: -80°C (≤2 freeze-thaw cycles) | Add antioxidant: 0.005% BHT |
| Shipping | Dry ice (-70°C or below) | Refrigeration/ambient transport prohibited |
| Lipid Extraction | Recommended: Folch (CHCl₃:MeOH=2:1) or MTBE method | Dry under N₂, store at -80°C (light-sensitive!) |
| Critical Restrictions | 1. NO heating 2. AVOID protic solvents (e.g., ethanol) for solubilization 3. ≤2 freeze-thaw cycles | Prevents hydrolysis & acyl migration |
| QC Samples | Must include: - Blank matrix (same type) - Spiked samples (low/med/high) | Evaluates extraction efficiency & matrix effects |
Key Considerations
Antioxidant Protection:
- Add BHT (butylated hydroxytoluene) immediately after collection (final conc. 0.005%).
- Homogenize tissues under N₂ atmosphere.
Phospholipid Stability:
- Use polypropylene tubes (acidic/alkaline surfaces cause hydrolysis).
- Max storage: 6 months at -80°C (validate stability for longer periods).
Special Samples:
- Brain tissue: Isolate regions (e.g., gray/white matter) separately.
- Cells: Wash 3× with PBS to remove medium components.
Demo Results

MS/MS fragmentation of negative ions for four glycerophospholipid classes (PE, PC, PS, PI) from hydrocorals Allopora steinegeri, Millepora dichotoma, and M. platyphylla (Imbs et al., 2019)

Negative mode MS spectra of the four main glycerophospholipid classes (PE, PC, PS, PI) released from ESyt-2 expressed in mammalian cells, showing dominant acyl chain compositions (Schauder, Curtis M., et al, 2014).
FAQ of Glycerophospholipids Analysis Service
Can you analyze glycerophospholipids in rare or limited sample types (e.g., cerebrospinal fluid, exosomes, or FFPE tissues)?
Yes, we support low-volume or rare sample types upon request. For specialized matrices such as cerebrospinal fluid (CSF), exosomes, or FFPE tissues, please contact us in advance for a custom protocol and sensitivity assessment.
How should I normalize data across different sample types (e.g., tissue vs. plasma)?
We recommend normalizing lipid concentrations to total protein content (e.g., via BCA assay for tissue/cells) or to volume (e.g., μL of plasma/serum). Our data reports include raw and normalized values, and we can advise on best practices depending on your biological question.
Are your methods suitable for clinical biomarker discovery or preclinical drug development studies?
Yes. Our assay platform is built on high-sensitivity, validated quantitative methods that are suitable for both discovery-phase and translational research. However, please note that our assays are for research use only (RUO) and not for clinical diagnostics.
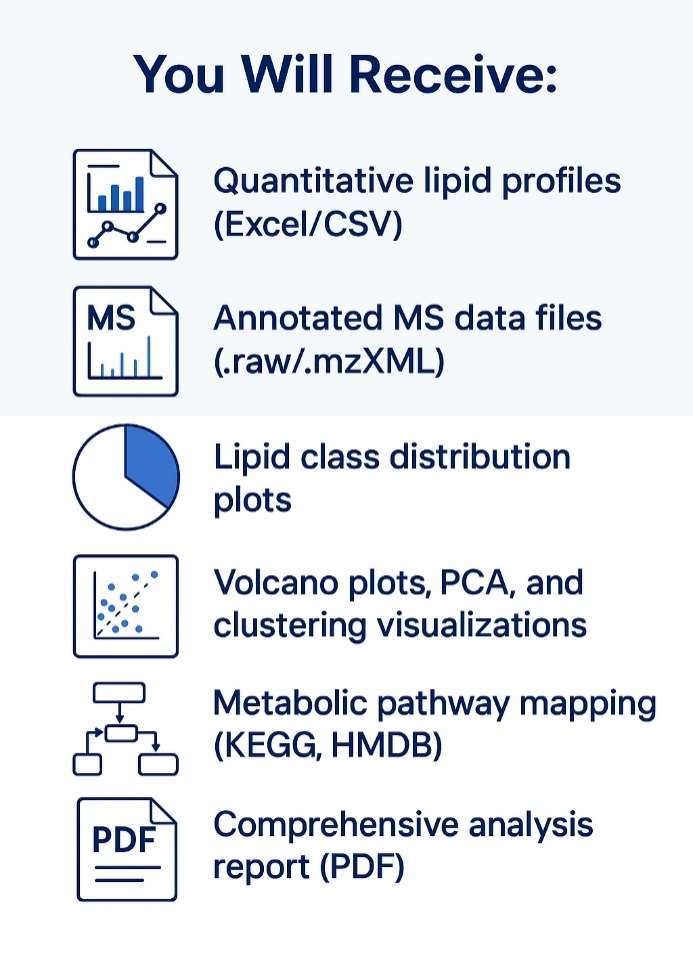
What format is the final data delivered in?
We provide comprehensive reports including:
- Identified lipid species (with structural annotations)
- Quantitative data (absolute or relative levels)
- QC performance metrics (e.g., CV%, recovery)
- Statistical summary (optional, e.g., volcano plots, PCA)
- Raw instrument files (e.g., .wiff, .raw) and processed Excel/CSV tables are also included.
How do you handle isobaric/isomeric lipid species?
We apply high-resolution mass spectrometry combined with chromatographic separation to resolve isobaric and positional isomers. For complex lipids (e.g., PC (16:0/18:1) vs. PC (18:1/16:0)), we utilize retention time and MS/MS fragmentation patterns for accurate assignment.
Can you assist with data interpretation and biological insights?
Yes. Upon request, we offer expert consultation for pathway enrichment, lipid class imbalance analysis, and disease-specific lipid signatures. We can also integrate your lipidomics results with proteomics or metabolomics data for systems-level insights.
Do you offer batch analysis or high-throughput capabilities?
Absolutely. Our platform supports large-cohort studies and batch analysis of hundreds of samples. Consistency across batches is ensured via stringent QC, internal standards, and normalization strategies.
Can you customize the lipid panel for specific research interests (e.g., ferroptosis, neurodegeneration)?
Yes. We offer custom panels focusing on lipids implicated in specific biological processes or diseases. Simply provide your targets or research focus, and we will design an appropriate panel and method.
Is data reanalysis possible if I discover new lipid targets later?
In most cases, yes. As long as raw data is available and your new targets fall within the original acquisition range and ion mode, we can reprocess the data to include them.
How do you ensure cross-species comparability (e.g., human vs. mouse vs. rat)?
Our database includes lipid species commonly found across mammalian systems, and we validate extraction and detection protocols for human, mouse, and rat matrices. Cross-species data are normalized and annotated consistently to support comparative studies.
Learn about other Q&A.
Glycerophospholipids Analysis Service Case Study
Title: Glycerophospholipids is essential for Heartland and Dabie bandavirus glycoprotein-induced membrane fusion
Journal: PLOS Pathogens
Published: 2023
- Study Summary
- Background
- Methods
- Results
- Reference
This study demonstrates that loss of G0S2 in CML disrupts glycerophospholipid metabolism, impairs myeloid differentiation, and promotes resistance to TKIs. Through analysis of patient samples, cell lines, and knockout mouse models, the authors reveal G0S2 as a MYC-repressed tumor suppressor. Restoring G0S2 expression may enhance TKI sensitivity and represent a novel therapeutic strategy in CML.
Chronic myeloid leukaemia (CML) is treatable with tyrosine kinase inhibitors (TKIs), but resistance—particularly from BCR::ABL1-independent mechanisms—remains a key barrier to cure. G0S2, a lipid metabolism regulator, is frequently downregulated in drug-resistant CML, contributing to disease progression and impaired therapy response.
The research team aimed to understand how G0S2 expression influences lipid metabolism in leukemic stem/progenitor cells and to uncover novel lipid biomarkers potentially linked to disease progression or therapeutic resistance. Traditional metabolic assays were insufficient to capture the full complexity and specificity of lipidomic changes driven by genetic manipulations.
Creative Proteomics provides clients with:
Creative Proteomics performed high-resolution liquid chromatography–mass spectrometry (LC-MS) lipidomics on cells with ectopic expression or knockdown of G0S2. The workflow included:
- Lipid extraction and quantification from cell lysates;
- LC-MS analysis using advanced ultra-performance liquid chromatography (UPLC) systems and mass spectrometers;
- Data alignment and lipid identification using LipidSearch™ software;
- Multivariate statistical analysis (PCA, PLS-DA, OPLS-DA) through SIMCA-P software to identify significantly altered lipids;
- Integration with KEGG pathway analysis and construction of lipid correlation networks;
- Functional annotation and lipid pathway enrichment analysis to uncover dysregulated lipid classes.
Outcome
This comprehensive approach enabled the identification of lipidomic signatures associated with G0S2 modulation, offering new insights into the metabolic vulnerabilities of CML cells. The results highlighted G0S2 as a key regulator of lipid metabolism and provided a foundation for potential biomarker and therapeutic target discovery in leukemia.
1. G0S2 Downregulation in CML Progression and TKI Resistance:
G0S2 expression is significantly reduced during chronic myeloid leukemia (CML) progression and in imatinib-resistant cases independent of BCR::ABL1 kinase activity. Lower G0S2 levels correlate with worse patient survival.
2. MYC/MAX-Mediated Transcriptional Repression of G0S2:
MYC/MAX complex binds the G0S2 promoter and represses its transcription in CML, particularly in TKI-resistant cells, contributing to G0S2 downregulation.
3. Tumor Suppressive Role of G0S2:
Ectopic expression of G0S2 impairs survival and colony formation of CML cells, especially in TKI-resistant lines and advanced CML patient samples, without inducing apoptosis. Conversely, G0S2 knockdown enhances clonogenic growth.
4. In Vivo Impact of G0S2 Loss:
Loss of G0S2 accelerates leukemia progression in mouse models, increasing colony formation and reducing overall survival, confirming its tumor suppressor function in CML.
5. G0S2 and Myeloid Differentiation:
G0S2 expression is linked to myeloid differentiation and is specifically downregulated in granulocyte-macrophage progenitors (GMPs) in CML, contributing to differentiation blockade seen in disease progression.
6. G0S2 Functions Independent of ATGL:
While G0S2 inhibits adipose triglyceride lipase (ATGL), its growth-suppressive effects in CML cells are largely independent of ATGL inhibition. ATGL knockdown does not mimic G0S2 effects on colony formation but modulates apoptosis in combination with G0S2.
7. Disruption of Lipid Metabolism by G0S2 Loss:
Loss of G0S2 disrupts glycerophospholipid metabolism, altering membrane lipid composition and related pathways, which likely contributes to impaired differentiation and TKI resistance in CML.
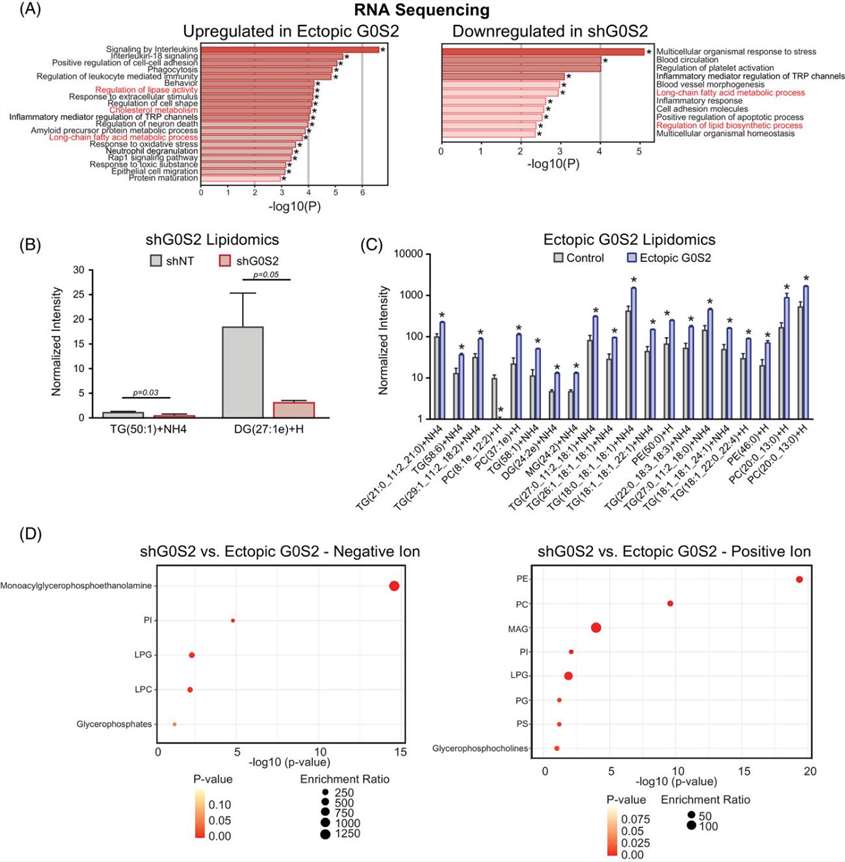 Loss of G0S2 alters lipid metabolism in CML cells. (A) GO pathways upregulated by G0S2 overexpression or downregulated by G0S2 knockdown in K562S cells (RNA-seq; p < .05). Shared pathways highlighted in red. (B) G0S2 knockdown reduces very long-chain di- and triacylglycerides. (C) G0S2 overexpression increases triglycerides and membrane phospholipids (PC, PE). (D) KEGG-based lipid pathway enrichment comparing G0S2 overexpression versus knockdown.
Reference
- Gonzalez, Mayra A., et al. "Loss of G0/G1 switch gene 2 (G0S2) promotes disease progression and drug resistance in chronic myeloid leukaemia (CML) by disrupting glycerophospholipid metabolism." Clinical and translational medicine 12.12 (2022): e1146. https://doi.org/10.1002/ctm2.1146
Publications
Here are some of the lipidomics-related papers published by our clients:

- White matter lipid alterations during aging in the rhesus monkey brain. 2024. https://doi.org/10.1007/s11357-024-01353-3
- Characterization of Dnajc12 knockout mice, a model of hypodopaminergia. 2024. https://doi.org/10.1101/2024.07.06.602343
- Annexin A2 modulates phospholipid membrane composition upstream of Arp2 to control angiogenic sprout initiation. 2023. https://doi.org/10.1096/fj.202201088R
- Lipid Membrane Engineering for Biotechnology (Doctoral dissertation, Aston University). 2023. https://doi.org/10.48780/publications.aston.ac.uk.00046663
- Summative and ultimate analysis of live leaves from southern US forest plants for use in fire modeling. 2020. https://doi.org/10.1152/ajpgi.00184.2023