Mammals Lipidomics Analysis Service
Creative Proteomics delivers accurate mammalian lipidomics solutions to uncover lipid functions in disease and metabolism, enabling biomarker discovery and drug development. Our advanced MS and bioinformatics platforms provide fast, reliable results from various sample types.
Our Strengths:
- Extensive profiling of thousands of lipid species
- High sensitivity and precise quantification
- Support for tissues, plasma, CSF, and cells
- Dual UHPLC separation for optimal analysis
- Comprehensive data interpretation with pathway mapping
Submit Your Request Now
×
What You Will Receive
- Detailed lipid species identification across 30+ subclasses
- Quantitative reports with isotope-labeled standards ensuring CV<15%
- Comprehensive pathway analysis linked to KEGG, LIPID MAPS, HMDB
- Interactive data visualizations: PCA, PLS-DA, heatmaps, volcano plots
- Customized reports tailored to your research needs
- What We Provide
- Advantages
- Technology Platform
- Sample Requirements
- Demo
- FAQs
- Case Study
Why Analyze Mammalian Lipidomes?
Lipidomics—the large-scale study of pathways and networks of cellular lipids—is a crucial branch of metabolomics, especially in mammals where lipids regulate energy metabolism, inflammation, cell signaling, and membrane integrity. Aberrant lipid metabolism is implicated in numerous mammalian diseases including diabetes, atherosclerosis, fatty liver disease, neurodegeneration, and cancer.
By analyzing the full spectrum of lipid species and their biochemical pathways, lipidomics offers vital insights into:
- Pathophysiological mechanisms and biomarker discovery
- Lipid-based drug target validation
- Nutritional and pharmacokinetic research
- Systems biology modeling and phenotype linkage
What We Offer: Mammals Lipidomics Analysis Service at Creative Proteomics
- Untargeted Lipidomics Profiling: High-throughput global identification of lipid classes and sub-classes using LC-HRMS and data-dependent acquisition (DDA).
- Targeted Lipidomics Quantification: Absolute quantification of selected lipids with isotopically labeled internal standards via MRM/PRM on triple quadrupole or orbitrap systems.
- Sub-class Specific Lipid Analysis: Tailored panels for phospholipids, sphingolipids, glycerolipids, cholesterol esters, and free fatty acids.
- Tissue-Specific Lipid Profiling: Optimized workflows for brain, liver, adipose, kidney, heart, and muscle tissue.
- Plasma/Serum/CSF Lipidome Quantification: High sensitivity analysis for circulating lipid biomarkers.
- Lipid Pathway Mapping & Bioinformatics Integration: Annotated lipid species mapped to KEGG, LIPID MAPS, and HMDB pathways, with pathway enrichment and heatmap visualizations.
List of Detected Mammals Lipidomics and Related Metabolites
Service Contents
- Glycerophospholipids
- Glycerolipids
- Sphingolipids
- Fatty Acids & Acylcarnitines
- Sterol Lipids
- Lysophospholipids
- Eicosanoids & Bioactive Lipids
| Subclass | Representative Detected Lipids | Associated Pathways |
|---|---|---|
| Phosphatidylcholine (PC) | PC(16:0/18:1), PC(18:0/20:4), PC(18:1/18:1), PC-O (ether), PC-P (plasmalogen) | Membrane structure, lipid signaling |
| Phosphatidylethanolamine (PE) | PE(16:0/22:6), PE(18:0/20:4), PE(18:1/18:1), PE-O, PE-P | Mitochondrial integrity, autophagy |
| Phosphatidylinositol (PI) | PI(18:0/20:4), PI(16:0/18:2), PI(18:1/18:1) | PI3K-AKT signaling, insulin response |
| Phosphatidylserine (PS) | PS(18:0/20:4), PS(16:0/18:1), PS(18:1/18:1) | Apoptosis, coagulation |
| Phosphatidylglycerol (PG) | PG(16:0/18:1), PG(18:0/18:2) | Pulmonary surfactant, mitochondrial function |
| Cardiolipin (CL) | CL(18:2/18:2/18:2/18:2), CL(16:0/18:1/18:2/20:4) | Mitochondrial bioenergetics, apoptosis |
| Subclass | Representative Detected Lipids | Associated Pathways |
|---|---|---|
| Triglycerides (TG) | TG(16:0/18:1/18:2), TG(18:1/18:1/18:2), TG(18:2/18:2/18:2) | Energy storage, lipogenesis |
| Diglycerides (DG) | DG(16:0/18:1), DG(18:1/18:2) | Lipolysis, signal transduction |
| Monoglycerides (MG) | MG(18:1), MG(16:0), MG(20:4) | Intestinal absorption, inflammation |
| Subclass | Representative Detected Lipids | Associated Pathways |
|---|---|---|
| Ceramides (Cer) | Cer(d18:1/16:0), Cer(d18:1/18:0), Cer(d18:1/24:1) | Cell death, insulin resistance |
| Sphingomyelins (SM) | SM(d18:1/16:0), SM(d18:1/18:1), SM(d18:1/24:0) | Membrane architecture, myelin function |
| Hexosylceramides (HexCer) | HexCer(d18:1/16:0), HexCer(d18:1/24:0) | Glycosphingolipid metabolism, inflammation |
| Lactosylceramides (LacCer) | LacCer(d18:1/16:0), LacCer(d18:1/24:1) | Immune modulation, oxidative stress |
Fatty Acids & Acylcarnitines
| Subclass | Representative Detected Lipids | Associated Pathways |
|---|---|---|
| Free Fatty Acids (FFA) | FFA(16:0), FFA(18:1), FFA(20:4), FFA(22:6) | β-oxidation, inflammatory response |
| Acylcarnitines | C2, C8, C10:1, C16, C18:1-carnitine | Mitochondrial β-oxidation, fatty acid transport |
| Subclass | Representative Detected Lipids | Associated Pathways |
|---|---|---|
| Cholesteryl Esters (CE) | CE(18:2), CE(20:4), CE(22:6) | Lipoprotein metabolism, reverse cholesterol flow |
| Free Cholesterol (FC) | Cholesterol | Membrane fluidity, steroid hormone synthesis |
| Oxysterols | 25-HC, 27-HC, 24S-HC | Bile acid biosynthesis, immune regulation |
Lysophospholipids
| Subclass | Representative Detected Lipids | Associated Pathways |
|---|---|---|
| Lysophosphatidylcholine (LPC) | LPC(16:0), LPC(18:1), LPC(20:4) | Inflammatory signaling, vascular response |
| Lysophosphatidylethanolamine (LPE) | LPE(18:1), LPE(20:4) | Membrane remodeling, lipid turnover |
| Lysophosphatidylserine (LPS) | LPS(18:0), LPS(18:1) | Immune modulation, apoptosis |
| Lysophosphatidylinositol (LPI) | LPI(18:1), LPI(20:4) | Signal transduction |
Eicosanoids & Bioactive Lipids
| Subclass | Representative Detected Lipids | Associated Pathways |
|---|---|---|
| Prostaglandins | PGE2, PGD2, PGF2α | Inflammation, pain, fever |
| Leukotrienes | LTB4, LTC4, LTD4 | Immune response, allergy |
| Hydroxyeicosatetraenoic acids (HETEs) | 5-HETE, 12-HETE, 15-HETE | Oxidative stress, signaling |
| Epoxyeicosatrienoic acids (EETs) | 14,15-EET, 11,12-EET | Vascular tone, cardioprotection |
Advantages of Mammals Lipidomics Assay
- Comprehensive Coverage: Quantification of over 3,000 lipid species across 30+ subclasses, including TG, PC, PE, SM, and CL.
- High Sensitivity: Detection limits down to 50 fmol, enabling analysis of low-abundance signaling lipids.
- Quantitative Accuracy: Integration of >25 isotope-labeled internal standards ensures CV < 15% across replicates.
- Flexible Sample Input: Supports as little as 50 µL plasma/serum, 5 mg tissue, or 1×10⁶ cells.
- Dual Separation Modes: UHPLC with C18 and HILIC columns enables optimal resolution of neutral and polar lipids.
- Multi-Platform Mass Spectrometry: Orbitrap / Q-TOF for untargeted profiling (Full MS/dd-MS²); Triple Quad (MRM/PRM) for targeted quantification with high specificity.
- Integrated Bioinformatics: Includes PCA, PLS-DA, volcano plots, and lipid pathway enrichment linked to KEGG, HMDB, and LIPID MAPS databases.
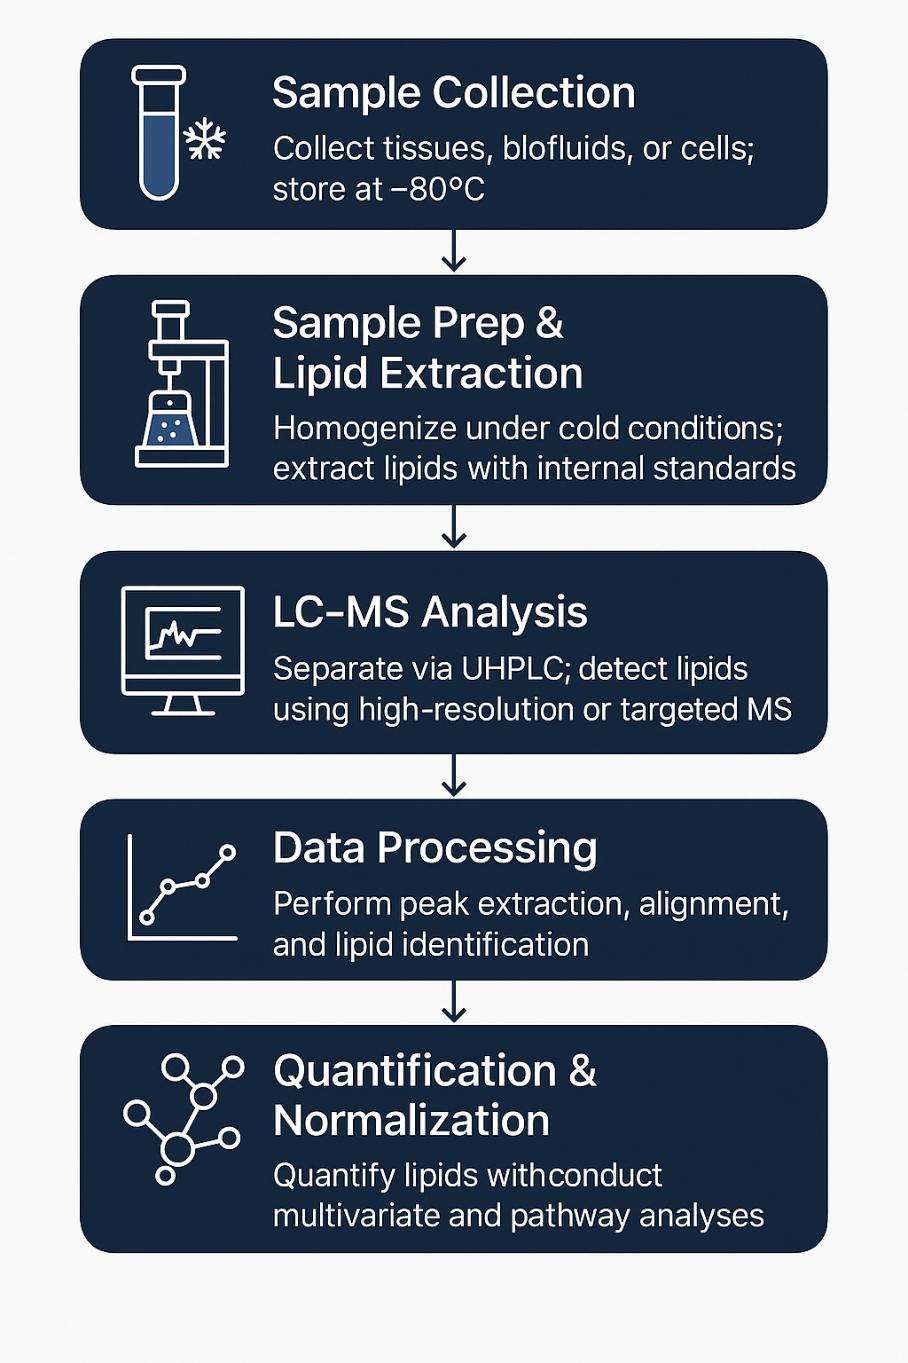
Workflow for Mammals Lipidomics Analysis Service
Sample Collection & Storage
Tissues, plasma, serum, CSF, or cell pellets are collected under standardized protocols and stored at −80°C to preserve lipid integrity.
Sample Pre-treatment & Homogenization
Biological samples are homogenized using mechanical or ultrasonic disruption under cold conditions to prevent lipid oxidation and degradation.
Lipid Extraction
Lipids are extracted using MTBE, Folch, or Bligh-Dyer methods depending on sample type, with addition of isotope-labeled internal standards for quantification accuracy.
Chromatographic Separation
Lipid subclasses are resolved using UHPLC equipped with reverse-phase C18 or HILIC columns, tailored for neutral and polar lipids.
Mass Spectrometry Detection
- Untargeted profiling: High-resolution Orbitrap or QTOF MS in positive/negative ion modes
- Targeted quantification: MRM/PRM via triple quadrupole systems (e.g., SCIEX 6500+)
Data Processing & Lipid Identification
Software such as LipidSearch, MS-DIAL, or Progenesis QI is used for feature extraction, peak alignment, MS/MS matching, and isomer resolution.
Quantification & Normalization
Lipid concentrations are quantified using internal calibration curves and normalized to protein content, tissue weight, or volume as required.
Pathway Annotation & Statistical Analysis
Identified lipids are mapped to KEGG, HMDB, and LIPID MAPS databases. Downstream analysis includes PCA, PLS-DA, volcano plots, and lipid pathway enrichment.
Methods and Instrumentation for Mammals Lipidomics Analysis
Lipid Extraction
- MTBE (Methyl tert-butyl ether) – for broad lipid recovery
- Folch (Chloroform:Methanol, 2:1) – for tissues and cells
- Bligh-Dyer – for aqueous-rich samples
All methods include isotope-labeled internal standards.
UHPLC Separation
- C18 Reverse-Phase Columns – separate neutral lipids (TG, CE, PC, PE)
- HILIC Columns – resolve polar lipids (SM, PI, CL, LPC)
Mass Spectrometry Platforms
| Platform | Application | Mode |
|---|---|---|
| Thermo Q Exactive™ Orbitrap | Untargeted profiling | Full MS/dd-MS² (DDA) |
| Agilent 6545 Q-TOF | Untargeted profiling | High-res MS |
| SCIEX Triple Quad™ 6500+ | Targeted quantification | MRM (±ESI) |
| Thermo TSQ Altis™ Triple Quad | Targeted quantification | PRM/MRM |
- Scan Range: m/z 100–2000
- Sensitivity: Sub-femtomole level
- Dynamic Range: >10⁶ (quantitative)
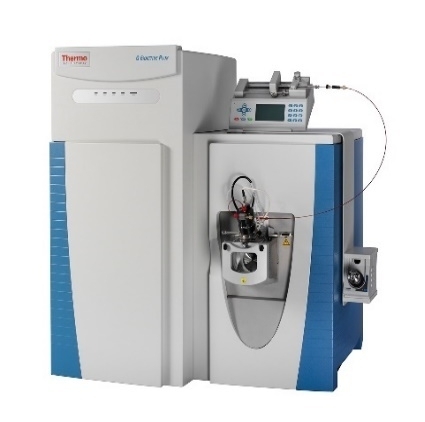
Thermo Fisher Q Exactive (Figure from Thermo Fisher)
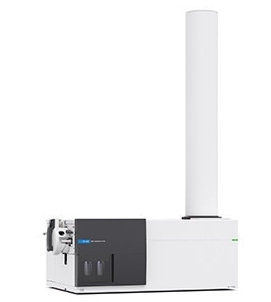
Agilent 6545 Q-TOF (Figure from Agilent)
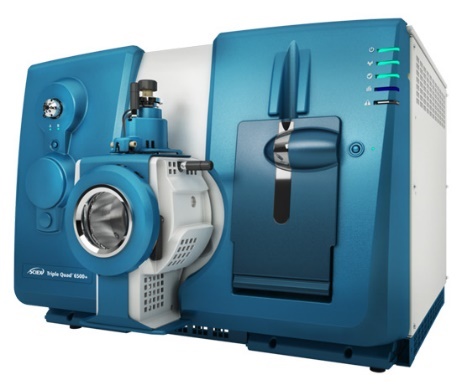
SCIEX Triple Quad™ 6500+ (Figure from Sciex)
Sample Requirements for Mammals Lipidomics Analysis Service
| Sample Type | Recommended Amount | Storage Condition | Shipping Guidelines |
|---|---|---|---|
| Tissue (e.g. liver, brain, muscle) | ≥ 50 mg (wet weight) | −80°C | Dry ice; avoid freeze-thaw |
| Plasma / Serum | ≥ 100 µL | −80°C | Dry ice; use cryovials; no hemolysis |
| Cerebrospinal Fluid (CSF) | ≥ 100 µL | −80°C | Dry ice; low-protein binding tubes |
| Cell Pellet | ≥ 1 × 10⁶ cells | −80°C | Snap freeze in liquid nitrogen; dry ice shipping |
| Cultured Cells (in plates) | ≥ 1 well of 6-well or 10⁶ cells per condition | −80°C after washing with PBS | Remove medium, wash with PBS, freeze plate; dry ice ship |
| Exosomes / EVs | ≥ 20 µg protein or ≥ 100 µL eluate | −80°C | Aliquot and freeze immediately; ship on dry ice |
| Biofluids (e.g. urine, BALF) | ≥ 500 µL | −80°C | Avoid preservatives; ship frozen |
- Avoid EDTA in plasma (may interfere with MS ionization)
- Minimize lipemia or hemolysis in blood samples
- Contact us for custom matrices or low-yield samples
Demo Results

Representative chromatograms and MS/MS spectra from mammalian lipidomics analysis. Top: Untargeted (Orbitrap) and targeted (MRM) chromatograms illustrating peak resolution and specificity. Bottom: Corresponding MS/MS spectra highlighting fragmentation patterns used for lipid identification and quantification.

Representative chromatograms and MS/MS spectra from mammalian lipidomics analysis. Top: Untargeted (Orbitrap) and targeted (MRM) chromatograms showing peak resolution and specificity. Bottom: Corresponding MS/MS spectra showing fragment ion distributions used for lipid identification and quantification.
FAQ of Mammals Lipidomics Analysis Service
What should I do if my tissue samples show signs of degradation or have been thawed multiple times?
Lipids are sensitive to oxidation and degradation. We recommend avoiding freeze-thaw cycles and using fresh, well-preserved samples stored at −80°C to ensure reliable results.
How important is the choice of anticoagulant for blood samples?
Very important. EDTA can interfere with mass spectrometry ionization, so we recommend collecting plasma or serum without EDTA or using alternatives like heparin.
Can lipemia or hemolysis in blood samples affect lipidomics results?
Yes. Lipemia and hemolysis can cause artifacts and reduce data quality. We advise careful sample handling to minimize these issues.
Are there any sample contaminants I should avoid that could interfere with lipid detection?
Yes. Avoid detergents, preservatives, or plasticizers as they can cause ion suppression or contamination during MS analysis.
What is the best way to transport samples to prevent lipid degradation?
Ship samples on dry ice with temperature monitoring if possible. Avoid delays and exposure to room temperature during transit.
How do storage duration and conditions impact lipid stability?
Long-term storage at −80°C is ideal. Extended storage at higher temperatures or repeated freeze-thaw cycles can alter lipid profiles.
What volume or mass of sample is recommended to get reliable lipidomic data?
Minimum input varies by sample type but generally ≥50 mg tissue or ≥100 µL plasma/serum is recommended for comprehensive profiling.
Can frozen cell pellets or cultured cells be used directly for lipid extraction?
Yes, but they should be snap frozen immediately after harvesting and kept frozen during shipping to maintain lipid integrity.
Is there a difference in lipid profiles between plasma and serum samples?
Yes, slight differences exist due to clotting factors in serum. Please specify your sample type to tailor the analysis accordingly.
Learn about other Q&A.
Mammals Lipidomics Analysis Service Case Study
Title: Multi-omics identify xanthine as a pro-survival metabolite for nematodes with mitochondrial dysfunction
Journal: EMBO Journal
Published: 2019
- Background
- Methods
- Results
- Reference
Mitochondrial dysfunction contributes to many metabolic and chronic diseases, with impaired oxidative phosphorylation underlying various mitochondrial disorders. Insulin/IGF-1 signaling (IIS) inhibition has shown promise in treating mitochondrial diseases by altering energy metabolism, but the detailed mechanisms remain unclear. This study uses a multi-omics approach to reveal that IIS inhibition extends lifespan in mitochondrial-deficient C. elegans by reducing protein synthesis and shifting metabolism toward energy-saving catabolic processes. A key finding is the accumulation of xanthine, a metabolite linked to enhanced survival. Supplementing xanthine derivatives improves fitness in nematodes with mitochondrial lesions, highlighting a metabolic network that may offer new therapeutic targets for mitochondrial diseases.
This study used various techniques including antibody-based Western blotting, ATP and carbohydrate quantification, C. elegans strain maintenance, lifespan and locomotor assays, fluorescence microscopy (FRAP, STED), next-generation RNA sequencing, oxygen consumption measurements, phosphoproteomics, qRT-PCR, targeted metabolic profiling (NMR), TMT/iTRAQ proteomics, and enzyme activity assays. Samples were prepared using synchronized nematodes or cultured HAP1 cells. Data analyses involved statistical tests and STRING. Lipidomic profiling was performed by Creative Proteomics using UPLC-MS with biological replicates and FDR-controlled significance.
Creative Proteomics provides clients with:
- Utilized advanced UPLC-MS technology for comprehensive lipid profiling of nematode samples.
- Accurately identified and quantified diverse lipid species in both wild-type and mutant strains.
- Delivered detailed insights into lipid metabolism changes associated with genetic variations.
- Provided normalized, high-quality lipidomic datasets enabling precise comparative and statistical analysis.
- Facilitated deeper understanding of metabolic pathways through expert lipidomic data generation and processing.
Reduced IIS Extends Lifespan of Mitochondrial Mutants
- Inhibiting IIS (via age-1 or pdk-1 mutations) significantly prolongs lifespan in complex I-deficient (gas-1) and other mitochondrial mutant nematodes.
- Lifespan extension largely depends on the transcription factor DAF-16/FOXO.
- IIS inhibition increases ATP levels and maintains a more fused mitochondrial network, linked to longevity.
IIS Inhibition Suppresses Protein Synthesis and Enhances Catabolism
- IIS inhibition downregulates protein synthesis pathways (mTOR, EIF2) and upregulates catabolic pathways like fatty acid oxidation and gluconeogenesis.
- Activation of AMPK (AAK-2) and PKA (KIN-1) is essential for lifespan extension and mitochondrial network integrity.
- Loss of AAK-2 or KIN-1 reduces the longevity benefit and ATP maintenance.
Xanthine Accumulation and Methylxanthine Treatment Promote Survival
- IIS inhibition leads to xanthine buildup via reduced xanthine dehydrogenase activity.
- Methylxanthine drugs reduce IIS signaling, activate PKA and AMPK, improve mitochondrial connectivity, and extend lifespan in mitochondrial mutants.
- These effects partially mimic IIS inhibition, suggesting xanthine derivatives as potential therapeutics for mitochondrial dysfunction.
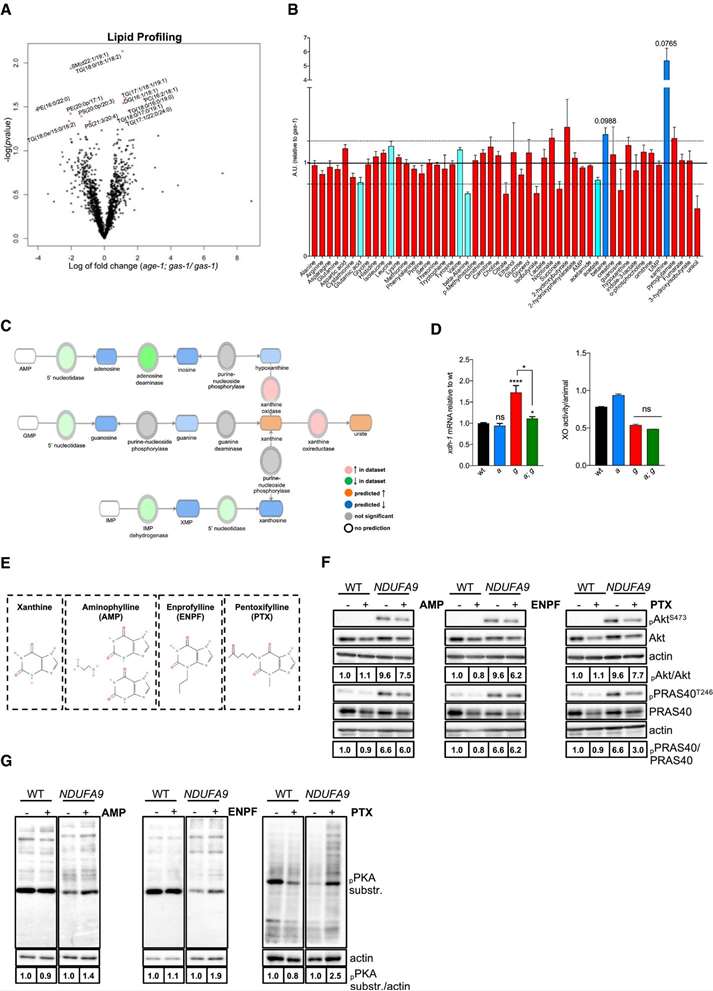 Xanthine accumulates in age‐1; gas‐1 mutants
A. Lipidomic profiling identifies significantly altered lipids in age-1; gas-1 vs. gas-1 (FDR < 5%).
B. NMR metabolomics reveals purine-related metabolic changes (n = 7).
C. Pathway analysis predicts enhanced purine degradation and xanthine buildup.
D. Increased xdh-1 expression and xanthine oxidase activity support xanthine accumulation.
E. Chemical structures of xanthine and methylxanthines used.
F–G. Immunoblots show altered Akt and PKA signaling upon purine metabolite treatment in WT and NDUFA9 KO cells.
Reference
- Gioran, Anna, et al. "Multi‐omics identify xanthine as a pro‐survival metabolite for nematodes with mitochondrial dysfunction." The EMBO journal 38.6 (2019): e99558. https://doi.org/10.15252/embj.201899558
Publications
Here are some of the lipidomics-related papers published by our clients:

- White matter lipid alterations during aging in the rhesus monkey brain. 2024. https://doi.org/10.1007/s11357-024-01353-3
- Characterization of Dnajc12 knockout mice, a model of hypodopaminergia. 2024. https://doi.org/10.1101/2024.07.06.602343
- Annexin A2 modulates phospholipid membrane composition upstream of Arp2 to control angiogenic sprout initiation. 2023. https://doi.org/10.1096/fj.202201088R
- Lipid Membrane Engineering for Biotechnology (Doctoral dissertation, Aston University). 2023. https://doi.org/10.48780/publications.aston.ac.uk.00046663
- Loss of G0/G1 switch gene 2 (G0S2) promotes disease progression and drug resistance in chronic myeloid leukaemia (CML) by disrupting glycerophospholipid metabolism. 2022. https://doi.org/10.1002/ctm2.1146
- Summative and ultimate analysis of live leaves from southern US forest plants for use in fire modeling. 2020. https://doi.org/10.1152/ajpgi.00184.2023
- Multi‐omics identify xanthine as a pro‐survival metabolite for nematodes with mitochondrial dysfunction. 2019. https://doi.org/10.15252/embj.201899558