Integrated Transcriptomic and Lipidomics Analysis
Map Gene Regulation to Lipid Outcomes—Fast, Quantitative, and Mechanistically Clear
Creative Proteomics integrates RNA-seq with lipidomics to help you uncover lipid pathway regulators, identify targetable nodes, and validate mechanistic models—all in one streamlined service.
- RNA–lipid network analysis, pathway enrichment, regulatory inference
- Orbitrap and triple-quad platforms for untargeted + absolute quantification
- Integrated reporting, with pathway diagrams, ranked features, and QC-backed data
Submit Your Request Now
×Deliverables
- Raw Data Files: FASTQ (RNA), mzML/wiff/raw (lipid)
- Processed Tables: Annotated transcripts and lipid species with quantification
- Statistical Models: PLS/DIABLO score plots, correlation networks, variable rankings
- Pathway Visuals: Enriched KEGG/LIPID MAPS overlays, network diagrams
- Interpretive Report: Mechanism-driven summaries, hit prioritization, and actionable insights
- What We Provide
- Advantages
- Technology Platform
- Sample Requirement
- Demo
- FAQs
Why Integrate Transcriptomics and Lipidomics in Your Study?
Traditional single-omics approaches often fall short in explaining how gene expression changes drive measurable functional outcomes. Integrated transcriptomic and lipidomics analysis bridges this gap by linking upstream transcriptional regulation (via RNA-seq) with downstream lipid phenotype shifts (via lipid profiling), delivering a mechanistically coherent view of your biological system.
By analyzing these two layers in parallel, researchers can:
- Identify which gene modules or transcription factors regulate specific lipid species or classes
- Determine whether observed lipidomic shifts are on-target responses or part of compensatory remodeling pathways
- Prioritize druggable enzymes or regulatory nodes that causally link gene expression and lipid metabolism
- Move beyond correlative data, toward causative pathway modeling
This integrated approach is especially valuable in:
- Metabolic pathway research
- Drug mechanism of action (MOA) studies
- Nutrient or compound response profiling
- Host–microbe interaction analysis
- Synthetic biology or microbial strain optimization
In short, if your goal is to connect regulatory input with lipid output, integrated transcriptomic and lipidomics analysis offers a powerful, quantitative, and biologically meaningful solution.
What's Included in Our Integrated Transcriptomic and Lipidomics Analysis Services
Service Contents
- Transcriptomic Analysis Services
- Lipidomics Analysis Services
- Multi-Omics Integration & Analytics
Transcriptomic Analysis Services
| Service Module | Description |
|---|---|
| Bulk RNA-seq (PolyA+ or rRNA-depleted) | High-depth sequencing of total or mRNA to capture gene expression profiles across coding and non-coding transcripts. |
| Targeted Transcript Panels | Focused analysis of lipid metabolism–related genes (e.g., FASN, SCD1, ACACA, PLA2G, HMGCR, CYPs) using curated panels or custom primer sets. |
| Differential Expression (DE) Analysis | Identify significant gene-level changes across experimental groups using DESeq2 or edgeR. |
| Pathway Enrichment & Network Mapping | Map differentially expressed genes to lipid-associated pathways (KEGG, Reactome) and regulatory networks (e.g., SREBFs, PPARs). |
| Transcription Factor Activity Inference | Predict activation or inhibition of upstream TFs based on transcriptomic shifts and motif enrichment. |
| Service Module | Description |
|---|---|
| Untargeted Lipidomics (LC–HRMS) | Broad-spectrum profiling of lipids across >25 classes (e.g., TG, DG, PC, PE, Cer, SM, LPC, cholesterol, oxysterols) using Orbitrap-MS. |
| Targeted Lipid Quantification (LC–MS/MS, MRM/PRM) | Absolute or class-normalized quantification of selected lipid panels with isotopically labeled internal standards. |
| Chain Composition and Isomer Resolution | Resolution of lipid molecular species by chain length, unsaturation, hydroxylation, and isomeric structure. |
| MS/MS Structural Confirmation | Fragmentation-based identification of key lipids using spectral libraries (e.g., LipidBlast, LIPID MAPS). |
| Oxysterol, Eicosanoid, or Specialized Lipid Panels | Optional add-on for cholesterol derivatives, lipid mediators, or low-abundance regulatory lipids. |
Multi-Omics Integration & Analytics
| Service Module | Description |
|---|---|
| Cross-Omics Correlation Analysis | Pairwise or multivariate correlation of lipid species with gene expression levels (e.g., Pearson, Spearman, WGCNA). |
| PLS, DIABLO, and Multiblock Models | Latent variable modeling to identify shared structures and predictive axes between omics layers. |
| Gene–Lipid Network Visualization | Interactive networks showing regulatory links from transcripts to lipid outputs. |
| Mechanistic Interpretation Reports | Pathway-centric summaries explaining how transcript-level changes impact lipid outcomes. |
| Target Ranking & Prioritization | Ranked lists of enzymes or regulators that explain observed lipid changes (with statistical support). |
Advantages of Our Integrated Approach
- Gene coverage: typically >20,000 features quantified; >95% of expressed lipid-pathway genes retained post-QC.
- Lipid coverage: >2,000 species across ≥25 classes in untargeted mode; targeted panels with sub-class absolute quant.
- Mass accuracy & resolution: HRMS ≤2 ppm mass error; Orbitrap resolution up to 120k @ m/z 200; triple-quad LOD/LOQ down to pg–ng on-column (class-dependent).
- Repeatability: median CV ≤10–15% across QC replicates for both omics after normalization and QC filtering.
- ID confidence: MS/MS-confirmed IDs at LIPID MAPS/mzCloud-backed levels; FDR-controlled DE (q < 0.05).
- Integration strength: cross-validated gene→lipid predictive models (e.g., PLS Q²) reported per dataset so you know how much biology is explained.
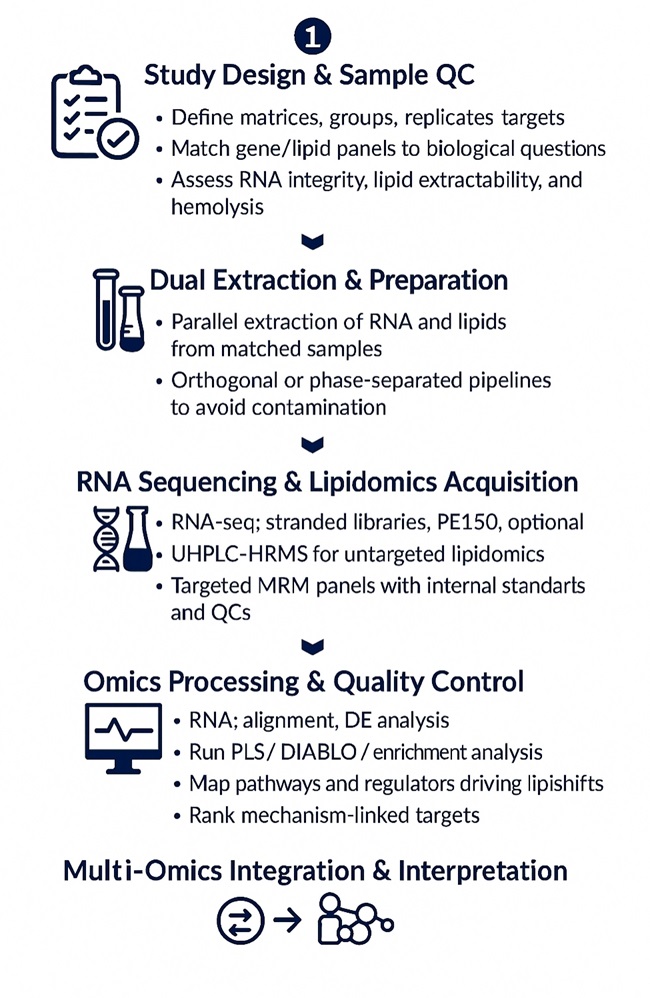
Workflow for Integrated Transcriptomic and Lipidomics Analysis
1. Study design consult — matrices, groups, replicates, power, covariates; enzyme/gene panels aligned to lipid classes of interest.
2. Sample QC — RNA integrity (RIN/DV200), lipid extraction feasibility, hemolysis checks for plasma/serum.
3. Nucleic acid & lipid extraction — orthogonal pipelines to prevent cross-contamination; phase-separated extraction for co-isolates when applicable.
4. Library construction & sequencing — stranded RNA-seq, with run and lane balancing.
5. UHPLC–MS acquisition — untargeted HRMS ± targeted panels with bracketed QCs, blanks, matrix spikes.
6. Primary processing — RNA alignment/quant; lipid peak picking, deisotoping, alignment, MS/MS confirmation.
7. Normalization & QC — batch correction, internal-standard scaling, drift correction, outlier handling.
8. Cross-omics integration — correlation networks, PLS/DIABLO, pathway concordance (gene sets ↔ lipid sets), regulator enrichment.
9. Results synthesis — mechanism-centric narratives, ranked targets, figures, and reproducible code-running notebooks.
Technology Platform for Integrated Transcriptomic and Lipidomics Analysis Service
Transcriptomics (RNA-seq)
Sequencers: Illumina NovaSeq X/6000 or NextSeq 2000
Library Prep: stranded mRNA (poly(A)+) or rRNA-depleted total RNA (NEBNext/Illumina kits)
Key Parameters:
- Read type/length: PE150 (or PE100 for high-plex runs)
- Depth (typical): 30–50 M read pairs / sample (bulk)
- QC: RIN screening (RIN ≥ 7 recommended), adapter/quality trimming, duplication rate, mapping rate, 5'–3' bias metrics
- Quantification: STAR/Salmon → gene/isoform TPM/CPM + raw counts; DESeq2/edgeR differential models
Lipidomics (LC–MS)
UHPLC: Thermo Vanquish or Waters ACQUITY UPLC
HRMS: Thermo Q Exactive HF-X (full-scan + ddMS2/diaPASEF-style acquisition)
Targeted MS/MS: SCIEX Triple Quad 6500 or Waters Xevo TQ-XS (MRM)
Chromatography:
- Reversed-phase C18 (e.g., 2.1 × 100 mm, 1.7 µm) for chain length/unsaturation resolution
- HILIC/amide for polar classes (LPC/LPE/PI/PS/PG/PA)
Ionization: ESI±; spray voltage 3.0–3.5 kV; capillary temp 300–320 °C
Acquisition:
- HRMS resolution 60–120k @ m/z 200, AGC and dynamic exclusion optimized per class
- Targeted MRM transitions curated per class with ≥5-point calibrations and isotope-labeled internal standards
Quantification: class-normalized or absolute (internal standard curves), isotopic overlap correction, in-run QC (pooled samples, blanks, SRMs)
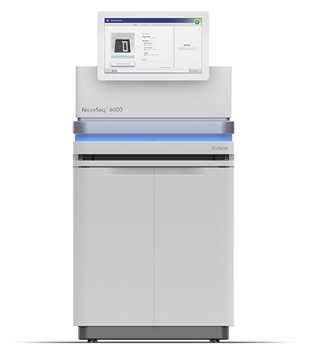
Illumina NovaSeq 6000 (Figure from Illumina)
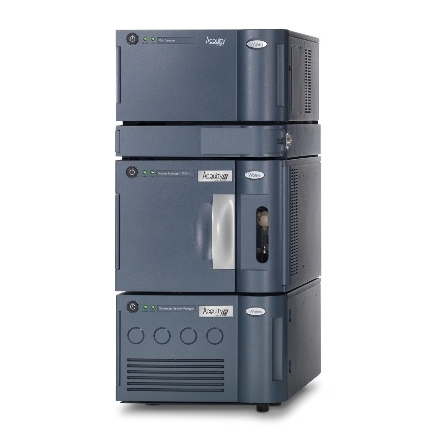
Waters ACQUITY UPLC System (Figure from Waters)
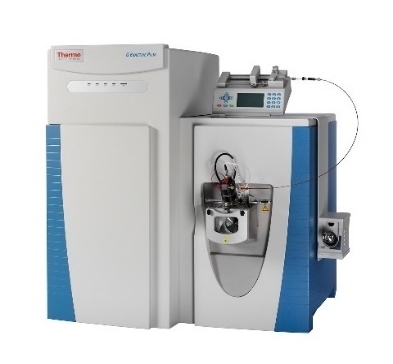
Q Exactive™ HF-X (Figure from Thermo)
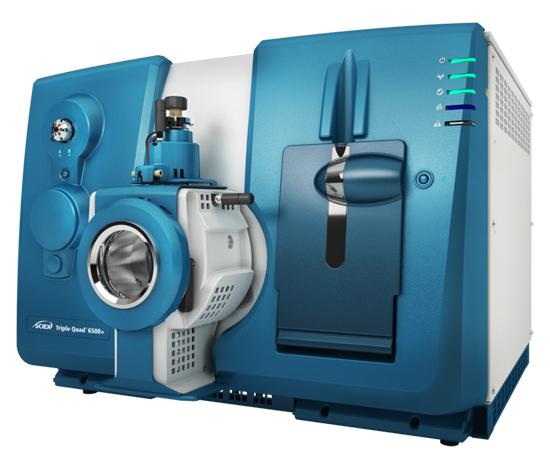
SCIEX Triple Quad™ 6500+ (Figure from Sciex)
Sample Requirements for Integrated Transcriptomic and Lipidomics Analysis Service
| Omics Stream | Accepted Sample Types | Minimum Amount (per sample) | Container & Preservation |
|---|---|---|---|
| RNA-seq | Total RNA; cell pellets; snap-frozen tissues | Total RNA: ≥1 µg (≥20 ng/µL) with RIN ≥ 7 Cells: ≥1×10⁶ Tissue: ≥20–50 mg | RNase-free tubes; −80 °C; DNase-free; ship on dry ice |
| Untargeted Lipidomics | Plasma/serum; tissue; cell pellets; microbes | Plasma/Serum: ≥150–200 µL; Tissue: ≥30–50 mg; Cells: ≥1×10^6 | Solvent-rinsed tubes (glass/PTFE-lined for extracts); −80 °C; dry ice shipping |
| Targeted Lipid Panels | Same as above + purified organelles (optional) | As above; discuss if micro-quantities | Solvent-rinsed tubes (glass/PTFE-lined for extracts); −80 °C; dry ice shipping |
| Optional 13C/2H Tracing | Cells; microbes | ≥2×10⁶ cells per condition | Sterile, defined media for labeling |
Replicates: Biological n ≥ 3 recommended per group. FFPE not supported for lipidomics.
Use Cases
Drug Mechanism & Target Prioritization
Identify how gene expression changes under treatment drive specific lipidomic responses.
→ Link lipid biomarkers to transcriptional regulators for actionable mechanistic insight.
Nutrient & Stress Response Studies
Track how diet, starvation, or oxidative stress remodels lipid metabolism.
→ Uncover upstream transcriptional programs driving lipid class shifts.
Metabolic Engineering
Assess engineered strain performance beyond titer yield.
→ Diagnose pathway bottlenecks and compensatory transcriptional changes affecting lipid production.
Host–Microbe Interaction
Resolve lipid remodeling during colonization or infection.
→ Connect immune-metabolic responses to microbial-triggered gene expression.
Cell Model Validation
Ensure model fidelity and metabolic stability.
→ Benchmark transcript–lipid profiles against reference states for QA or standardization.
Demo Results
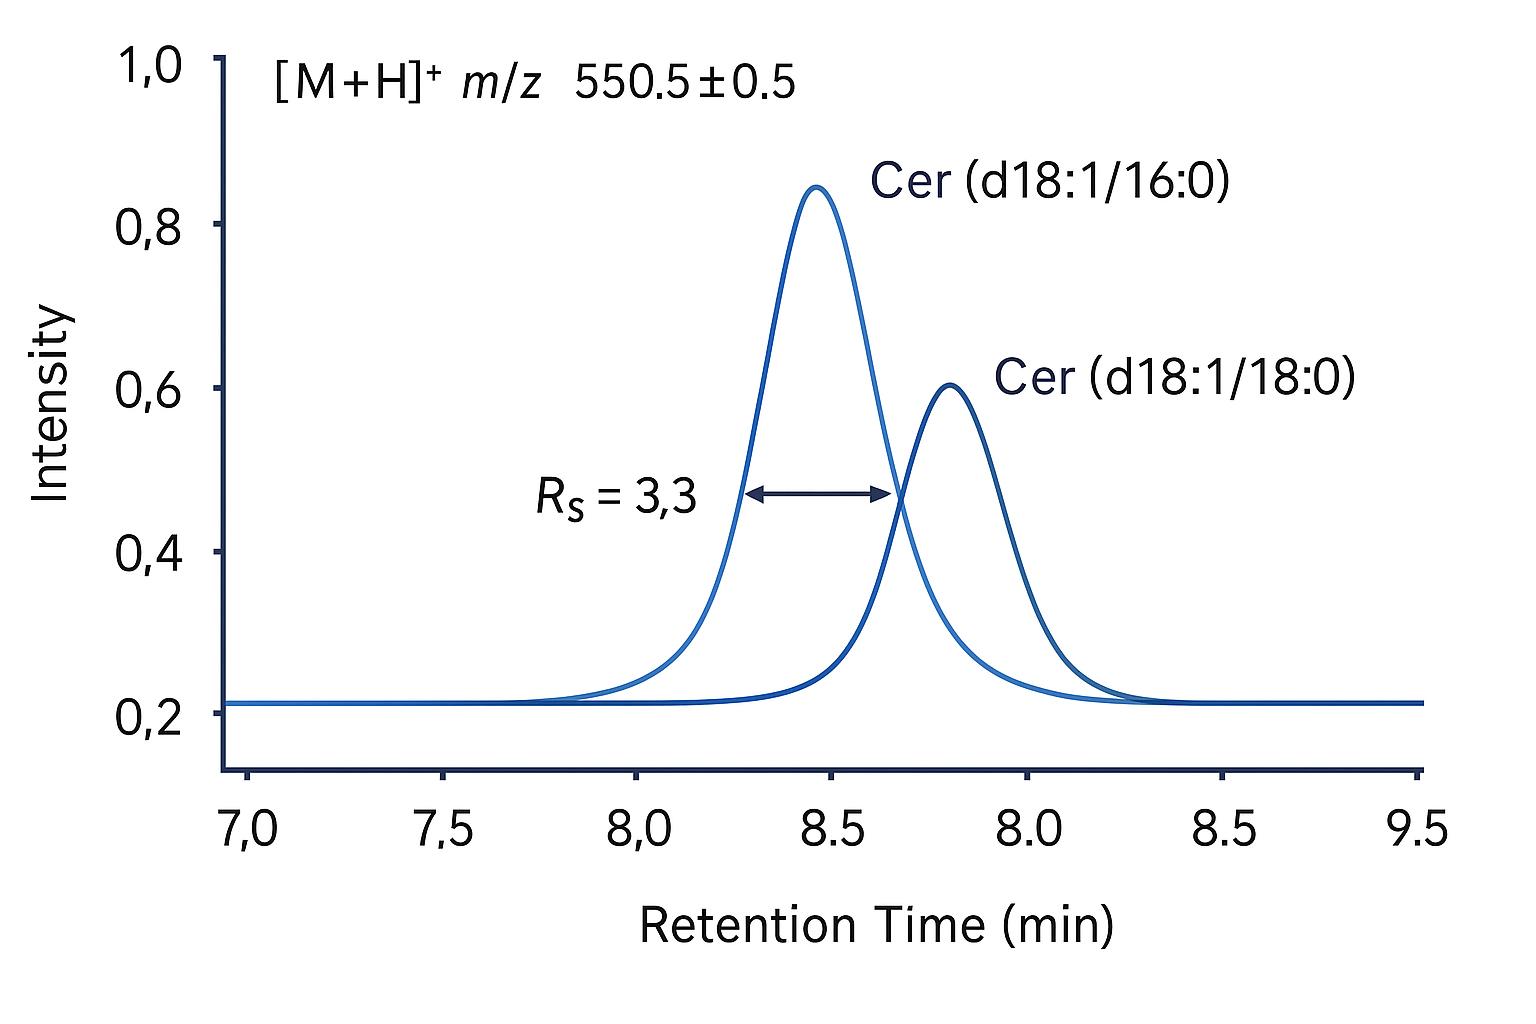
LC–MS/MS chromatogram showing baseline-resolved peaks of ceramide isomers.
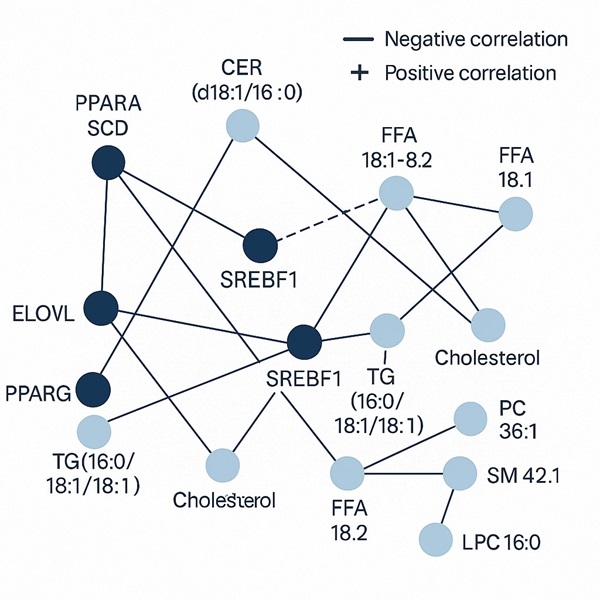
Correlation network linking regulatory genes and lipid species. Solid lines indicate positive, dashed lines negative correlations.
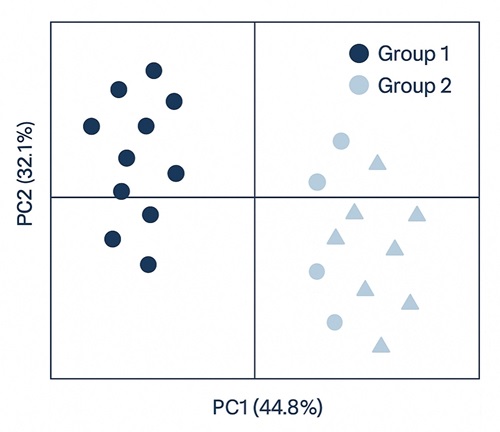
DIABLO score plot showing clear separation of two groups across integrated transcriptomic and lipidomic data.
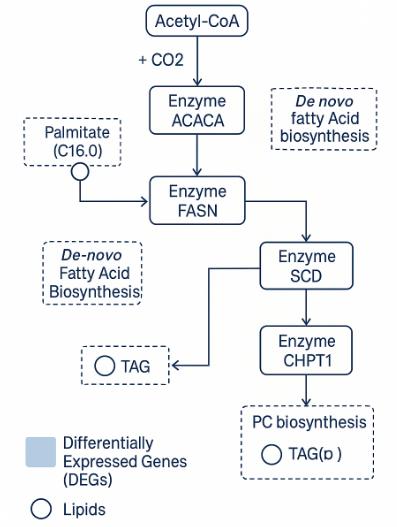
Overlay of DEGs and lipid products in fatty acid biosynthesis, highlighting transcriptional–lipidomic coordination.
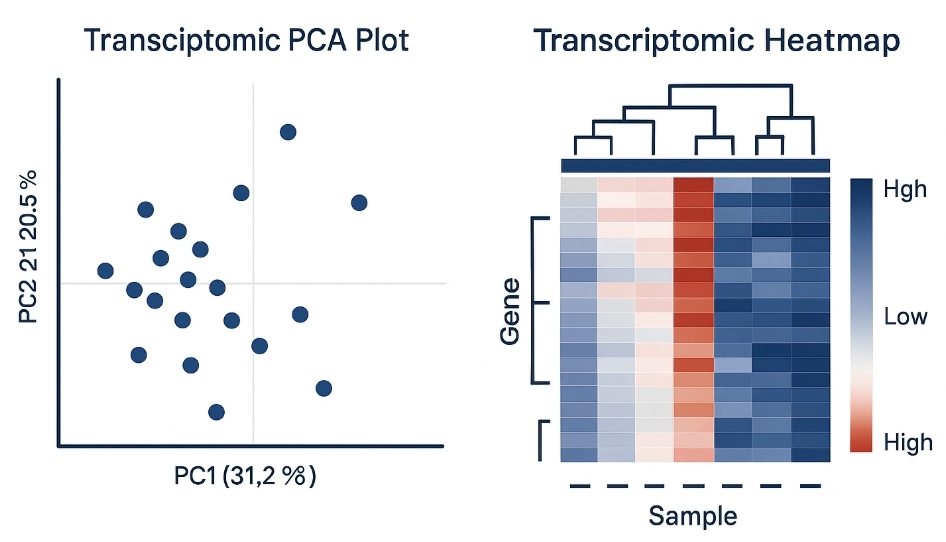
PCA and heatmap of transcriptomic data showing sample clustering and lipid pathway gene expression.
FAQ of Integrated Transcriptomic and Lipidomics Analysis
How do I ensure the two omics layers are meaningfully integrated rather than analyzed in parallel?
Start with a clearly defined hypothesis linking transcript-level regulation to lipid output. Matched sample design, shared metadata structures, and coordinated quality control across platforms are key. Integrative models (e.g., DIABLO, PLS) should be pre-specified and used to explain variance across both layers.
Do I need perfectly matched samples for RNA and lipid extraction?
Yes. Matched aliquots from the same biological sample minimize noise and increase interpretability. When not possible, ensure tight experimental alignment and apply robust normalization across datasets.
What kind of biological controls improve interpretability in multi-omics designs?
Include baseline controls, known perturbations, and pooled references. Controls that selectively influence either the transcriptome or lipidome are especially valuable for validating causal direction in gene–lipid models.
When should I use untargeted vs. targeted lipidomics in an integrated study?
Use untargeted lipidomics for discovery and pattern recognition; follow with targeted panels for absolute quantification and confirmation of lipids that are mechanistically relevant.
How are batch effects handled across RNA-seq and LC–MS workflows?
Harmonize design across both pipelines: randomization, internal standards, pooled QC samples, and statistical batch correction are applied independently and jointly to maintain cross-layer comparability.
What types of integrative models are used, and when?
Correlation matrices are ideal for exploratory analysis. PLS/DIABLO identifies predictive cross-omics features. Network-based methods reveal regulatory cascades. Choice depends on whether your goal is explanation, prediction, or prioritization.
What if transcriptional changes are observed without lipidomic changes—or vice versa?
This provides mechanistic insight. RNA-only changes may suggest post-transcriptional regulation or enzymatic buffering. Lipid-only shifts may reflect allosteric effects or flux-level changes. Both are biologically informative.
Can this platform support time-course or dose–response designs?
Yes. Temporal and quantitative gradients improve causal inference, help map lead–lag relationships, and strengthen statistical confidence in transcript–lipid dynamics.
How are cross-omics features selected and ranked?
Features are prioritized based on their contribution to integrative models (loadings, VIP scores), pathway relevance, and reproducibility across replicates and subsets. We use stability selection and biological context filters, not just raw fold-change.
What metrics define successful multi-omics integration?
Integrative model quality (e.g., Q², separation in score plots), correlation strength, pathway enrichment, and mechanistic coherence are used to assess success. All metrics are benchmarked against internal references and controls.
What exactly will I receive at the end of the project?
You'll receive raw and processed data files, annotated transcript and lipid tables, network and pathway visualizations, integrative model outputs, and a final report outlining key findings, ranked targets, and suggested next steps.
Can I expand to proteomics or metabolomics later using the same samples?
Yes. The experimental and metadata design is modular and extensible. Integration with future omics layers (proteome, metabolome) is fully supported.
Learn about other Q&A about proteomics technology.
Publications
Below are some of the papers published by our clients:

- Lipid droplet-associated lncRNA LIPTER preserves cardiac lipid metabolism. 2023.
- Proteolytic activation of fatty acid synthase signals pan-stress resolution. 2024.
- Annexin A2 modulates phospholipid membrane composition upstream of Arp2 to control angiogenic sprout initiation. 2023.
- Lipin-1 regulates lipid catabolism in pro-resolving macrophages. 2020.
- White matter lipid alterations during aging in the rhesus monkey brain. 2024.