TMT Based Proteomics Service
TMT (Tandem Mass Tag) is a reliable technology for relative protein quantification through in vitro isotopic peptide labeling. At Creative Proteomics, we leverage advanced high-resolution mass spectrometry platforms to deliver multi-dimensional TMT plex proteomics services, capable of simultaneously analyzing up to 18 protein samples. Supported by a skilled bioinformatics team, we provide thorough data analysis solutions tailored to advance your research goals.
Submit Your Request Now
×
- What is TMT
- How It Works
- TMT Services
- TMT Data Analysis
- Sample Requirements
- Demo
- Case
- Applications
- FAQ
What Is TMT?
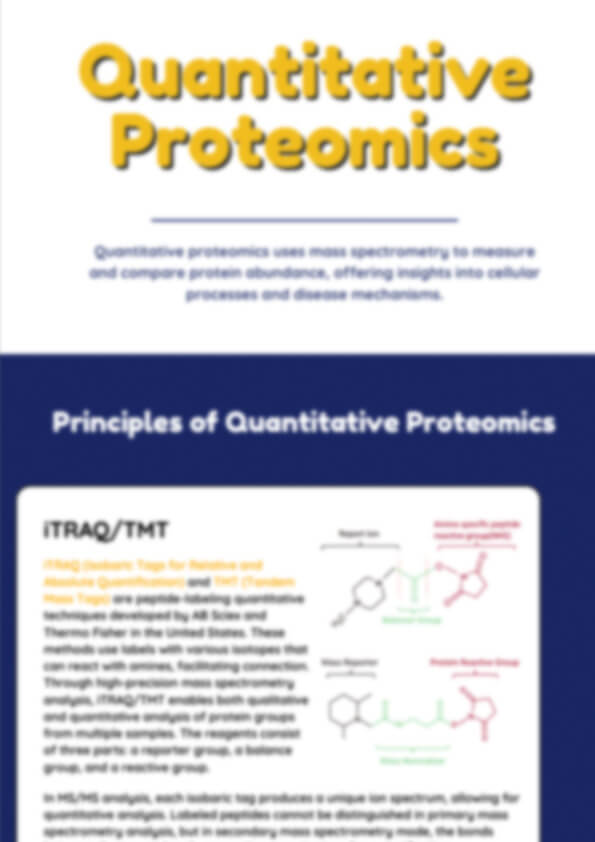
The TMT, or Tandem Mass Tag Reagents, is a well-established stable isotope labeling reagent developed by Thermo Fisher Scientific. TMT quantification belongs to the isobaric isotope labeling protein quantitative method, and remains the most widely adopted approach among quantitative methods. The mass-tagging reagent within a set consists of an amine-reactive NHS-ester group (Amine Reactive Group), a spacer arm (balance group), and a mass reporter group. Based on the principle of isotope, peptides from different sources are labeled by linking different isotope labels to N- terminus of a peptide or to a lysine residue, particularly under pH 8.5. In a specific combination kit, the three groups ensure a constant total molecular weight through different numbers and combinations of 13C and 15N isotopes at different locations, resulting in monoisotopic mass differences of 6 mDa in the reporter and these differences can be accurately quantified using high resolution mass spectrometry (MS), so as to realize the differentiation of peptide sources after labeling peptide segments.
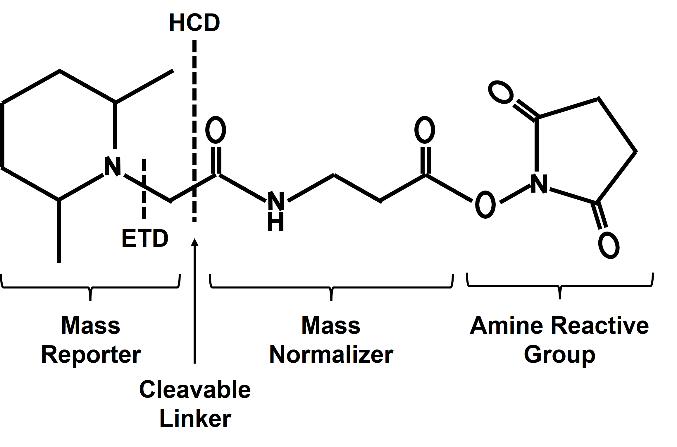 Figure 1. The general chemical structure formula of the TMT reagent.
Importantly, up to now, TMT kits include TMT6-plex, TMT10-plex, TMT11-plex, TMTPro16-plex, and TMTPro18-plex. It can be used to label up to 18 different samples. For each sample, a unique reporter mass (i.e., 126-135Da) in the low mass region of the MS/MS spectrum is used to measure relative protein expression levels during peptide fragmentation. Which offers multiplexing capabilities for relative quantitative proteomics analysis. This TMT label technique has been widely adopted in studies focusing on differential expression proteome analysis and the discovery of protein biomarkers for diseases.
Table 1. Modification masses of the Thermo Scientific TMT Label Reagents.
| Label Reagent | Label Reagent | Modification Mass (monoisotopic) | Modification Mass (average) | HCD Monoisotopic Reporter Mass* | ETD Monoisotopic Reporter Mass** |
|---|---|---|---|---|---|
| TMT10-126 | TMT6-126 | 229.162932 | 229.2634 | 126.127726 | 114.127725 |
| TMT10-127N | TMT6-127 | 229.162932 | 229.2634 | 127.124761 | 115.12476 |
| TMT10-127C | - | 229.162932 | 229.2634 | 127.131081 | 114.127725 |
| TMT10-128N | - | 229.162932 | 229.2634 | 128.128116 | 115.12476 |
| TMT10-128C | TMT6-128 | 229.162932 | 229.2634 | 128.134436 | 116.134433 |
| TMT10-129N | TMT6-129 | 229.162932 | 229.2634 | 129.131471 | 117.131468 |
| TMT10-129C | - | 229.162932 | 229.2634 | 129.13779 | 116.134433 |
| TMT10-130N | - | 229.162932 | 229.2634 | 130.134825 | 117.131468 |
| TMT10-130C | TMT6-130 | 229.162932 | 229.2634 | 130.141145 | 118.141141 |
| TMT10-131 | TMT6-131 | 229.162932 | 229.2634 | 131.13818 | 119.138176 |
| TMT11-131C | 229.169252 | 229.2634 | 131.144499 | 118.141141 |
* HCD (higher-energy collision dissociation) is a collisional fragmentation method that generates ten unique reporter ions from 126 to 131Da.
** ETD (electron transfer dissociation) is a non-ergodic fragmentation method that generates six unique reporter ions from 114 to 119Da.
How Does TMT Labeling Work?
TMT proteomics workflow
 Figure 3. Workflow of TMT labeling proteomics. (Yuste-Montalvo, Alma et al. Frontiers in immunology, 2021)
In MS1 spectrum, the same peptide segment from different labeled samples showed a peak, due to the same peptide segment in different samples labeled by TMT reagent showed the same mass-to-charge ratio.
In MS2, the chemical bond between the reporter group, the balance group and the reaction group are broken, and the TMT reporter group and the balance group are released. The neutral loss of the balance group occurs, and the reporting groups are detected and recorded by MS. TMT reported ion peaks are generated in the low-mass region of the MS2 spectrum, and their intensity reflects the relative expression information of the peptide in different samples. In addition, the mass-to-charge ratio of the peptide fragment ion peak in MS2 reflects the sequence information of the peptide. The qualitative and relative quantitative information of proteins can be obtained from these raw data through database retrieval.
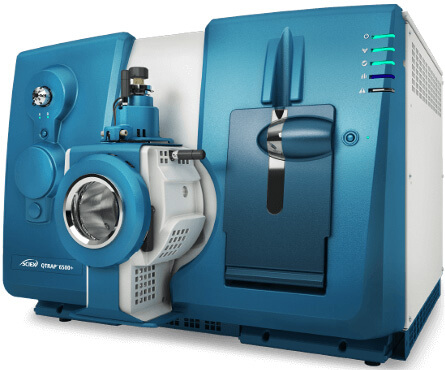
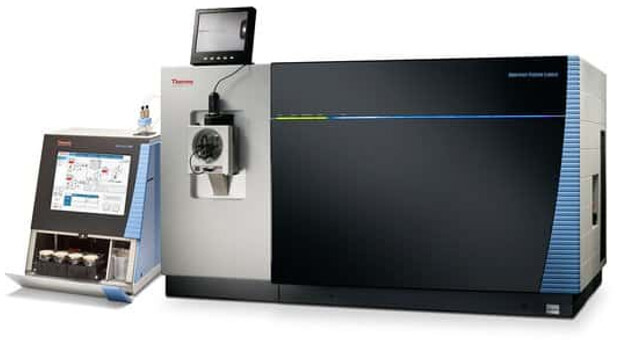
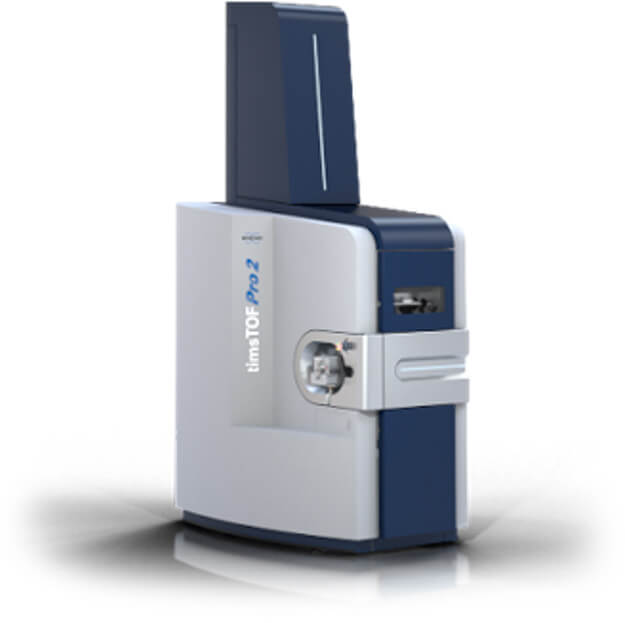
Technical Platforms
Instrument picture from the official website
Our TMT Based Proteomics Service
Our TMT-based proteomics service enables high-throughput, accurate protein quantification across multiple samples in a single experiment. The workflow is as follows:
Sample Labeling: Different TMT labeling reagents are reacted with individual samples, ensuring all peptide segments within a single sample are tagged with a specific label.
Peptide Pooling: After labeling, equal amounts of peptides from all samples are mixed.
Separation: The mixed peptides are separated using offline reversed-phase liquid chromatography (RPLC).
Mass Spectrometry Analysis: During MS detection, the primary parent ions of identical peptides across different samples appear as a single peak due to their identical total molecular weight, representing a combined signal from all samples.
Selected precursor ions are fragmented, and the reporter ions from different samples are released and detected, enabling precise quantification.
 Figure 2. Procedure schematic for quantitative proteomics using TMT 10-plex Label Reagents.
In addition to TMT-based proteomics, our services also include other protein quantification solutions, such as iTRAQ (Isobaric Tags for Relative and Absolute Quantification). Like TMT, iTRAQ utilizes isobaric labeling for multiplex quantification of proteins and peptides but is optimized for slightly different experimental needs, offering flexibility for diverse research goals.
TMT Labeling Quantitative Proteomic Analysis
| Statistical analysis of protein identification | |
|---|---|
| Protein quantitative analysis | Principal component analysis |
| Pearson correlation analysis | |
| Clustering analysis | |
| Functional annotation | Total protein GO analysis |
| PPI Network Analysis | |
| Pathway analysis | |
| Differential protein analysis | GO enrichment analysis of differential proteins |
| Pathway pathway enrichment analysis of differential proteins | |
Sample Requirements
| Sample type | Recommended sample size | |
|---|---|---|
| Animal tissues | Hard tissues (bones, hair) | 300-500mg |
| Soft tissues (leaves, flowers of woody plants, herbaceous plants, algae, ferns) | 200mg | |
| Plant tissues | Hard tissues (roots, bark, branches, seeds, etc.) | 3-5g |
| Microbes | Common bacteria, fungal cells (cell pellets) | 100μL |
| cells | Suspension/adherent cultured cells (cell count/pellet) | >1*107 |
| Fluids | Plasma/serum/cerebrospinal fluid (without depletion of high abundance proteins) | 20μL |
| Plasma/serum/cerebrospinal fluid (with depletion of high abundance proteins) | 100μL | |
| Follicular fluid | 200μL | |
| Lymph, synovial fluid, puncture fluid, ascites | 5mL | |
| Others | Saliva/tears/milk | 3-5mL |
| Culture supernatant (serum-free medium cannot be used) | 20mL | |
| Pure protein (best buffer is 8MUrea) | 300μg | |
| FFPE | Each slice: 10µm thickness, 1.5×2cm area | 15-20 slices |
Demo For TMT Based Proteomics Service
Figures come from ( Shibata, H.et.al, J Clin Immunol,2024)

PCA Plot of Sample Grouping

Pearson Correlation Analysis

Volcano Plot of Differential Proteins

Bar Chart of GO Enrichment for Candidate Proteins
TMT Based Proteomics Case Study

Applications Of TMT Based Proteomics
Pathogenesis Research
Identifies disease-related proteins and pathways, uncovering mechanisms like tumor progression or host-pathogen interactions.
Drug Target Discovery
Reveals therapeutic targets and drug effects by comparing proteomic changes in healthy, diseased, and treated states.
Biomarker Screening
Discovers sensitive protein biomarkers for early diagnosis and prognosis using biofluids like blood or urine.
Plant Breeding and Improvement
Pinpoints stress-resistance or yield-related proteins, aiding genetic improvement of crops.
Our Advantages
- Professional detection and analysis capability: Experienced technical team, strict and skillful techniques.
- Breadth: TMT kits demonstrate compatibility with samples derived from a wide range of sources, including cells, animal and plant tissues, bacteria, blood, subcellular protein fraction, etc.
- High adaptability: The quantitative technology is also applicable for the analysis of PTMs and IP-MS.
- High stability and reproducible: Reducing technical variation in the experimental workflow, obtain consistent and reproducible inter- and intra- assay results for data analysis.
- High specificity: TMT labeling efficiencies of > 99%.
- High resolution and sensitivity: Triple TOF 5600, Q-Exactive, Q-Exactive HF, Orbitrap Fusion™ Tribrid™.
TMT Based Proteomics FAQs
What is the difference between Label-free and TMT?
Label-free quantification measures peptide intensities or spectral counts without chemical labeling, offering simplicity but higher variability, while TMT uses isobaric tags for multiplexing and improved accuracy by analyzing up to 16 samples in a single mass spectrometry run.
What is the difference between iTRAQ and TMT?
Both methods enable isobaric labeling for relative protein quantification, but iTRAQ analyzes up to 8 samples, whereas TMT allows up to 18, providing better stability, higher sensitivity, and compatibility with high-resolution mass spectrometry.
What are the correction factors used for TMT?
TMT reporter ion signals require corrections for isotopic impurities, provided in reagent kits, to ensure accurate quantification. These corrections are minimal (~1.2%) and may not always need adjustment in analysis workflows.
What are the requirements of TMT for instruments, and which instruments can do this experiment at present?
TMT requires high-resolution mass spectrometers due to the small mass differences (~0.006 Da) between the reporter ions.A resolution of 50,000 or higher at the MS2 level is necessary to distinguish these ions accurately,such as Thermo Fisher Orbitrap QE/Fusion series and AB Sciex QTOF series.
Learn about other Q&A about other technologies.
Publications
Here are some publications in proteomics research from our clients:

- Mechanistic and biomarker studies to demonstrate immune tolerance in multiple sclerosis. 2022. https://doi.org/10.3389/fimmu.2021.787498
- Assessment of Fasciola hepatica glutathione S-transferase as an antigen for serodiagnosis of human chronic fascioliasis. 2018. https://doi.org/10.1016/j.actatropica.2018.07.002
- Morphological and genetic screens reveal mechanisms of BiDAC-induced plasma membrane protein degradation. 2024. https://doi.org/10.21203/rs.3.rs-4438596/v1
- Exploratory phosphoproteomics profiling of Aedes aegypti Malpighian tubules during blood meal processing reveals dramatic transition in function. 2022. https://doi.org/10.1371/journal.pone.0271248
- Regulation of cardiac ferroptosis in diabetic human heart failure: uncovering molecular pathways and key targets. 2024. https://doi.org/10.1038/s41420-024-02044-w
Reference
- Shibata, Hirofumi et al. "A Non-targeted Proteomics Newborn Screening Platform for Inborn Errors of Immunity." Journal of clinical immunology vol. 45,1 33. 25 Oct. 2024.