Integrated Proteomics and Metabolomics Service
At Creative Proteomics, we integrate proteomics and metabolomics to connect protein function mapping with metabolic profiling, delivering a complete cause-to-effect molecular view that drives discovery, accelerates development, and reduces research uncertainty.
Our Advantages:
- Comprehensive Molecular Coverage – Detect 8,000+ proteins & 1,500+ metabolites in one study.
- High Sensitivity & Accuracy – Low femtomole LOD for peptides, sub-nanomolar for metabolites.
- Robust Data Correlation – Cross-omics Pearson r > 0.85 for reliable biomarker validation.
- Advanced Platforms – Orbitrap Fusion Lumos, Q Exactive HF-X, LC-QTOF, GC-QQQ.
- Publication-Ready Insights – Figures, pathway maps, and in-depth interpretation.
Submit Your Request Now
×
- What We Provide
- Advantages
- Technology Platform
- Sample Requirement
- Deliverables
- Case
- FAQ
Why Choose Integrated Proteomics and Metabolomics Analysis?
In many advanced research projects, relying on a single omics approach often leaves critical gaps in understanding. Proteomics reveals the functional executors of biological processes – which proteins are expressed, modified, or degraded under specific conditions. Metabolomics captures the biochemical state of the system – the downstream metabolic changes that reflect cellular activity in real time.
When used separately, each technology offers only part of the picture:
- Proteomics alone may identify differential proteins but miss the ultimate biochemical consequences of those changes.
- Metabolomics alone may pinpoint altered metabolites but cannot explain the upstream regulatory mechanisms driving those shifts.
By integrating proteomics and metabolomics data, we can gain a comprehensive, cause-to-effect molecular view within the same study framework:
- Establish full biological pathways – from protein-level changes (cause) to metabolite variations (effect).
- Enhance biomarker reliability – cross-validate findings across two molecular layers, reducing false positives.
- Pinpoint critical regulatory nodes – identify enzymes, pathways, and network hubs central to system responses.
This dual-layer strategy is particularly valuable for projects seeking to unravel complex biological networks in fields such as drug mechanism research, stress-response studies, synthetic biology optimization, crop and microbial metabolic engineering, and environmental bioscience.
Specific Services Offered in Integrated Proteomics and Metabolomics Analysis
Creative Proteomics provides a comprehensive portfolio of targeted and untargeted analysis options that combine proteome and metabolome insights to support diverse research needs. Our services include:
Quantitative Differential Proteome and Metabolome Profiling
- Comparative analysis of protein and metabolite abundance across different conditions, treatments, or time points.
- Identification of significantly altered proteins and metabolites with statistical validation.
Post-Translational Modification (PTM)–Linked Metabolite Changes
Integrated detection of protein modifications such as phosphorylation, acetylation, and glycosylation, alongside corresponding metabolic pathway shifts.
Enzyme–Substrate Relationship Mapping
Correlation of enzymatic proteins with their downstream metabolites to reveal catalytic efficiency and pathway bottlenecks.
Pathway-Level Integrated Analysis
- Comprehensive mapping of proteomic and metabolomic data to KEGG, Reactome, and HMDB pathways.
- Identification of co-regulated nodes across metabolic and signaling pathways.
Biomarker Panel Development
Multi-omics validation of candidate biomarkers for improved specificity and reliability in research applications. Development of custom protein–metabolite marker panels.
Stress Response and Mechanistic Studies
Characterization of protein network reprogramming and metabolic flux changes under environmental, chemical, or genetic perturbations.
Synthetic Biology and Metabolic Engineering Support
Integrated profiling for engineered strains, crops, or cell lines to optimize metabolic output and pathway efficiency.
Custom Targeted Panels
Client-defined selection of specific proteins and metabolites for focused investigation. Flexible assay design to match precise project goals.
Why Choose Creative Proteomics for Integrated Proteomics and Metabolomics Analysis?
- Comprehensive Molecular Coverage – Detects over 8,000 proteins and 1,500+ metabolites in a single integrated study, maximizing biological insight.
- High Sensitivity – Limits of detection down to low femtomole for peptides and sub-nanomolar for metabolites.
- Wide Dynamic Range – Quantitative accuracy maintained over ≥5 orders of magnitude for proteins and ≥4 orders of magnitude for metabolites.
- Enhanced Data Correlation – Matched proteome–metabolome datasets with Pearson correlation coefficients >0.85 in cross-omics QC tests.
- Reproducibility – Intra-batch coefficient of variation (CV) consistently <15%, ensuring reliable comparisons.
- Dual-Mode Ion Detection – Positive and negative polarity switching in a single run for extended metabolite coverage.
- High-Throughput Capability – Supports up to 100 samples per batch without loss of resolution or accuracy.
Integrated Proteomics and Metabolomics Workflow: Step-by-Step Process
Step 1 – Project Consultation & Experimental Design
- Define research objectives, target proteins/metabolites, and analytical depth.
- Select suitable proteomics and metabolomics platforms (LC-MS/MS, GC-MS/MS; targeted or untargeted).
- Set sample requirements, QC strategy, and statistical models.
Step 2 – Sample Preparation
Use optimized protocols to extract proteins and metabolites from the same sample. Apply internal standards and pooled QC samples for cross-batch comparability. Store and handle samples under controlled conditions to prevent degradation.
Step 3 – Proteomics Analysis
- Digest proteins (e.g., trypsin) and purify peptides.
- Perform LC-MS/MS on Orbitrap Fusion Lumos or Q Exactive HF-X.
- Apply label-free or isobaric labeling (TMT/iTRAQ) quantification.
Step 4 – Metabolomics Analysis
- Extract and, for GC-MS, derivatize metabolites.
- Use LC-QTOF, Orbitrap MS, or GC-QQQ for targeted and untargeted profiling.
- Acquire data in both positive and negative ion modes.
Step 5 – Data Processing & Quality Control
Process with Proteome Discoverer, MaxQuant, Compound Discoverer, and XCMS. Validate with QC metrics: mass accuracy <2 ppm, retention time stability, CV < 15%. emove noise and align datasets for integration.
Step 6 – Multi-Omics Data Integration
Map proteins and metabolites to pathways (KEGG, HMDB, Reactome). orrelate enzymatic activity with metabolite changes. Identify network hubs and co-regulated modules.

What Methods Are Used for Integrated Proteomics and Metabolomics Analysis
Proteomics Platform
- LC-MS/MS System: Orbitrap Fusion Lumos, Q Exactive HF-X
- Mass Resolution: ≥120,000 FWHM at m/z 200
- Mass Accuracy: <2 ppm (internal calibration)
- Quantification Options: Label-free, TMT (6-plex to 16-plex), iTRAQ, SILAC
- Chromatography: NanoLC with C18 reversed-phase columns, particle size 1.7 μm, length 25–50 cm
- Scan Speed: Up to 20 Hz for high-throughput acquisition
Metabolomics Platform
- LC-MS/MS System: Agilent 1290 Infinity II UHPLC coupled to 6545 Q-TOF; Thermo Q Exactive Orbitrap MS
- GC-MS/MS System: Agilent 7890B GC with 7010 Triple Quadrupole MS
- Mass Resolution: ≥30,000 FWHM (LC-QTOF); unit resolution for GC-QQQ
- Polarity Switching: Positive/negative mode in a single injection
- Chromatography:
- LC: C18, HILIC, and amide columns for polar/non-polar metabolite separation
- GC: DB-5ms column, 30 m × 0.25 mm × 0.25 μm
- LOD/LOQ: Sub-nanomolar for targeted metabolites
Integrated Data Processing
- Software: Proteome Discoverer, MaxQuant, Compound Discoverer, XCMS, MetaboAnalyst
- Database Mapping: UniProt, KEGG, HMDB, Reactome
- Statistical Analysis: PCA, PLS-DA, volcano plots, correlation network mapping
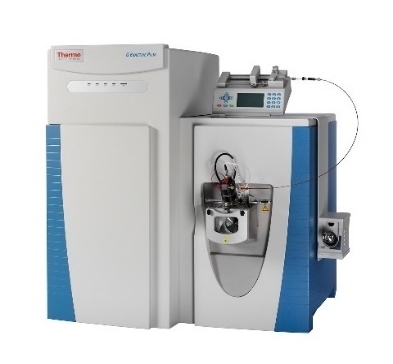
 Orbitrap Fusion Lumos Tribrid Mass Spectrometer(Figure from Thermo Fisher)
 Q Exactive HF-X (Figure from Thermo Fisher)
 Agilent 1290 Infinity II UHPLC coupled to 6545 Q-TOF
 Thermo Fisher Q Exactive (Figure from Thermo Fisher)
Sample Requirements for Integrated Proteomics and Metabolomics Service
| Sample Type | Recommended Amount | Storage Condition | Transport Condition | Notes |
|---|---|---|---|---|
| Cell Pellet | ≥1 × 10⁷ cells | -80 °C | Dry ice | Wash with PBS before freezing; avoid repeated freeze–thaw cycles. |
| Tissue | 50–200 mg | -80 °C | Dry ice | Snap-freeze in liquid nitrogen immediately after collection. |
| Serum / Plasma | 200–500 µL | -80 °C | Dry ice | Use EDTA or heparin anticoagulants for plasma; centrifuge to remove debris. |
| Urine | ≥1 mL | -80 °C | Dry ice | Collect midstream; centrifuge to remove particulates before storage. |
| Culture Medium | ≥1 mL | -80 °C | Dry ice | Collect supernatant after cell removal; filter to remove debris. |
| Microbial Sample | ≥1 × 10⁹ cells (wet weight ~200 mg) | -80 °C | Dry ice | Wash with PBS; snap-freeze immediately. |
Applications of Integrated Proteomics and Metabolomics

Drug Mechanism Studies
Map protein changes and metabolic shifts to uncover action pathways.
Biomarker Discovery
Identify and validate multi-omics biomarkers with improved specificity.

Synthetic Biology Optimization
Profile engineered strains to enhance metabolic output.

Crop and Plant Research
Link proteome–metabolome data to improve stress tolerance and yield.

Microbial Metabolic Engineering
Correlate enzyme activity with metabolite production for strain improvement.

Environmental Response Analysis
Characterize molecular adaptation to stress, pollutants, or climate change.
Nutritional and Food Science
Assess molecular impacts of diet, processing, or storage.
Deliverables for Integrated Proteomics and Metabolomics Analysis
| Category | Deliverable | Description |
|---|---|---|
| Raw Data | Raw Mass Spectrometry Files | Original LC-MS/MS or GC-MS/MS data from proteomics and metabolomics runs. |
| Processed Data | Protein Identification & Quantification Table | Detailed list of identified proteins, quantitative values, fold changes, and statistical significance. |
| Metabolite Identification & Quantification Table | Comprehensive list of identified metabolites, retention times, mass/charge (m/z), intensities, fold changes, and statistical validation. | |
| Statistical Analysis Results | Differential Expression Results | Volcano plots, heatmaps, and statistical summaries for significant proteins/metabolites. |
| Multivariate Analysis Results | PCA, PLS-DA plots showing sample grouping and separation. | |
| Integrated Omics Results | Protein–Metabolite Correlation Matrix | Correlation coefficients linking proteins and metabolites. |
| Pathway Enrichment Analysis | KEGG/HMDB/Reactome pathway mapping with highlighted significantly altered pathways. | |
| Visualization & Figures | Publication-Ready Figures | High-resolution heatmaps, volcano plots, pathway diagrams, and network maps. |
| Comprehensive Report | Interpretive Analysis Report | Detailed explanation of findings, integrated biological interpretation, methods, and QC results. |
| Data Files | Formatted Data Files | Processed datasets in CSV/Excel format for downstream analysis. |

XIC profiles of proteome (top) and metabolome (bottom) showing retention time versus intensity.

Proteomics mass spectrum showing major m/z peaks and intensities.

Volcano plots for proteome (left) and metabolome (right) with thresholds at |log₂FC| ≥ 1 and FDR < 0.05.

Heatmap of proteome (top) and metabolome (bottom) expression, clustered across control and treatment groups.
Case Study
Integrated Proteomics and Metabolomics Analysis Highlights Correlative Metabolite-Protein Networks in Soybean Seeds Subjected to Warm-Water Soaking
Journal: J Agric Food Chem
Published: 2020
- Abstract
- Results
- Conclusion
- Reference
Soaking soybean seeds is a prerequisite for the production of soybean food products, and it has been shown that the degree of water uptake under different swelling conditions directly affects the quality of subsequent soybean seed products in an unknown way, but the mechanism is still unclear. To elucidate the molecular changes in soybean seeds at different soaking temperatures, the authors performed proteomic and metabolomic analyses of seeds soaked at different temperatures and found that high-temperature (55°C) soaking could improve the nutritional value of soybean seeds by reducing the content of some common antinutrients.
Proteomic analyses showed that several enzymes related to carbohydrate and protein hydrolysis were activated in soybean seeds during water immersion at 55°C ( Figure 1).
 Figure 1
The results obtained in the combined proteomics and metabolomics study showed changes in various metabolites, including isoflavones, amino acids, and sugars, that were positively correlated with proteomic changes after 55°C soaking. Proteomics analysis showed that various enzymes associated with carbohydrate and protein hydrolysis were activated in 246 soybean seeds during water immersion at 55°C. These findings suggest a positive correlation with the production of free sugars such as glucose or galactose ( Figure 2).
 Figure 2
In addition, soaking soybean seeds at 55°C resulted in the degradation of indigestible anti-nutrients such as raffinose oligosaccharides (Figure 3).
 Figure 3
In this article, the authors analyze soybeans under different temperatures of soaking by integrating proteomic and metabolomic data. Findings that soaking of soybean seeds at 55°C will removes anti-nutrients including raffinose, and stachyose and results in an accumulation of essential amino acids and isoflavone aglycones, thereby increasing the nutritional quality of soybean seeds.
Reference
- Min, Cheol Woo, et al. "Integrated proteomics and metabolomics analysis highlights correlative metabolite-protein networks in soybean seeds subjected to warm-water soaking." Journal of Agricultural and Food Chemistry 68.30 (2020): 8057-8067.
FAQ of Integrated Proteomics and Metabolomics Analysis Service
What types of research questions are best addressed by integrated proteomics and metabolomics?
This approach is ideal for studies that require linking upstream protein regulation with downstream metabolic consequences, such as identifying molecular mechanisms, validating biomarkers across omics layers, mapping pathway bottlenecks, or comparing phenotypic differences between experimental conditions.
Can you analyze rare or low-abundance proteins and metabolites?
Yes. Our high-resolution LC-MS/MS and GC-MS/MS systems offer femtomole to sub-nanomolar detection limits, enabling reliable identification and quantification of low-abundance targets with appropriate enrichment and optimized sample preparation.
Is it possible to focus on a specific pathway or biological process instead of full coverage?
Absolutely. We offer both targeted and untargeted modes, allowing you to select specific pathways, enzymes, or metabolite classes for deeper coverage while still retaining the option for broader exploratory analysis.
How do you ensure cross-omics data consistency and comparability?
Proteins and metabolites are extracted from the same biological sample, processed under harmonized protocols, and analyzed with matched internal standards and pooled QC samples. This minimizes variability and ensures that correlations between datasets are biologically meaningful.
Can I provide my own data for integration with your analysis?
Yes. We can integrate external proteomics or metabolomics datasets into our analysis pipeline, provided they meet quality criteria (e.g., mass accuracy, QC standards) to ensure compatibility and reliability of the integrated results.
Do you offer interpretation support for non-specialists?
Yes. In addition to technical reports, we provide clear, biologically relevant interpretations, pathway visualizations, and summary figures that are accessible to cross-disciplinary research teams.
Are there options for method development or assay customization?
We can adapt the platform to suit your experimental design, including custom chromatographic methods, alternative labeling strategies, specialized derivatization protocols, or targeted panel design for specific biomolecules.
Learn about other Q&A about proteomics technology.
Publications
Here are some of the papers published by our clients:

- Mechanistic and biomarker studies to demonstrate immune tolerance in multiple sclerosis. 2022.
- Characterizing the proteome of bullous pemphigoid blister fluid utilizing tandem mass tag labeling coupled with LC–MS/MS. 2022.
- The yeast protein Mam33 functions in the assembly of the mitochondrial ribosome. 2019.
- Methyl donor supplementation reduces phospho‐Tau, Fyn and demethylated protein phosphatase 2A levels and mitigates learning and motor deficits in a mouse model of tauopathy. 2023.
- The activity of the aryl hydrocarbon receptor in T cells tunes the gut microenvironment to sustain autoimmunity and neuroinflammation. 2023.
- Lipid droplet-associated lncRNA LIPTER preserves cardiac lipid metabolism. 2023.
- Inflammation primes the kidney for recovery by activating AZIN1 A-to-I editing. 2023.
- Anti-inflammatory activity of black soldier fly oil associated with modulation of TLR signaling: A metabolomic approach. 2023.