Signaling Molecule Metabolism Analysis Service
Unlock the hidden language of cells. Creative Proteomics delivers signaling molecule metabolism analysis to reveal pathway activity, discover biomarkers, and support precision research and product development. Trust our expertise to transform complex signaling data into actionable insights.
- Detect low-abundance metabolites down to ≤ 1 pg/mL
- Quantify > 150 lipid mediators, cytokines, and sphingolipids
- Analyze up to 500 targets simultaneously with minimal sample volumes
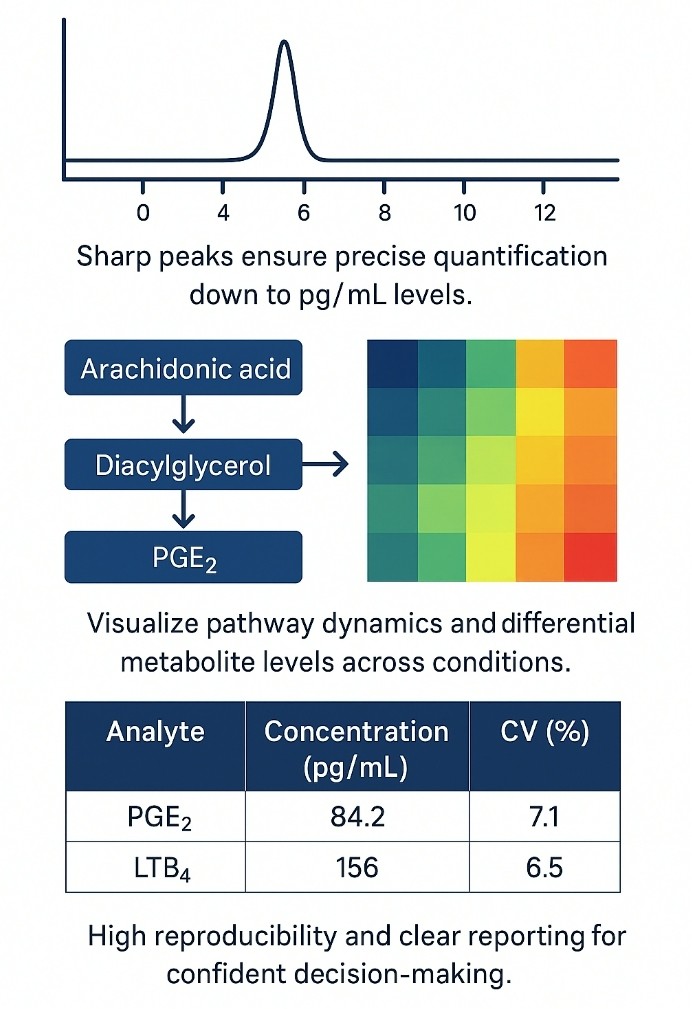
- Achieve < 10% intra-assay CV for robust reproducibility
- Integrate results seamlessly into multi-omics research
Submit Your Request Now
×
- What We Provide
- Advantages
- Technology Platform
- Sample Requirement
- Demo
- FAQ
What Are Signaling Molecules?
Signaling molecules are the chemical messengers—lipids, peptides, small metabolites, and gases—that initiate, amplify, or terminate cellular pathways. They include eicosanoids, sphingolipids, cyclic nucleotides, reactive oxygen/nitrogen species (RONS), cytokines, and chemokines. Their downstream metabolites often carry equally important biological information, reflecting pathway flux, turnover rates, and feedback regulation.
Why Analyze Signaling-Molecule Metabolism?
Metabolite-level data reveal pathway activity in real time. By quantifying both parent messengers and their biotransformation products you can:
- Validate Mechanisms of Action – Confirm that a candidate drug alters prostaglandin or sphingolipid flux as intended.
- Discover Translational Biomarkers – Low-abundance metabolites such as resolvin D1 or ceramide 1-phosphate correlate with efficacy and safety read-outs.
- Optimize Bioprocesses – Track cytokine or lipid-mediator build-up in cell-culture supernatants and adjust feed or harvest points for consistent product quality.
- Integrate Multi-Omics – Combine metabolite profiles with transcriptomics/proteomics for systems-level modeling of immune or metabolic networks.
Signaling Molecule Analysis Service Offered by Creative Proteomics
- Targeted Lipid Mediator Quantification: Precise measurement of over 150 eicosanoids, endocannabinoids, and specialized pro-resolving mediators to monitor inflammation, resolution, and vascular signaling pathways in plasma, tissue, or cell-culture samples.
- Cytokine and Chemokine Metabolite Profiling: Multiplex analysis of up to 400 soluble proteins and degradation fragments using high-sensitivity immunoassays, enabling comprehensive immune monitoring and biomarker discovery from minimal sample volumes.
- Cyclic Nucleotide and Catabolite Analysis: Ultra-sensitive quantification of intracellular messengers like cAMP, cGMP, and related breakdown products using UPLC-fluorescence or LC-MS/MS, crucial for signal transduction studies.
- Sphingolipid Flux Mapping: Quantification of ceramides, sphingosine-1-phosphate, and phosphorylated derivatives in tissues or biofluids to elucidate pathways involved in cell survival, apoptosis, and membrane dynamics.
- Reactive Carbonyl and Oxidative Stress Marker Detection: Measurement of reactive species such as 4-HNE, MDA, and their conjugates, providing insights into oxidative stress, lipid peroxidation, and cellular injury mechanisms.
- Custom Method Development: Tailor-made analytical solutions for unique or novel signaling molecules, including assay development, full validation, and reporting to meet specific research or quality-control objectives.
Coverage List—Representative Analytes & Related Metabolites
| Signaling Class | Representative Parent Molecules | Key Metabolites / Precursors Detectable | Typical Biological Role | Preferred Detection Method |
|---|---|---|---|---|
| Eicosanoids | PGE₂, LTB₄, TXB₂, 5-HETE, 12-HETE | 13,14-dihydro-PGE₂, 20-OH-LTB₄ | Inflammation, vascular tone, immune modulation | LC-MS/MS (MRM) |
| Specialized Pro-Resolving Mediators (SPMs) | Resolvin D1, Protectin D1, Maresin 1, Lipoxin A4 | 17-oxo-DHA, 14-oxo-DHA | Resolution of inflammation, tissue healing | LC-MS/MS, HRMS |
| Sphingolipids | Cer(d18:1/16:0), S1P, SM(d18:1/16:0) | Ceramide-1-phosphate, HexCer(d18:1/16:0) | Apoptosis, cell survival, membrane dynamics | LC-MS/MS |
| Cyclic Nucleotides | cAMP, cGMP, cUMP, 8-Br-cAMP | 5′-AMP, 5′-GMP, breakdown products | Signal transduction, secondary messengers | UPLC-FLR, LC-MS/MS |
| Cytokines / Chemokines | IL-6, TNF-α, CXCL10, IFN-γ | Soluble receptor fragments (e.g., sTNFR1), cleaved fragments | Immune cell communication, inflammation | Luminex xMAP, ELISA |
| Reactive Carbonyls / RONS By-Products | 4-HNE, MDA, acrolein | 4-HNE-GSH, MDA-Lys adducts | Oxidative stress, lipid peroxidation | LC-MS/MS, UPLC-UV |
Advantages of Signaling Molecule Assay
- Ultra-High Sensitivity: Detect metabolites at ≤ 1 pg/mL, capturing low-abundance signaling events.
- Wide Dynamic Range: Quantify across 4–5 orders of magnitude, ensuring accuracy in diverse biological contexts.
- Multiplex Analysis: Measure up to 500 targets in a single run, conserving sample volume and resources.
- High Precision: Achieve < 10% intra-assay CV and < 15% inter-assay CV for robust reproducibility.
- Minimal Sample Volume: Require only 25–50 μL of biofluid or small tissue inputs.
- Accurate Recovery: Deliver 80–120% recovery validated with isotopic standards.
- Comprehensive Coverage: Profile > 150 lipid mediators, cytokines, sphingolipids, and reactive carbonyls.
- Structural Resolution: Attain ≤ 2 ppm mass accuracy for confident metabolite identification.
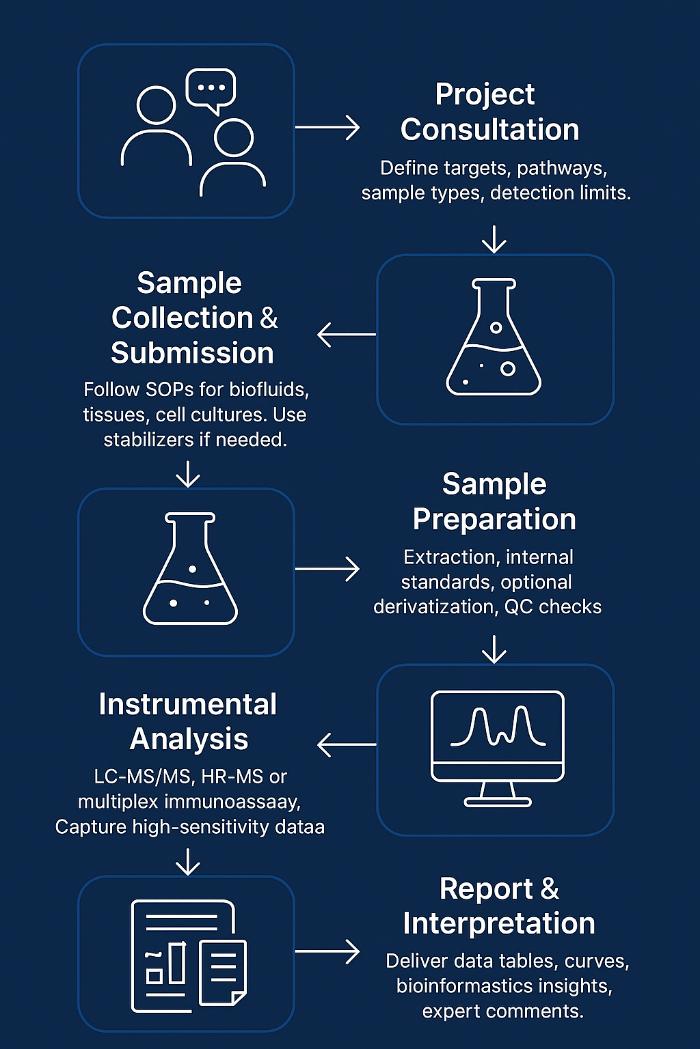
Workflow for Signaling Molecule Analysis Service
1. Project Consultation & Design
Define targets, analytes, sample types, required sensitivity. Select LC-MS/MS, HR-MS, or immunoassay platforms.
2. Sample Collection & Submission
Provide SOPs for biofluids, tissues, cell cultures. Advise on stabilizers for labile metabolites.
3. Sample Preparation & Extraction
Perform solid-phase or liquid-liquid extraction. Add isotopic standards for accuracy. Apply derivatization if needed. Ensure recovery 80–120%.
4. Instrumental Analysis
- Targeted LC-MS/MS (Agilent 6495C, SCIEX 7500).
- Untargeted HR-MS (Orbitrap Exploris 240).
- Key specs:
- LOD ≤ 1 pg/mL
- Dynamic range ≥ 10³–10⁴
- Fast polarity switching
5. Data Processing & QC
- Integrate peaks, apply calibration curves.
- Assess precision, recovery, S/N.
- Identify unknowns via spectral libraries.
6. Reporting & Interpretation
- Deliver raw data, quant results, QC reports.
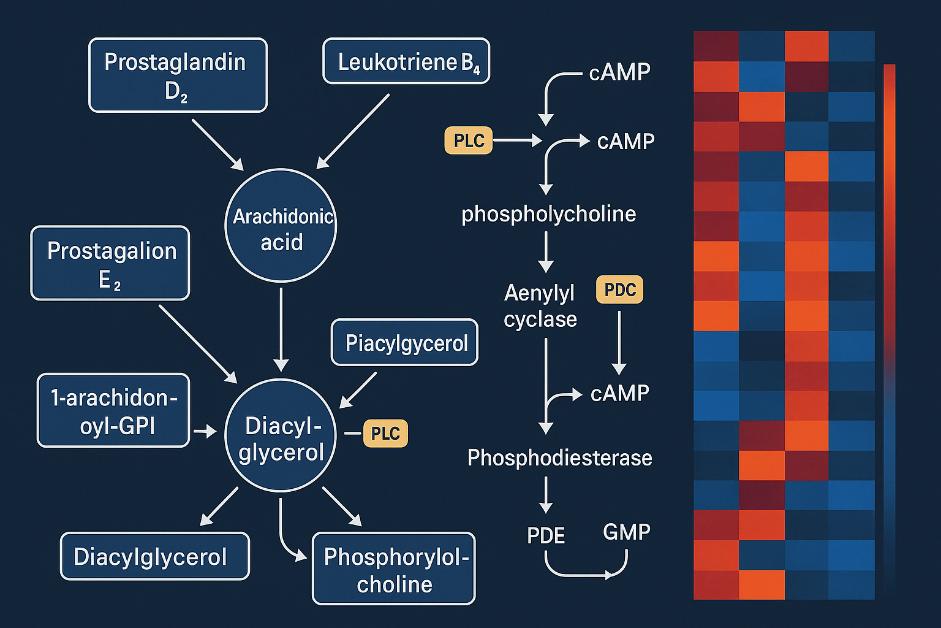
- Offer bioinformatics insights: Pathway analysis; Heatmaps, multi-omics
- Provide expert interpretation.
Technology Platform for Signaling Molecule Analysis Service
| Platform (Model) | Mode / Detector | Core Parameters | Typical Use |
|---|---|---|---|
| Thermo Orbitrap Exploris™ 240 HR-MS | Full-scan + dd-MS² | Resolving power 240k FWHM @ m/z 200; mass accuracy ≤ 2 ppm | Untargeted discovery of novel signaling metabolites and structural elucidation |
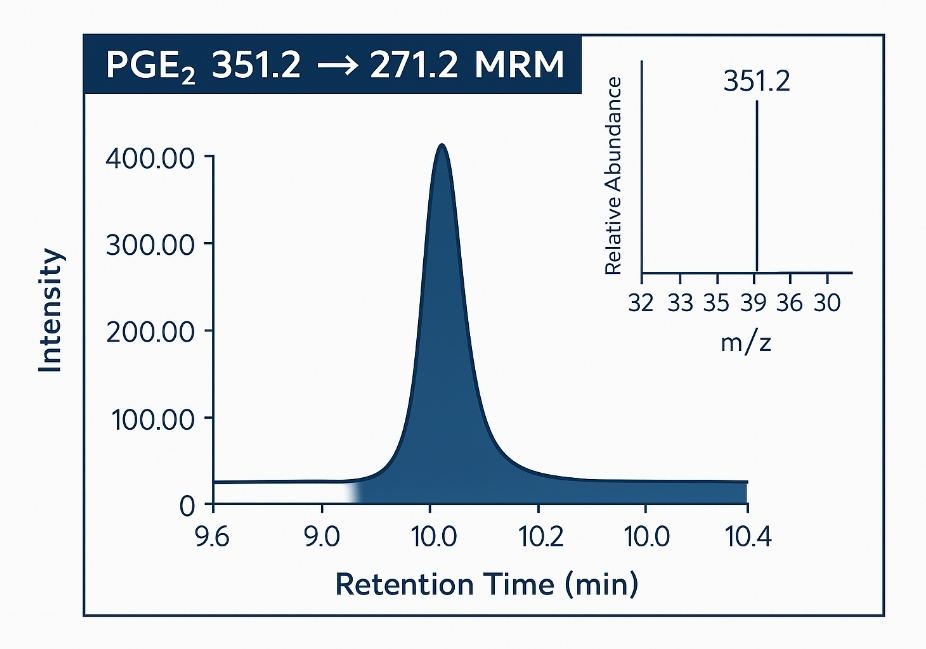
| Agilent 6495C Triple Quadrupole LC-MS/MS | MRM, positive/negative ESI | LOD at sub-pg mL⁻¹ levels; fast polarity switching; R² ≥ 0.995 | Quantitative analysis of eicosanoids, SPMs, sphingolipids, and other signaling metabolites |
| UPLC-FLR (Waters λ_ex 280 nm / λ_em 320 nm) | Fluorescence derivatization | Sensitivity ≤ 50 fmol on-column; run time 6 min | Low-volume, high-sensitivity quantification of cyclic nucleotides such as cAMP and cGMP |
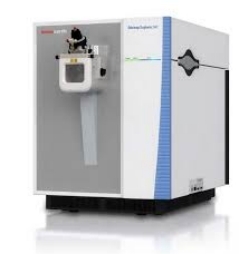
Orbitrap Exploris™ 240 HR-MS (Figure from Thermo)
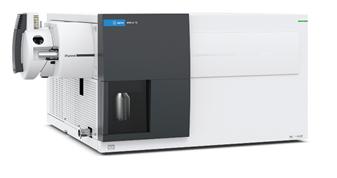
Agilent 6495C Triple Quadrupole (Figure from Agilent)
Sample Requirements for Signaling Molecule Analysis Service
| Sample Type | Minimum Amount Needed | Container & Notes |
|---|---|---|
| Serum / Plasma | ≥ 200 µL | EDTA or heparin tubes; ship on dry ice |
| Whole Blood | ≥ 300 µL | EDTA tube; keep refrigerated or frozen |
| Plant Oils / Edible Oils | ≥ 100 mg | Amber glass vial to prevent oxidation |
| Animal or Plant Tissue | ≥ 50 mg | Snap‑frozen in liquid N₂; delivered on dry ice |
| Feed / Food Products | ≥ 1 g | Vacuum‑sealed bag or sterile container |
| Cosmetic Formulations | ≥ 200 mg | Clean, airtight jar; avoid light/heat |
| Microbial Culture Broth | ≥ 10 mL | Sterile tube; cool pack transport |
| Cell Pellets (Mammalian) | ≥ 1 × 10⁶ cells | Frozen pellet in cryovial |
| Plant Seeds or Grains | ≥ 1 g | Dry, sealed pouch; room‑temperature okay |
Demo Results
FAQ of Signaling Molecule Analysis Service
Can you analyze signaling molecules in rare or unconventional sample types (e.g., exosomes, organoids, plant extracts)?
Yes. We routinely customize extraction and detection methods for unique matrices such as exosomal fractions, 3D organoid cultures, plant extracts, or fermentation broths. Please discuss your specific sample type with our team.
How do you ensure analyte stability during storage and shipping?
Many signaling metabolites are labile. We provide detailed SOPs recommending stabilizers, antioxidants, or specific storage temperatures (e.g., snap-freezing in liquid nitrogen) to preserve analyte integrity from collection to analysis.
Do you provide method validation reports for regulatory or publication purposes?
Yes. Upon request, we deliver comprehensive validation reports including calibration curve data, recovery studies, precision metrics, and limits of detection, suitable for regulatory submissions or journal publications.
Can you help interpret biological relevance from the metabolite data?
Absolutely. Our scientific team provides interpretation linking detected metabolites to known signaling pathways, biological functions, and potential implications for your research objectives. We can also assist with pathway analysis and data visualization.
Is isotopic labeling used for all analytes?
Wherever possible, we employ isotopically labeled internal standards to improve quantitation accuracy and correct for matrix effects. For compounds lacking commercial standards, we use surrogate approaches validated for comparable physicochemical properties.
Can your assays distinguish isobaric or isomeric species?
Yes. Using high-resolution MS and optimized chromatographic methods, we resolve isobaric and structural isomers such as prostaglandin E₂ vs. prostaglandin D₂ or sphingolipid species with identical masses but differing chain lengths.
What is the typical minimum concentration change detectable in comparative studies?
Depending on the analyte class, we typically detect fold changes as low as 1.2–1.5×, making our assays highly sensitive for subtle biological differences in comparative experiments.
Do you offer assistance with experimental design or biomarker selection?
Yes. We advise on panel selection, sample requirements, and study design to maximize the relevance and statistical power of your analysis, especially in complex multi-group studies.
Learn about other Q&A about proteomics technology.
Publications
Here are some of the metabolomics-related papers published by our clients:

- A human iPSC-derived hepatocyte screen identifies compounds that inhibit production of Apolipoprotein B. 2023. https://doi.org/10.1038/s42003-023-04739-9
- The activity of the aryl hydrocarbon receptor in T cells tunes the gut microenvironment to sustain autoimmunity and neuroinflammation. 2023. https://doi.org/10.1371/journal.pbio.3002000
- Lipid droplet-associated lncRNA LIPTER preserves cardiac lipid metabolism. 2023. https://doi.org/10.1038/s41556-023-01162-4
- Inflammation primes the kidney for recovery by activating AZIN1 A-to-I editing. 2023. https://doi.org/10.1101/2023.11.09.566426
- Anti-inflammatory activity of black soldier fly oil associated with modulation of TLR signaling: A metabolomic approach. 2023. https://doi.org/10.3390/ijms241310634
- Plant Growth Promotion, Phytohormone Production and Genomics of the Rhizosphere-Associated Microalga, Micractinium rhizosphaerae sp. 2023. https://doi.org/10.3390/plants12030651
