Peptidoglycan Structure Analysis Service
Resolve Peptidoglycan Complexity with Quantitative Clarity
Unclear how your strain remodels its cell wall?
Can't distinguish 3-3 vs 4-3 cross-links, or trust cross-condition PG comparisons?
We deliver isomer-resolved, quantitative peptidoglycan profiling—so you can stop guessing and start making confident research decisions.
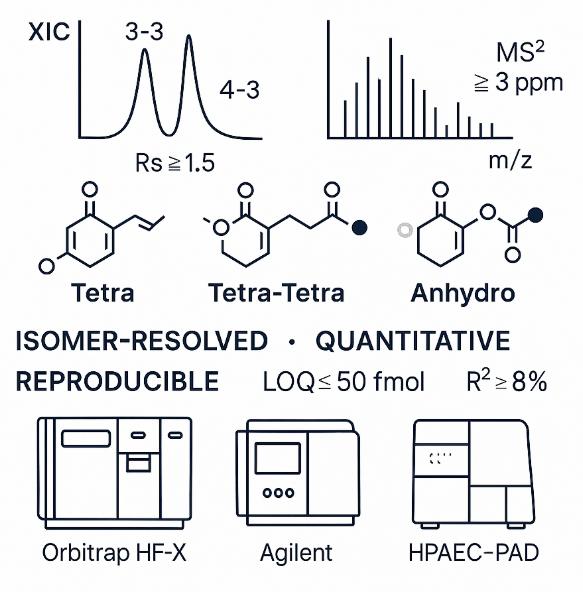
- LC–MS/MS with baseline isomer separation (Rs ≥ 1.5, ≤ 3 ppm mass error)
- MRM/PRM quantification with R² ≥ 0.995, CV ≤ 8%
- Low-input compatible (≥50 mg pellet or 0.5 mg sacculi)
- Structural metrics delivered: cross-linking index, glycan chain length, modification ratios
Submit Your Request Now
×
What You Will Receive
- Raw Data Files: .raw / .wiff + converted mzML files
- Quantified Muropeptide Table: Monomers, dimers, trimers with absolute/relative values
- Calculated Metrics: Cross-linking index, chain length, anhydro %, acetylation %
- Annotated Visuals: XICs, MS² spectra, volcano plots, heatmaps
- Full QC Summary: Mass accuracy, RT stability, blank/carryover check
- Interpretive Report: Condition comparisons, mechanistic insights, exportable figures
- What We Provide
- Advantages
- Technology Platform
- Sample Requirement
- Demo
- FAQs
Why Analyze Peptidoglycan Structure?
Cholesteryl esters are neutral lipids formed by the esterification of cholesterol with fatty acids. Stored primarily in lipid droplets and lipoproteins, they represent a major reservoir of both cholesterol and fatty acid chains, linking lipid storage with metabolic regulation. Their molecular composition—defined by fatty acid chain length and saturation—responds dynamically to enzymatic activity (such as ACAT1/ACAT2) and shifts in cellular state.
Profiling cholesteryl esters provides actionable insights into:
- Cholesterol metabolism and fatty acid utilization under different conditions
- Lipid droplet dynamics during cell culture, stress response, or nutrient shifts
- Lipid formulation stability and oxidative degradation
- Quality control in biological samples with lipid-rich content
Because they reflect both sterol and fatty acid pathways, cholesteryl esters serve as sensitive indicators of lipid remodeling, energy balance, and biochemical adaptation.
What Problems We Solve for Our Clients
We ensure baseline chromatographic resolution (Rs ≥ 1.5) and confirm linkage types with MS² fragmentation.
Our workflow preserves labile features such as O-acetylation, N-deacetylation, and anhydro forms through optimized digestion and reduction protocols.
We apply validated MRM/PRM methods with multi-level calibration (R² ≥ 0.995), internal standard correction, and QC bracketing (CV ≤ 8%). |
With LOQ sensitivity down to 50 fmol, our platform supports low-input, high-complexity samples without compromising accuracy.
We deliver interpretable metrics such as cross-linking index, chain-length distribution, and modification ratios to support functional conclusions.
Optional HPAEC–PAD, MALDI–TOF, and NMR validation is available to support high-confidence or publication-ready results. |
What We Offer: Comprehensive Peptidoglycan Analysis Services at Creative Proteomics
- Muropeptide cataloging & quantification: monomers, dimers, trimers; 4-3 vs 3-3 cross-links; anhydro-termini
- Cross-linking index & chain-length distribution: % cross-linked, average glycan length, end-cap frequency
- Stem variations & edits: amidation states (D-isoGln vs D-Gln), D-Ala/D-Lac substitutions, Lys vs meso-DAP content
- Glycan modifications: O-acetylation, N-deacetylation, MurNAc/GlcNAc ratios
- Turnover & flux (optional): stable-isotope tracing (e.g., 13C/15N feeding) to quantify synthesis vs recycling
- Comparative profiling: condition, strain, and time-course differentials with statistical contrasts
- Orthogonal confirmation (as needed): MS/MS ion-series evidence, targeted MRM verification, optional NMR for ambiguous calls
Peptidoglycan Structure Analysis — Detectable Targets
| Structural Feature | Detectable Compounds / Moieties (examples) | Typical Readouts | Analytical Approach |
|---|---|---|---|
| Disaccharide backbone | MurNAc, GlcNAc, anhydro-MurNAc | Disaccharide content (mol%), anhydro termini (%) | UPLC-HILIC–MS/MS; UV 205 nm |
| Stem peptide composition | L-Ala, D-iGlu/iGln, meso-DAP or L-Lys, D-Ala-D-Ala | Stem variants (mol%), D-Ala loss | UPLC-C18–MS/MS (MRM/PRM) |
| Cross-linking architecture | 4–3 and 3–3 cross-linked dimers/trimers | Crosslink index (%), mono/di/tri ratios | UPLC-MS muropeptide mapping |
| Modifications | O-acetyl-MurNAc, N-deacetylated GlcN, amidated DAP | Modification frequency (%) | Targeted MS/MS |
| Bridge peptides (Gram-positive) | Gly interpeptide (e.g., pentaglycine) | Average bridge length | LC-MS/MS |
| Turnover markers | anhydro-MurNAc-peptides | Turnover index | LC-MS/MS with internal standards |
| Global muropeptide map | Monomer/dimer/trimer libraries | Annotated species count | LC-HRMS, spectral library matching |
Advantages of Our Peptidoglycan Structure Analysis Services
- Isomer resolution where it counts: chromatographic resolution Rs ≥ 1.5 for critical muropeptide isomer pairs (e.g., 3-3 vs 4-3 dimers), ensuring confident assignment without over-deconvolution.
- High mass accuracy & depth: Orbitrap/QTOF platforms delivering ≤ 3 ppm precursor accuracy and top-20 DDA MS² per cycle; dynamic range ≥ 10^4 for muropeptides spanning orders of magnitude.
- Quantitative rigor: method linearity R² ≥ 0.995 across ≥ 4 calibration levels; repeatability CV ≤ 8% (intra-batch) and ≤ 12% (inter-batch) for representative targets; ID criteria require RT match ±0.1 min, accurate mass, and diagnostic fragment ions (e.g., HexNAc oxonium 204.0867 m/z).
- Low limits with small inputs: on-column LOQ ≤ 50 fmol for abundant muropeptides and ≤ 200 fmol for modified species, enabling analysis from modest biomass.
- Traceable, audit-friendly outputs: explicit calculation formulas for cross-linking %, chain-length, and modification indices; full QC summaries (RT drift, mass error, carryover, blanks).
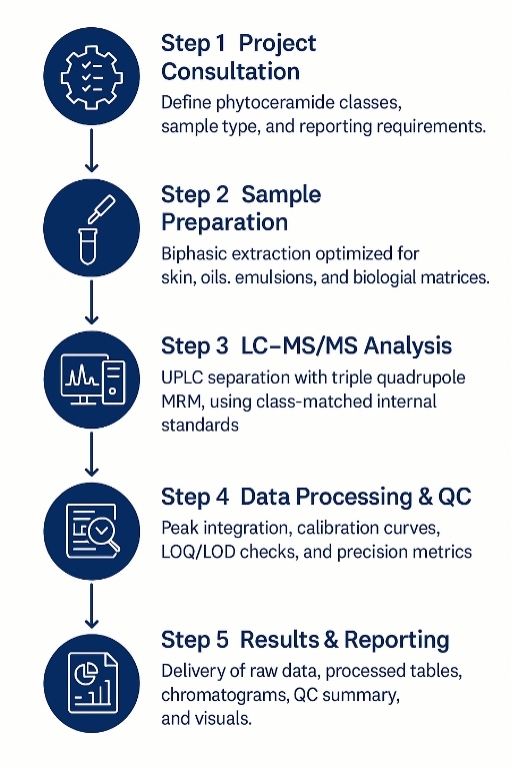
Workflow for Peptidoglycan Structure Analysis Service
1. Consultation & Panel Design – Define organism(s), anticipated PG features (Gram type, meso-DAP vs Lys), and decision-driven metrics (cross-linking %, O-acetylation, chain length).
2. Sample Intake QC – Biomass check, pH/conductivity, interfering excipients scan; spike-in of class-matched internal standards where available.
3. PG Extraction / Sacculi Preparation – If requested: SDS-boiled sacculi isolation; otherwise, proceed from pellets (see Sample Requirements).
4. Enzymatic Muropeptide Release – Controlled digestion (mutanolysin/cellosyl), NaBH₄ reduction to stabilize reducing ends; desalting.
5. Primary Analysis – UHPLC–HRMS/MS discovery run with DDA; library/knowledge-base matching by accurate mass + RT + MS².
6. Targeted Quantification – LC–MRM method aligned to discovery hits; multi-level calibration; bracketed QCs and system suitability tests.
7. Orthogonal Checks (as needed) – CE-LIF patterns, HPAEC-PAD monosaccharide ratios, MALDI fingerprints, or NMR spot checks.
8. Computational Readouts – Calculation of cross-linking index, glycan chain-length distribution, anhydro-MurNAc%, O-acetylation%, and 3-3/4-3 cross-link ratios with confidence intervals.
Technology Platform for Peptidoglycan Structure Analysis Service
At Creative Proteomics, we use a focused set of validated, high-resolution analytical techniques to resolve structural complexity in peptidoglycan. Each method serves a specific purpose—from discovery to quantification to orthogonal validation.
UHPLC–HRMS/MS (Discovery & Structural Assignment)
Purpose: Identify and characterize muropeptides, including cross-link types, glycan modifications, and terminal structures.
System: Thermo Orbitrap Exploris 240 or Q Exactive HF-X
Performance:
- Mass accuracy ≤ 3 ppm
- Resolution ≥ 60,000
- Isomer separation: Rs ≥ 1.5
- DDA MS/MS with diagnostic fragment ions
HPAEC–PAD (Sugar Composition Confirmation)
Purpose: Quantify GlcNAc, MurNAc, and related sugars as orthogonal confirmation.
System: Thermo ICS-6000
Sensitivity: LOQ ≤ 50 nM for target sugars
LC–MRM / PRM (Targeted Quantification)
Purpose: Quantify muropeptides and track structural changes across samples.
Systems:
MRM: Agilent 6495C
PRM: Thermo Orbitrap with scheduled MS² acquisition
Validation:
R² ≥ 0.995
LOQ ≤ 0.5 ng/mL
CV ≤ 8% (intra-batch)
MALDI–TOF MS (Fingerprinting & Batch Comparison)
Purpose: Rapid comparison of muropeptide profiles across strains or time points.
System: Bruker ultrafleXtreme
Use: Quick spectral fingerprints; isotopic mass cluster assignment
Agilent 6495C Triple Quadrupole (Figure from Agilent)
Q Exactive™ HF-X (Figure from Thermo)
ICS-6000 (Figure from Thermo)
Sample Requirements for Peptidoglycan Structure Analysis Service
| Item | Preferred Material | Minimum Quantity | Container | Preservation | Shipping | Notes |
|---|---|---|---|---|---|---|
| Bacterial cell pellet | Mid-log pellets (Gram+/Gram−) | ≥ 50 mg wet or OD₆₀₀·mL ≥ 50 | 1.5–2.0 mL screw-cap, O-ring | Remove media; wash 1× cold PBS; snap-freeze | Dry ice | Avoid lysozyme or PG-active additives prior to harvest |
| Purified sacculi | SDS-boiled sacculi, washed to neutrality | ≥ 0.5 mg dry | Low-protein-bind tube | Store −20 °C dry | Dry ice | Provide SDS concentration used and wash protocol |
| Lyophilized cell material | Freeze-dried biomass | ≥ 10 mg | Cryovial | Desiccated | Dry ice | Note any buffers/sugars used pre-lyo |
| Isotope-labeled samples (optional) | 13C/15N fed cultures | As above | As above | As above | Dry ice | Provide label scheme and feeding duration |
General restrictions: avoid chaotropes (urea/guanidine) and detergents in pellets; for sacculi, residual SDS is acceptable if documented. Confirm applicable biosafety inactivation prior to shipment.
Demo Results
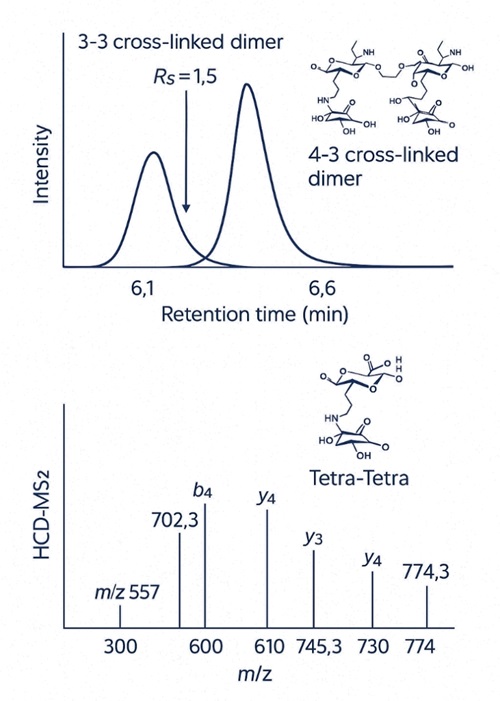
Extracted ion chromatogram showing baseline separation of 3-3 and 4-3 cross-linked muropeptides (Rs = 1.5), with corresponding HCD-MS² spectrum of a Tetra-Tetra dimer confirming structural identity via key fragment ions.
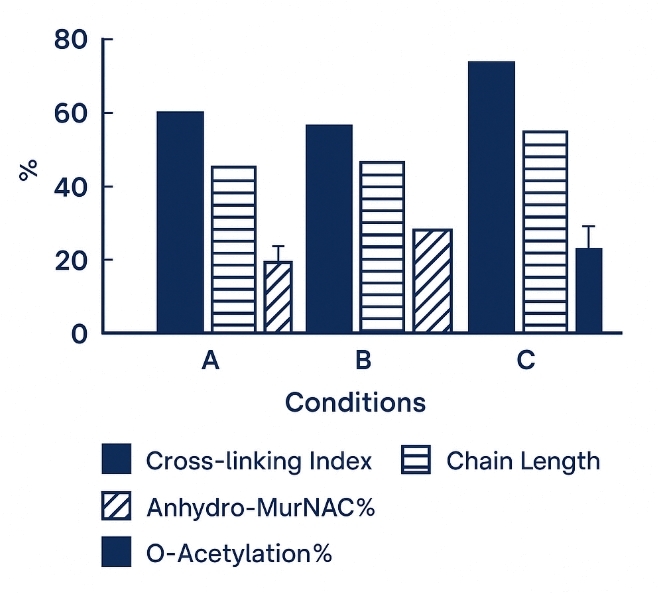
Bar graph comparing cross-linking index, glycan chain length, anhydro-MurNAc%, and O-acetylation% across three experimental conditions (A, B, C), highlighting structural remodeling trends.
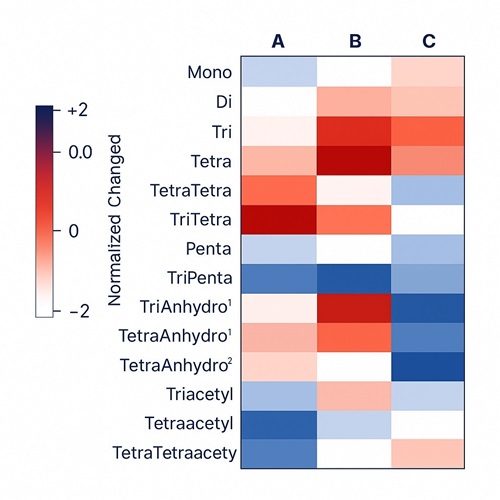
Heatmap showing normalized changes in muropeptide abundance across sample groups A, B, and C. Color gradient reflects fold change (−2 to +2), highlighting differential structural composition.
FAQ of Peptidoglycan Structure Analysis Service
How can I ensure that 3-3 and 4-3 cross-links are accurately distinguished?
We use high-resolution Orbitrap-based UHPLC–MS with baseline chromatographic separation (Rs ≥ 1.5) and MS² fragments specific to linkage types. Isomer co-elution and misidentification are minimized through retention time libraries and MRM/PRM verification.
Can I compare peptidoglycan composition between wild-type and mutant strains?
Yes. Our workflow supports statistically robust comparison across strains, conditions, or treatment groups, using normalized structural metrics such as cross-linking index, glycan chain length, and modification ratios.
What is the minimum biomass required for analysis?
We typically work with low-input samples (e.g., ~50 mg wet pellet), thanks to LOQ-level sensitivity on both Orbitrap and triple quadrupole systems. Sacculi or lyophilized material can also be accommodated with validated recovery protocols.
Do I need to isolate sacculi, or can I send cell pellets?
Either is acceptable. If you have purified sacculi, we can proceed directly; otherwise, we extract and digest from cell pellets under tightly controlled lysis and stabilization conditions.
How is quantitative accuracy ensured across different batches?
All quantification is based on system suitability tests, bracketed QCs, multi-point calibration (R² ≥ 0.995), and internal standard normalization. CV thresholds are applied for batch comparability, and blank/background drift is documented.
Is it possible to identify unusual PG features or non-canonical stems?
Yes. Our database includes rare variants (e.g., Lys-type, D-Ala-D-Lac replacements, amidation states), and MS² spectra are interpreted against curated enzyme-specific modifications. We can flag and quantify non-standard muropeptides with high confidence.
Can your analysis distinguish between new PG synthesis and turnover?
If stable-isotope labeling is used (e.g., 13C/15N feeding), we can quantify labeled vs unlabeled muropeptides over time to model flux. This is particularly useful in biosynthesis studies or antibiotic mode-of-action profiling.
What kind of outputs will I receive for downstream use?
You will receive fully annotated quantitative tables, QC summaries, extracted chromatograms, MS² fragment maps, and publication-ready plots. All results are exportable (.csv/.xlsx) and accompanied by optional raw files.
What's the best way to handle PG samples before submission?
Avoid detergents, chaotropes, or enzymes that may degrade PG (e.g., lysozyme). Wash cells in cold PBS, snap-freeze, and ship on dry ice. For sacculi, ensure SDS removal and neutralization prior to freezing.
How do I know if my modifications (e.g., O-acetylation) are stable during processing?
We implement controlled pH, low-temperature handling, and NaBH₄ reduction to minimize loss of labile features. If needed, we can perform orthogonal confirmation by NMR or CE-LIF to verify their presence.
Can I re-analyze archived peptidoglycan samples stored from previous studies?
In most cases, yes. Provided they were stored at −20°C or below without exposure to strong acids or detergents, retrospective analysis is possible, including re-quantification or targeted verification of specific features.
What enzymes or inhibitors can I test for their effect on PG structure?
Our platform is frequently used to profile changes induced by PBPs, L,D-transpeptidases, amidases, and O-acetyltransferases, as well as antimicrobial agents that disrupt synthesis pathways. Enzyme activity can be inferred through structural shift patterns.
Can I integrate this with my existing omics or phenotypic data?
Yes. All outputs are compatible with multi-omics integration. We can annotate results with KEGG/MetaCyc PG biosynthesis modules or export structural metrics for pathway mapping or machine learning applications.
Learn about other Q&A about proteomics technology.
Publications
Here are some publications in Glycomics research from our clients:

- Modulation of the Endomembrane System by the Anticancer Natural Product Superstolide/ZJ-101. 2023. https://doi.org/10.3390/ijms24119575
- Identification of the O-Glycan Epitope Targeted by the Anti-Human Carcinoma Monoclonal Antibody (mAb) NEO-201. 2022. https://doi.org/10.3390/cancers14204999
- Alternative glycosylation controls endoplasmic reticulum dynamics and tubular extension in mammalian cells. 2021. https://doi.org/10.1126/sciadv.abe8349
- Conformational differences between functional human immunodeficiency virus envelope glycoprotein trimers and stabilized soluble trimers. 2019. https://doi.org/10.1128/jvi.01709-18