Precision Quantitative Proteomics Services for Discovery & Translation
Creative Proteomics offers a robust portfolio of quantitative proteomics solutions (RUO), powered by standardized LC–MS/MS workflows and traceable reporting. We specialize in transforming complex biological samples into reproducible datasets for discovery, verification, and high-throughput translational research.
Cutting-Edge Quantification Technologies
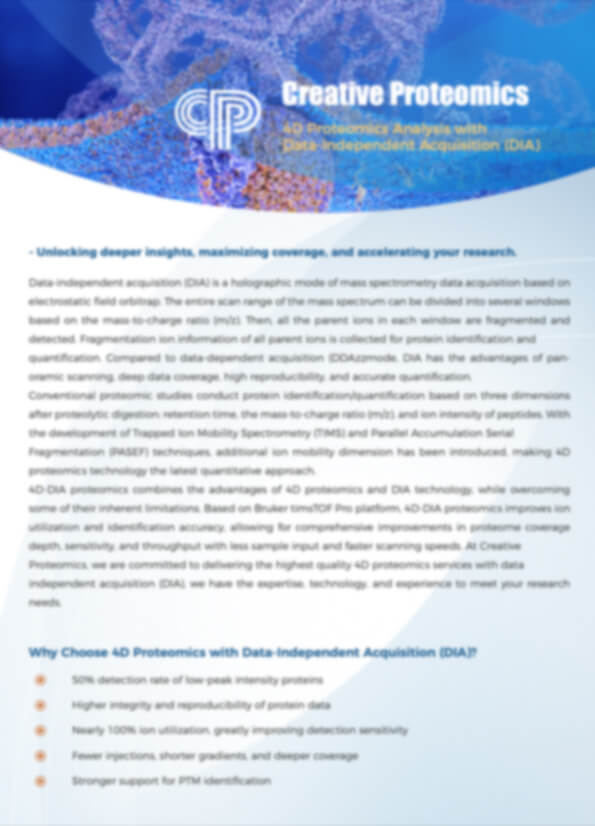
To support cohort-scale studies where data completeness is paramount, we provide industry-leading 4D-DIA (dia-PASEF®) and DIA platforms, ensuring unrivaled sensitivity and throughput.
- Discovery Proteomics (Untargeted):
- Label-based: TMT (up to 18-plex), iTRAQ, and SILAC for precise relative quantification.
- Label-free: LFQ and DIA (Data-Independent Acquisition) for deep proteome coverage.
- 4D-Technology: 4D-DIA leveraging TIMS/CCS for increased dynamic range.
- Targeted Proteomics (Verification):
- Absolute Quantification: AQUA, PRM (Parallel Reaction Monitoring).
- Gold Standard: SRM/MRM for validated biomarker screening.
- Customized Services: Semi-quantitative analysis tailored to specific project requirements.
Submit Your Request Now
×
- Quantitative Strategies
- Service
- Data Analysis
- Advantages
- Platform
- Application
- Delivery
- Sample Requirement
- FAQ
- Demo
- Case Study
- Publication
Why MS-Based Protein Quantification?
Thanks to the enhanced sensitivity, resolution, and mass accuracy of MS, along with innovations in high-performance liquid chromatography (HPLC), computational power, and software development, researchers can now achieve precise quantification of individual proteins and entire proteomes.
MS-based quantification enables highly accurate and reproducible analysis of protein abundance and post-translational modifications (PTMs) across different biological conditions (e.g., healthy vs. diseased states). These insights help:
- Decipher molecular interactions and signaling pathways
- Identify disease mechanisms at the phenotypic level
- Discover biomarkers for improved diagnostics, prognosis, and therapeutic interventions
Consequently, quantitative proteomics has become an integral part of modern biological and pharmaceutical research.
Our Advanced Protein Quantification Services
With extensive experience in proteomics research, Creative Proteomics offers a range of cutting-edge quantitative proteomics solutions, including:
1) iTRAQ proteomics analysis service
2) TMT proteomics analysis service
3) SILAC proteomics analysis service
4) Absolute quantification (AQUA) service
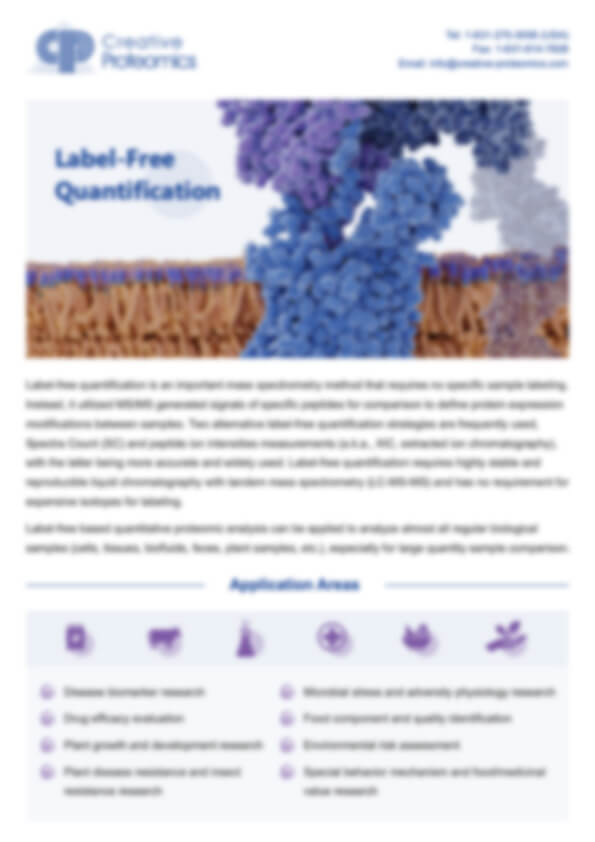
5) Label-free quantification service
6) Semi-quantitative proteomics analysis service
7) Parallel Reaction Monitoring (PRM)
8) SRM&MRM
9) DIA Quantitative Proteomics Service
10) 4D-DIA Quantitative Proteomics Service
Key Quantitative Proteomics Strategies
Proteomics studies employ various quantification techniques based on study objectives. The two main approaches are:
1. Global (Unbiased) Proteome Quantification – Enables large-scale protein profiling, identifying thousands of proteins for comparative analysis.
2. Targeted Proteome Quantification – Focuses on a select group of proteins, providing precise measurement of their abundance.
Depending on the quantification method, workflows can be categorized as:
- Label-Based Quantification: Uses stable isotope labels within peptides/proteins for precise measurement.
- Label-Free Quantification: Retains native isotope composition, offering a cost-effective and flexible alternative.
MS-based quantification is further divided into:
- Relative Quantification – Compares protein levels across different samples.
- Absolute Quantification – Measures the exact concentration of proteins using known standards.
Additionally, untargeted proteomics experiments utilize data acquisition modes such as:
- Data-Dependent Acquisition (DDA) – Captures MS/MS spectra based on precursor ion selection.
- Data-Independent Acquisition (DIA) – Systematically fragments and analyzes all detected peptides, increasing reproducibility.
Comparison of Major Quantitative Proteomics Techniques
| Method | Description | Multiplexing Capability | Advantages | Limitations |
|---|---|---|---|---|
| ICAT | Cysteine-specific chemical labeling | 2-plex | Reduces sample complexity; suitable for various sample types | Requires cysteine-containing proteins; limited multiplexing |
| iTRAQ | Amine-specific isobaric labeling | Up to 8-plex | High multiplexing capability; enhanced MS signal | Expensive; unsuitable for in vivo labeling |
| TMT | Amine-specific isobaric labeling | Up to 18-plex | High sensitivity; commercial availability | Expensive; requires specific fragmentation methods |
| SILAC | Metabolic labeling with stable isotopes | Up to 5-plex | High accuracy; suitable for cellular studies | Costly; limited to metabolically active cells |
| 15N Labeling | Metabolic labeling using 15N-enriched media | 2-plex | Suitable for cells and model organisms | Expensive; complex data analysis |
| 18O Labeling | Enzymatic labeling with 18O-labeled water | 2-plex | Cost-effective; simple handling | Incomplete labeling affects accuracy |
| Spectral Counting | Relative quantification via peptide spectra | Unlimited | No labeling required; cost-effective | Requires large sample sizes; lower accuracy |
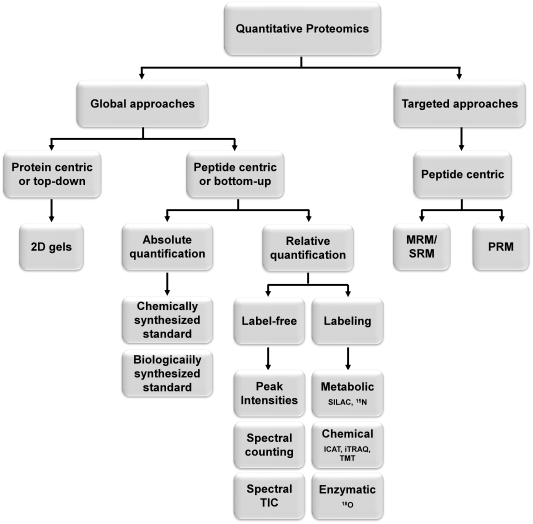 Figure 1. Categorization of the main strategies for quantitative proteomics.
Choosing the Right Protein Quantification Method
When selecting a MS-based protein quantification strategy, researchers commonly use three high-throughput approaches: TMT, LFQ, and DIA.
Each method offers advantages depending on sample type, study scale, and budget. While they can theoretically replace one another, DIA quantification has emerged as a highly versatile option. It achieves quantification performance comparable to or exceeding TMT, requires less protein per sample, and—unlike TMT—has no restrictions on sample number. These features make DIA particularly well-suited for large-cohort clinical studies.
Selecting the Optimal Strategy
To determine the most suitable approach, consider factors such as:
- Sample Type – Does the study involve complex biological samples or purified proteins?
- Sample Size – Are there limitations on the number of available samples?
- Budget – Are cost and reagent availability constraints?
For targeted quantification, highly reproducible MS techniques such as Selected Reaction Monitoring (SRM), Multiple Reaction Monitoring (MRM), and Parallel Reaction Monitoring (PRM) allow precise measurement of specific proteins, especially when using isotope-labeled internal standards.
Comprehensive Workflow for Proteomic Data Analysis
Effective proteomic analysis requires a structured workflow to ensure high-quality quantitative and qualitative results. Our approach includes data preprocessing, expression level analysis, and functional annotation, enabling researchers to extract meaningful insights from complex datasets.
Step 1: Data Quality Assessment & Preprocessing
Step 2: Protein Expression & Functional Annotation
Step 3: In-Depth Bioinformatics Analysis
Step 4: Data Visualization & Interpretation
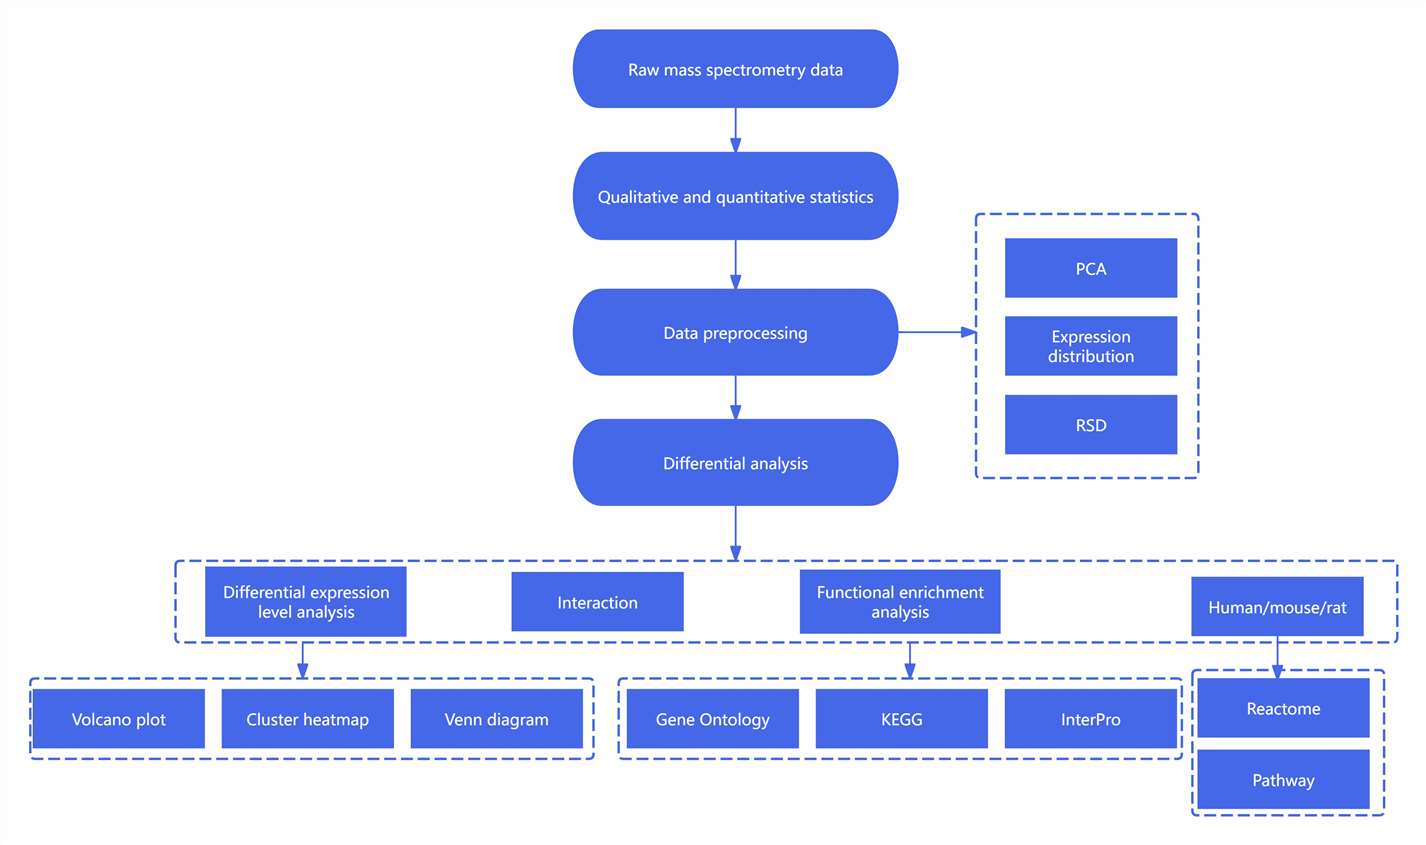
With these insights, researchers can prioritize key proteins and pathways for further validation and experimental follow-up, accelerating discovery in biomarker identification and disease mechanism studies.
Key Advantages of Our Quantitative Proteomics Services
1. High-Throughput & Ultra-Sensitive Detection
- Enables large-scale sample analysis with no restrictions on sample quantity.
- Industry-leading sensitivity ensures reliable detection of low-abundance proteins.
2. Precise Quantification with High Reproducibility
- Utilizes high-resolution mass spectrometry and intelligent algorithms (e.g., Match Between Runs (MBR)) for accurate protein quantification.
- Parent-fragment ion quantification strategies enhance data reliability.
3. Flexible Sample Handling
- Compatible with a variety of sample types, including cells, tissues, and biofluids.
- Supports both labeled and label-free quantification techniques while maintaining high fidelity and efficiency.
4. Complete Data Traceability
- Full-spectrum acquisition preserves comprehensive protein information.
- Electronic data storage enables long-term traceability and in-depth analysis.
5. Cutting-Edge Technology Integration
- Seamless adaptation of major quantification strategies, including TMT, DIA, and Label-Free approaches.
- Incorporates 4D proteomics, DIA-ABPP, and other advanced methodologies for enhanced insights.
6. Multi-Omics Data Integration
- Supports cross-platform analysis by integrating proteomics with metabolomics, glycomics, and transcriptomics.
- Provides a systems-level understanding of biological mechanisms.
Our Proteomics Facility
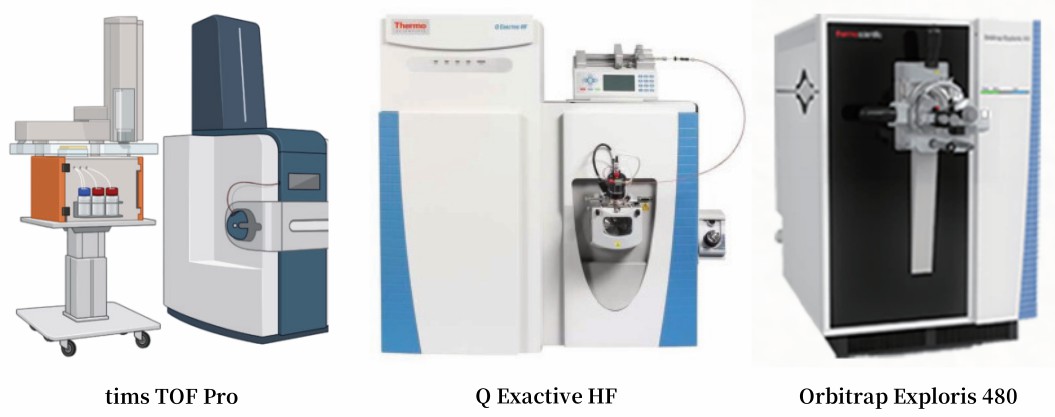
Our proteomics platform is equipped with timsTOF Pro, Q Exactive HF/X, Orbitrap Fusion Lumos, Orbitrap Exploris 480, and TripleTOF 5600 plus, ensuring high-resolution, ultra-sensitive, and high-throughput protein analysis.
Applications of Quantitative Proteomics
Quantitative proteomics enables comparative protein analysis across different experimental groups, helping identify disease-associated proteins, molecular markers, and key signaling pathways.
1. Functional Studies
- Investigate differentially expressed proteins across various tissues and cell types.
- Gain insights into protein functions and their roles in cellular processes and disease mechanisms.
2. Drug Research & Development
- Compare proteomic changes in samples subjected to different drug treatments.
- Analyze how candidate compounds modulate protein expression and biological pathways to evaluate therapeutic efficacy.
3. Disease Mechanism Studies
- Identify protein expression differences between healthy and diseased tissues.
- Uncover molecular mechanisms driving disease progression and potential biomarkers for diagnostics or targeted therapies.
Results Delivery & Post-Service Support
Final Report Delivery
Our comprehensive report includes:
- Protein Identification & Quantification: Precise measurement and classification of target proteins.
- Differential Expression Analysis: Illustrated through volcano plots and heatmaps for easy interpretation.
- Functional Enrichment Insights: GO (Gene Ontology) and KEGG pathway analyses tailored to sample type and technical approach.
Data Reliability Assurance
We ensure data accuracy through rigorous quality control:
- End-to-End QC Measures: Sample integrity is verified via BCA protein quantification and instrument stability checks using Hela control samples.
- Mass Spectrometry Validation: TIC chromatograms are assessed for peak shape, contamination, and background signals to guarantee credible results.
Post-Service Support
We offer extensive after-sales assistance, including:
- Complimentary Data Analysis: GO/KEGG enrichment, GSEA, and WPCNA analysis, along with graphical enhancements.
- Comprehensive Data Support: TIC/XIC chromatogram extraction, secondary spectrum retrieval, and expert guidance on data organization, manuscript preparation, and peer-review responses.
- Flexible Consultation Options: Personalized support via Tencent Meeting for report interpretation, reanalysis requests (database searches, control group adjustments), and more.
Sample Preparation
| Sample Type | Protein Identification | Quantitative Proteomics | Phosphoproteomics |
|---|---|---|---|
| Protein Gel Bands | >100 ng | N/A | N/A |
| Protein Solution | >10 µg | >100 µg | >5 mg |
| Cells | 1×10⁶ cells or >30 µL | 1×10⁷ cells | |
| Animal Tissue | 100 mg (fresh weight) | 500 mg (phosphoproteomics) | |
| Plant Tissue | 200 mg (fresh weight) | 1 g (phosphoproteomics) |
For low-yield samples, consider increasing sample quantity. Contact technical support for special cases.
FAQ
General Principles for Proteomics Sample Preparation
- Ensure the sample is in good condition and meets expected phenotypic or molecular criteria.
- Wear gloves, masks, and hair covers to prevent keratin contamination.
- Keep samples on ice during handling and work quickly to preserve integrity.
- Aliquot samples as needed to prevent repeated freeze-thaw cycles.
- Snap-freeze samples in liquid nitrogen immediately after collection, store at -80°C, and ship on dry ice.
Sample Preparation Protocols
- Gel Bands: Cut protein bands into 1 mm³ pieces using a clean blade. Store in imported EP tubes and ship with ice packs.
- Protein Solution: Measure protein concentration before freezing in liquid nitrogen. Ship on dry ice, specifying buffer composition and concentration. Alternatively, precipitate proteins using TCA or acetone, air-dry, and ship on dry ice or with ice packs.
- Cells, Bacteria, Fungi: Wash three times with pre-chilled PBS to remove culture media residues. Centrifuge, discard supernatant, snap-freeze in liquid nitrogen, and store at -80°C before shipping on dry ice.
- Animal Tissue: Dissect tissue on ice, cut into 0.5 cm³ pieces, wash three times with pre-chilled PBS to remove blood, weigh, snap-freeze, and store at -80°C before shipping on dry ice.
- Plant Tissue: Remove surface contaminants by washing with pre-chilled PBS, weigh, snap-freeze, and store at -80°C before shipping on dry ice.
- Culture Supernatant: Grow cells to the desired density, wash three times with serum-free media, incubate in serum-free media for an appropriate duration, collect supernatant, centrifuge to remove cells, filter with 0.22 µm membrane, snap-freeze, and store at -80°C before shipping on dry ice.
- Blood Samples: Avoid hemolysis. Collect blood using appropriate tubes and prepare serum or plasma via centrifugation. Aliquot as needed, snap-freeze, and store at -80°C before shipping on dry ice.
- IP Samples: IP-MS Sample preparation instructions.
Why is TMT Only Suitable for Relative Quantification?
TMT relies on isotope labels to compare signal intensities between samples. It lacks an absolute quantification internal standard, and differences in peptide mass spectrometry response make it difficult to directly calculate absolute abundance.
What to Do When Sample Amount is Insufficient?
Consider resampling or using high-sensitivity techniques like 4D-Label-free or DIA.
For low-input samples (e.g., biopsy tissues), apply specific enrichment strategies to enhance detection.
Protein Concentration Measurement Methods and Requirements
Use BCA assay (e.g., Dyo reagent kit), requiring a concentration >1μg/μl and a total protein amount >300μg.
For specific samples (e.g., serum), remove high-abundance proteins (e.g., albumin) to improve detection depth.
How to Reduce Keratin Contamination?
Always wear gloves and hair covers to minimize contact with skin debris.
For silver-stained samples, avoid using glutaraldehyde; instead, opt for mass spectrometry-compatible staining reagents.
How to Ensure Data Reliability?
Quality control steps include:
Sample validation via BCA quantification and SDS-PAGE analysis.
Regular calibration of mass spectrometry platforms using HeLa cell quality control samples.
Assessment of peak shapes and background signals through total ion chromatogram (TIC) analysis.
Why Do Different Peptides of the Same Protein Show Quantification Variability?
Possible reasons include:
Uneven enzymatic digestion efficiency.
Variations in peptide ionization efficiency.
Post-translational modifications (e.g., phosphorylation) interfering with quantification.
Sample preparation inconsistencies.
How to Extract Specific Peptide Peak Maps from DIA Data?
Utilize spectral library matching (e.g., Spectronaut or Skyline).
Extract fragment ion signals and generate retention time-intensity curves.
Evaluate data quality based on peak shape characteristics.
What Information is Included in the Final Report?
Core Data:
Protein identification and quantification tables.
Differential analysis results (volcano plots/heatmaps).
Functional enrichment analysis (GO/KEGG).
Protein-protein interaction (PPI) networks.
Supporting Files:
TIC/XIC chromatograms.
MS/MS spectra.
Raw data backup files.
Do You Support Multi-Omics Integration?
Yes, we support the integration of proteomics with metabolomics, transcriptomics, and glycomics. Multi-omics analysis enables systematic biological mechanism interpretation through correlation networks (e.g., gene-protein-metabolite associations).
How Long Can Samples Be Stored?
Fresh samples should be analyzed immediately.
Silver-stained samples can be stored for up to 2 months.
Freeze-dried samples should not be stored for more than 6 months.
Do You Accept Pre-Digested Samples?
No, all samples must undergo a standardized internal digestion process (typically using trypsin) to maintain quality control and ensure data consistency.
Learn about other Q&A.
Demo

Case Study: Client Success Stories
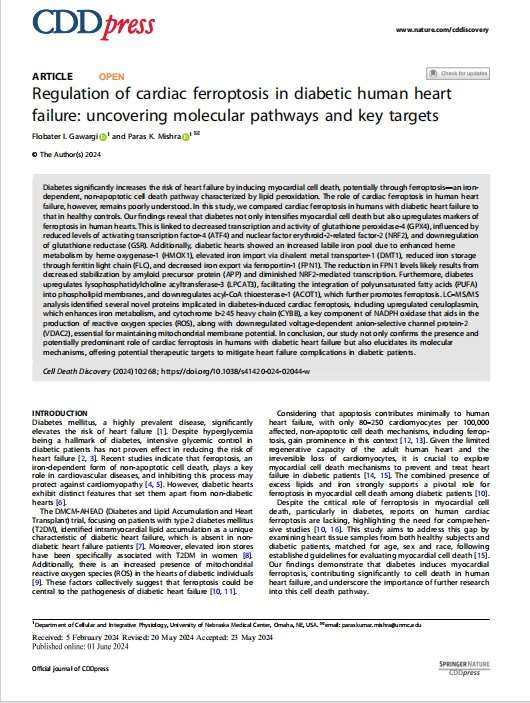
Regulation of cardiac ferroptosis in diabetic human heart failure: uncovering molecular pathways and key targets
doi: 10.1038/s41420-024-02044-w
- Background
- Methods
- Key Findings
- Conclusion
Diabetic heart failure (DHF) is a complex cardiovascular disease driven by metabolic imbalances. Ferroptosis, a regulated form of cell death linked to iron metabolism and oxidative stress, has emerged as a key factor in DHF progression. However, the molecular pathways governing ferroptosis in DHF remain unclear.
This study utilized Tandem Mass Tag (TMT) proteomics, along with metabolomics and transcriptomics, to analyze heart tissue from DHF patients. The goal was to identify key regulatory proteins and potential therapeutic targets. Creative Proteomics' TMT-based quantitative proteomics played a crucial role in uncovering differentially expressed proteins (DEPs), offering high-precision insights into ferroptosis-related mechanisms.
A multi-omics approach was employed, with TMT proteomics as the core protein quantification method.
Sample Preparation & Protein Extraction:
Heart tissue samples were collected from DHF patients and healthy controls.
High-abundance proteins were removed to enhance detection sensitivity.
TMT Labeling & Proteomic Analysis (Creative Proteomics):
TMT reagents were used for multiplexed sample labeling, enabling precise protein quantification.
High-performance liquid chromatography (HPLC) was applied for fractionation, improving protein coverage.
Liquid chromatography-tandem mass spectrometry (LC-MS/MS) was used for in-depth proteomic profiling.
Bioinformatics analysis (GO/KEGG enrichment) identified ferroptosis-related pathways.
Metabolomics & Transcriptomics:
LC-MS metabolomics measured iron-related metabolites and lipid peroxidation markers.
RNA sequencing (RNA-seq) analyzed gene expression patterns, complementing proteomics data.
Integrated Data Analysis:
Correlation analysis between protein, metabolite, and gene expression data helped pinpoint ferroptosis regulators.
Functional validation experiments were conducted to confirm key findings.
By integrating TMT proteomics with other omics technologies, the study mapped a comprehensive ferroptosis regulatory network in DHF. The highlights include:
TMT proteomics identified hundreds of DEPs, many of which were key regulators of oxidative stress, iron metabolism, and mitochondrial dysfunction.
GO/KEGG pathway analysis revealed that these DEPs were enriched in ferroptosis-related signaling pathways, including lipid peroxidation and iron homeostasis.
Combined metabolomics and transcriptomics further validated the involvement of these proteins in DHF progression, identifying novel therapeutic targets.
 Figure 1 Differential Protein Expression Analysis
 Figure 2 Pathway Enrichment Analysis
This study leveraged TMT proteomics, metabolomics, and transcriptomics to decode ferroptosis mechanisms in DHF. Creative Proteomics' TMT proteomics service was instrumental in identifying key protein markers with high accuracy and sensitivity, offering valuable insights for drug discovery and targeted therapy development.
Publications
Here are some our targeted metabolomics publications from our clients:

- Regulation of cardiac ferroptosis in diabetic human heart failure: uncovering molecular pathways and key targets. Gawargi, F. I., & Mishra, P. K. 2024. https://doi.org/10.1038/s41420-024-02044-w
- APOB100 transgenic mice exemplify how the systemic circulation content may affect the retina without altering retinal cholesterol input. El-Darzi, N., Mast, N., Li, Y., & Pikuleva, I. A. 2024. https://doi.org/10.1167/iovs.61.13.19
- The Suppression of the KRAS G12D-Nrf2 Axis Shifts Arginine into the Phosphocreatine Energy System in Pancreatic Cancer Cells. Di Giorgio, E., Choudhary, H., Ferino, A., Cortolezzis, Y., Dalla, E., D'Este, F., ... & Xodo, L. 2023. http://dx.doi.org/10.2139/ssrn.4318051
- Metasecretome and biochemical analysis of consortium PM-06 during the degradation of nixtamalized maize pericarp . Guzmán-Pedraza, R., Peralta, S. M., et al. 2023. https://doi.org/10.1016/j.bcab.2023.102634
Partner with Creative Proteomics for Reliable Results
As a trusted leader in the omics industry, Creative Proteomics has supported researchers worldwide with tailored protein quantification solutions. Not sure which method suits your project best? Our proteomics experts are available to guide you in selecting the right approach for your research.
Contact us today to discuss your project needs and explore how we can assist you in achieving precise and reproducible proteomics insights. Our dedicated support team is available 24/7 to ensure a seamless experience from consultation to data delivery.
References
- Shu T, et al. Plasma Proteomics Identify Biomarkers and Pathogenesis of COVID-19. Immunity. 2020;53(5):1108-1122.e5. https://doi.org/10.1016/j.immuni.2020.10.008
- Zhao Y, et al. Omics study reveals abnormal alterations of breastmilk proteins and metabolites in puerperant women with COVID-19. Signal Transduction and Targeted Therapy. 2020;5(1):247.DOI:10.1038/s41392-020-00362-w
- Lin SY, et al. Proteomic characteristics of saliva in patients with different subgroups of IgG4-RD. Frontiers in Immunology. 2022;13:1026921. DOI: 10.3389/fimmu.2022.1026921
- Yuan R, et al. A novel plasma proteomic-based model for predicting liver fibrosis in HIV/HBV co-infected adults. Journal of Medical Virology. 2023;95(1):e2822.https://onlinelibrary.wiley.com/doi/10.1002/jmv.28222
- Gong R, et al. Integrative proteomic profiling of lung tissues and blood in acute respiratory distress syndrome. Frontiers in Immunology. 2023;14:1158951. DOI: 10.3389/fimmu.2023.1158951
- Zeng HL, et al. DIA-MS Based Proteomics Combined with RNA-Seq Data to Unveil the Mitochondrial Dysfunction in Human Glioblastoma. Molecules. 2023;28(4):1595. DOI: 10.3390/molecules28041595. 10.3390/molecules28041595
- Yin, M., Kuang, W., Wang, Q. et al. Dual roles and evolutionary implications of P26/poxin in antagonizing intracellular cGAS-STING and extracellular melanization immunity. Nat Commun 13, 6934 (2022). https://doi.org/10.1038/s41467-022-34761-0
- Chen MX, Zhu FY, Gao B, et al. Full-Length Transcript-Based Proteogenomics of Rice Improves Its Genome and Proteome Annotation. Plant Physiology. 2020;182(3):1510-1526.10.1104/pp.19.00430
- Zeng HL, et al. Proteomic characteristics of bronchoalveolar lavage fluid in critical COVID-19 patients. FEBS Journal. 2021;288(17):5190-5200. https://febs.onlinelibrary.wiley.com/doi/10.1111/febs.15736