2D Electrophoresis Service – High-Resolution Protein Separation and Profiling
Comprehensive Protein Profiling with Quantitative Precision
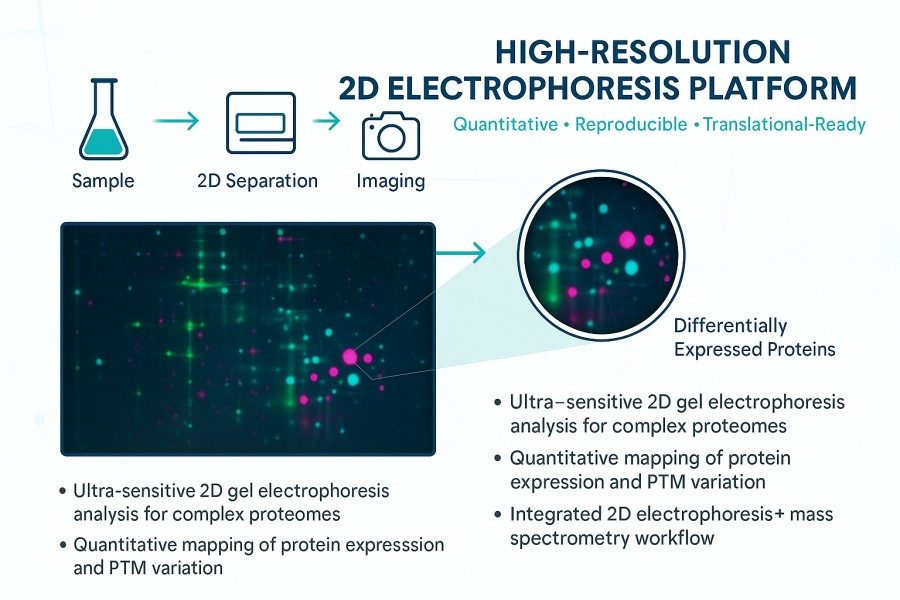
At Creative Proteomics, our 2D gel electrophoresis analysis service provides a complete solution for studying complex protein mixtures. By combining the strengths of isoelectric focusing (IEF) and SDS-PAGE, we deliver accurate separation and quantification of thousands of proteins in a single run.
This high-resolution platform supports research in protein expression profiling, post-translational modification (PTM) detection, and biomarker discovery for preclinical and translational studies.
Key Advantages
- Visualise and quantify up to 10,000 proteins per gel
- Detect subtle differences in abundance and modification states
- Integrate 2D gel electrophoresis with mass spectrometry identification
- Reliable, cost-effective solution for multi-sample comparative studies
Submit Your Request Now
×
- Applications
- Multi-Sample
- Protein Profiling Service
- PTMs Service
- Workflow
- Advantages
- Why Choose Us
- FAQ
What Is 2D Electrophoresis?
The 2D electrophoresis principle combines two separation techniques to resolve complex protein mixtures.
First, isoelectric focusing (IEF) separates proteins by their isoelectric point (pI).
Next, SDS-PAGE separates the same proteins by molecular weight, yielding a high-resolution protein map.
Researchers can then apply 2d gel electrophoresis analysis to identify thousands of spots representing distinct protein species including isoforms and post-translational modifications.
Because each protein is resolved by both charge and size, the method offers greater resolving power than 1D gels alone.
By understanding the underpinning principle, research teams can design experiments with clearer aims and improved reproducibility.
→ For further reading on methodology details, see our Overview of Two-Dimensional Gel Electrophoresis.
Applications of 2D Electrophoresis
Broad Research Applications Across Proteomics
The technique of 2D electrophoresis of protein allows detailed comparison of proteomes under varying biological conditions. Researchers can compare treated vs. control samples and identify differences in protein abundance or modification.
Protein Expression Profiling
By resolving thousands of protein spots on a single gel, this method enables comprehensive 2d gel electrophoresis analysis of protein expression changes across disease states, treatment conditions or developmental stages.
Post-Translational Modification (PTM) Studies
The high resolution of 2D gels allows detection of PTMs such as phosphorylation, acetylation, methylation and glycosylation, which often shift proteins in the pI or molecular-weight dimension. These studies are critical for signalling research, epigenetics and biopharmaceutical product characterisation.
Biomarker Discovery and Drug Development
In translational research, 2d electrophoresis application is central to identifying protein biomarkers in healthy versus disease samples, or monitoring responsiveness to treatment.
Quality Control in Biopharmaceuticals
For biopharma teams and CROs, 2D electrophoresis supports host-cell protein (HCP) detection, batch-to-batch consistency checks and impurity profiling of biologics.
Visualising Multi-Sample Proteomics with 2D DIGE
Our 2D electrophoresis of protein service integrates the advanced 2D–DIGE (Two-Dimensional Difference Gel Electrophoresis) platform, enabling simultaneous analysis of multiple samples on a single gel and bolstering reproducibility and sensitivity.
Sample Types Demonstrated
- Human Cells: e.g., Jurkat, HEK293, PBMCs — allows comprehensive profiling of cellular proteomes under treatment or disease conditions.
- Human Fluids & Tissue: e.g., serum, plasma, urine, liver tissue — supports high-throughput biomarker discovery and translational studies.
- Model Organisms: e.g., mouse brain, rat retina, zebrafish — fits cross-species workflows for drug development and academic research.
- Microbes & Others: e.g., E. coli, yeast, plant samples — enabling applications in microbiology, agriculture and bioprocess monitoring.
Why 2D DIGE Matters
- Fluorescent dyes tag each sample (typically Cy2, Cy3, Cy5), enabling co-separation on one gel and eliminating gel-to-gel variability.
- Overlay images of the fluorescent channels reveal differential expression visually—with red/green spots indicating up/down-regulation, and yellow denoting unchanged expression.
- Large-format gels resolve thousands of protein spots, accommodating complex biological matrices and enhancing downstream data interpretation.
Integration into Your Workflow
Our service accommodates both discovery-scale and targeted projects. Whether you aim for global proteome coverage or focused comparative profiling, we design the gel size and labelling strategy to match your sample type and research objectives.
Protein Profiling Service by 2D Electrophoresis
Quantitative Profiling of Differential Protein Expression
Our dedicated Protein Profiling Service by 2D Electrophoresis enables researchers to detect and quantify differences in protein abundance and isoform composition across experimental groups. By leveraging high-resolution gels and precise image analysis, we support comparative studies including treatment vs. control or disease vs. healthy samples.
Key Service Capabilities
- Resolve up to ~10,000 protein spots on large-format gels for broad proteome coverage.
- Detect subtle changes in protein abundance and distribution of isoforms or splice variants.
- Identify differentially expressed proteins for biomarker discovery or mechanistic research.
- Perform host cell protein (HCP) monitoring, antibody coverage, or impurity profiling in biopharmaceutical QC workflows.
Why Choose This Service?
- Visual "spot maps" provide intuitive insights into expression changes, facilitating early decision-making.
- Integration of gel-based quantitation with downstream 2D gel electrophoresis mass spectrometry enables confident protein identification and functional interpretation.
- Flexible design tailored to academic, biotech or CRO clients: we help you define sample groups, select gel formats and set statistical thresholds.
Use Cases
- Comparative proteome profiling of treated vs. untreated cell lines or tissue biopsies.
- Discovery of novel protein biomarkers in biofluids (e.g., serum, urine) using differential spot analysis.
- Biopharma release testing: tracking batch-to-batch consistency of biologics via isoform and impurity maps.
Follow-up of proteomic datasets: validate candidate proteins before moving into targeted workflows such as our Protein Identification Service or Protein–Protein Interaction Networks Service.
PTM Studies by 2D Electrophoresis
Deep Insight into Protein Modifications
Post-translational modifications (PTMs) such as phosphorylation, glycosylation, methylation and acetylation drive functional diversity in the proteome. The platform of 2D gel electrophoresis analysis is uniquely suited to map such variants because many PTMs alter a protein's charge (isoelectric point) and/or molecular weight.
How Our Service Detects PTMs
- Changes in pI: When a protein acquires phosphate, acetyl or methyl groups, its isoelectric focusing behaviour shifts, enabling detection of modified vs. unmodified forms.
- Mass variation: Glycosylation and other additions can change apparent molecular size on the SDS-PAGE dimension.
- Module integration: After gel separation, spots flagged as modified are excised and analysed by 2D gel electrophoresis mass spectrometry workflows for confident identification and mapping of modification sites.
Common PTM Applications
- Phosphoprotein profiling – We analyse signal-transduction networks by identifying protein spots whose pI has shifted due to phosphorylation.
- Glycosylation mapping – Our gel workflows highlight spot-pattern changes arising from N- or O-glycan attachments, relevant in immunology and biopharma.
- Methylation acetylation detection – We monitor histone modifications and regulatory protein variants by tracking protein isoform shifts.
Each of these applications benefits from the high resolution and visual clarity of 2-D separation.
Research & Regulatory Relevance
In developmental biology, oncology and biologics research, detecting subtle modification variants (sometimes<10% change) is critical. The combined "separation visualisation + MS identification" approach via our platform supports both discovery and regulatory-compliance workflows for biologic product characterisation.
Why Choose this Approach
- Allows direct visual comparison of modified vs unmodified isoforms in the same gel.
- Suitable for low-abundance modified forms thanks to fine resolution of 2-D electrophoresis.
- Integrates seamlessly with downstream proteomic workflows, supporting full annotation of proteoforms.
→ For a dedicated workflow and further details, see our Protein Post-Translational Modification Analysis Service.
Step-by-Step Workflow of 2D Gel Electrophoresis Analysis
At Creative Proteomics we follow a refined 2D electrophoresis of protein workflow to ensure data reliability and reproducibility:
1. Sample Preparation
- Extract and solubilize proteins from cells, tissues or biofluids.
- Remove interfering components (lipids, salts, high-abundance proteins) to optimise resolution.
- Accurately quantify and standardise loading amounts to enhance quantitative precision.
2. First-Dimension: Isoelectric Focusing (IEF)
- Load the sample onto an IPG strip and separate proteins by isoelectric point (pI).
- Choose the appropriate pH gradient and strip length to match the proteome's complexity.
- This step lays the foundation for high resolving power by charge differences.
3. Second-Dimension: SDS-PAGE
- Transfer the focused strip onto an SDS-PAGE gel and separate proteins by molecular weight.
- Select gel composition (acrylamide %, gradient) based on expected protein size range.
- Run multiple gels under consistent conditions for comparison across samples.
4. Visualization, Imaging & Analysis
- Stain or label the gel (Coomassie, silver or fluorescent dyes) depending on sensitivity needs.
- Acquire digital images of gel-spots; use image-analysis software to detect, quantify and compare spots.
- Identify spots of interest for downstream analysis and interpretation.
5. Mass Spectrometry Identification and Data Integration
- Excise protein spots, digest them (e.g., trypsin), and analyse by LC–MS/MS to confirm identity and modifications.
- Integrate gel-based quantitation with MS data to generate robust results for publication or regulatory use.

Advantages of Creative Proteomics' 2D Electrophoresis Service
Why our platform stands out
Our 2D electrophoresis of protein workflow is tailored for research and biopharma clients who demand precision, flexibility, and cost-efficiency. The following advantages reflect our service commitment and technological leadership.
| Feature | Research Benefit |
|---|---|
| High sensitivity | Large-format gels and advanced staining/resolving strategies support detection of low-abundance proteins. |
| Exceptional resolution | Thirty-plus years of method refinement allow separation by both isoelectric point and molecular weight, yielding rich proteome maps. |
| Quantitative accuracy | Combined with image analysis software and downstream MS, our workflow supports rigorous comparative studies. |
| Cost-effective service model | While mass-spectrometry only workflows can be resource-intensive, our gel-based platform provides strong value with high information yield. |
| Flexible design | We support various sample types (cells, tissues, biofluids, microbes) and customise gel size, labelling strategy and analysis scope to your project objectives. |
Integration with end-to-end proteomics
Our 2D gel electrophoresis service is not an isolated offering. We integrate seamlessly into larger workflows—linking to our Protein Identification Service and Protein–Protein Interaction Networks Service—to provide end-to-end proteome characterisation.
Trusted by leading research and industry teams
With over ten years of experience in proteomics, Creative Proteomics leverages validated SOPs and responsive support to serve academic labs, biotech start-ups and global pharmaceutical teams alike.
Why Choose Creative Proteomics
Proven Expertise in Proteomics
Creative Proteomics provides more than a decade of experience delivering high-quality proteomics services across academic, biotechnology and pharmaceutical sectors. Our platform supports end-to-end workflows—from sample preparation to data interpretation.
Industry-Grade Platform & Instrumentation
We are equipped with state-of-the-art instruments including LC-MS/MS, HPLC/UPLC, NMR and high-resolution 2D gel systems. This infrastructure allows rigorous 2D gel electrophoresis analysis with deep proteome coverage and high reproducibility.
Tailored Service for Research and Biopharma
Our service model is designed to meet the needs of researchers, CROs and pharmaceutical teams. We customise gel formats, labelling schemes, data analysis pipelines and reporting. Our flexibility ensures your project objectives are matched with optimal technical design.
Quality, Trust and Global Reach
We operate under strict quality control standards and service clients in over 50 countries. Our commitment to data integrity and collaborative client-service relationships underpins confidence in our results.
Integrative Workflows and Value-Added Insights
Choosing us means access not only to high-resolution 2D electrophoresis of protein but also integrated downstream services such as protein identification, PTM analysis and interaction network mapping. This facilitates seamless translation of gel-based findings into systems-level insights.
Start Your 2D Electrophoresis Project
Ready to elevate your proteomics research? Partner with Creative Proteomics for a best-in-class 2D gel electrophoresis mass spectrometry workflow designed for research, biotech, and pharmaceutical clients.
Next Steps:
- Submit your project details using our online form.
- Our team will review your sample type, study goals and budget, and deliver a tailored project plan and quote.
- Upon your approval, we begin sample receipt, workflow design, and project execution with high transparency and turnaround times.
Frequently Asked Questions (FAQ)
How can I improve the resolution of my 2D gels?
To enhance resolution, consider the following strategies:
- Optimize Sample Preparation: Ensure proteins are properly extracted and purified. Avoid conditions that may lead to degradation or aggregation.
- Use IEF Strips with a Wider pH Range: Utilizing strips with a broader pH gradient can improve separation of proteins with similar pI values.
- Adjust Sample Load: Reduce the amount of sample loaded onto the gel to prevent overcrowding, which can lead to overlapping spots.
- Control Temperature: Maintain a consistent temperature during the IEF process to avoid heat-related issues that can affect protein migration.
What steps should I take if my gel cracks during electrophoresis?
Cracking in gels can significantly affect the quality of your results. To prevent and address this issue:
- Check Gel Composition: Ensure the correct concentration of acrylamide is used for your specific sample type.
- Control Polymerization Conditions: Polymerization should occur at a controlled temperature. Rapid polymerization can lead to cracks.
- Avoid Overloading the Gel: Excess sample can cause excessive pressure and lead to cracking. Optimize your loading amounts.
- Ensure Proper Casting Techniques: Make sure to avoid air bubbles during gel casting, which can create weak points in the gel.
What is the best method for staining and visualizing proteins on a 2D gel?
Staining is crucial for visualizing proteins post-electrophoresis. Here are recommended approaches:
- Coomassie Brilliant Blue Staining: This is a widely used method for general protein visualization. It is sensitive and allows for the detection of low-abundance proteins. Make sure to fix the gel before staining to enhance staining uniformity.
- Silver Staining: For higher sensitivity, silver staining is an excellent choice, especially for detecting low abundance proteins. However, it's a more complicated and time-consuming process.
- Fluorescent Stains: Consider using fluorescent stains for even higher sensitivity and quantification capabilities. Ensure you have the appropriate imaging system for detection.
How can I troubleshoot issues with protein transfer from gel to membrane?
Optimize Transfer Conditions: Check the voltage and transfer time. A common protocol uses 100 V for 1-2 hours; however, conditions may need adjustment based on gel thickness and protein size.
Check Buffer Composition: Ensure that your transfer buffer contains methanol (or isopropanol) for PVDF membranes, as this can enhance protein binding.
Use a Sandwich Method: Ensure that there's good contact between the gel and membrane without air bubbles. Consider using a transfer sandwich setup to improve contact.
Evaluate Membrane Condition: Ensure the membrane is pre-wetted appropriately. PVDF membranes should be activated in methanol, then rinsed in transfer buffer.
What should I do if bubbles form during electrophoresis?
Ensure Proper Gel Casting: When casting gels, avoid introducing air bubbles by carefully mixing and pouring the solution.
Check Electrode Connections: Poor connections can lead to arcing and bubble formation. Ensure that all connections are tight and secure.
Monitor Buffer Levels: Ensure that the buffer covers the gel completely during electrophoresis. Low buffer levels can cause the gel to dry out and form bubbles.
Use Anti-bubble Agents: Some laboratories add small amounts of surfactants to the buffer to reduce bubble formation.
What causes poor separation between protein spots, and how can I fix it?
Overloading Samples: High protein concentration can lead to overlapping spots. Reduce the sample volume.
Inconsistent pH Gradients: Check the IEF strip for proper pH gradient formation. If the gradient is not well established, consider using freshly prepared strips.
Incorrect Gel Concentration: Adjust the acrylamide concentration according to the expected size of your proteins. A higher concentration is better for smaller proteins, while lower concentrations are suited for larger ones.
What causes horizontal bands in my gel, especially when high-abundance proteins are present?
Horizontal bands can occur when high-abundance proteins aggregate, particularly if using a gel strip with the gel side facing down. To mitigate this issue, consider the following solutions:
- Use Cup Loading or Manifold Techniques: These methods involve loading samples with the gel side facing up, which helps reduce the formation of horizontal bands.
- Ensure Proper Sample Dilution: Diluting high-abundance proteins can help prevent their aggregation and the resultant horizontal bands.
Why are there horizontal bands when using narrow pH range gels?
Horizontal bands in narrow pH range gels may indicate insufficient focusing or excessive salt ions. Additional causes include:
- Detergent Concentration: Ensure the concentration of your detergent is adequate.
- Urea Concentration: Verify that urea is present in sufficient amounts to maintain protein solubility.
- DTT Concentration: Ensure DTT concentration is high enough and that the quantity used is appropriate.
- Sample Loading Position: Improper loading position, such as using cup loading, can affect band formation.
- Protease Activity: Check for active proteases in your sample that may degrade proteins.
- Gel Swelling Time: Insufficient swelling time of the gel strips can lead to uneven protein migration.
- Presence of Insoluble Proteins: Centrifuge samples at 40,000 g for 1 hour to remove any insoluble proteins.
- CO2 in the Air: High levels of CO2 can affect pH and cause issues during focusing.
How does reagent freshness impact my results?
Using stale reagents can significantly affect your results. For instance, TEMED, while used in small quantities, should be replaced annually to ensure optimal performance.
What impact does reagent quality have on protein spot imaging?
The quality of Tris used in buffers can influence the outcome of your electrophoresis. Poor-quality Tris may lead to inconsistent pH and buffer conditions, ultimately affecting protein separation and visualization.
What steps can I take if proteins are lost during transfer?
Improper transfer conditions can result in protein loss. Ensure:
Voltage Settings: Maintain appropriate voltage settings, especially during the initial phase. For an 18 cm gel, avoid exceeding 2 W/gel during the first 45 minutes to prevent excessive heat and protein loss.
What should I consider when preparing plant samples for electrophoresis?
Plant samples often contain polysaccharides that can interfere with the electrophoresis process. To ensure cleaner samples:
Clean-up Treatment: Use clean-up procedures to remove polysaccharides and other contaminants before running the electrophoresis.
Why are there vertical bands in my protein spots?
Vertical bands can result from inadequate DTT during the equilibration phase, affecting the reduction of disulfide bonds. Ensure that DTT is present in sufficient concentrations during this process to minimize vertical banding.
What causes high salt ions in my samples, and how can I resolve this?
Excessive salt ions can lead to failure in isoelectric focusing. To prevent this issue:
De-salting Techniques: Remove excess salts by thoroughly washing cells. After centrifugation, ensure all PBS is removed, or use a washing buffer containing 250 mM sucrose and 10 mM Tris to cleanse the cells effectively.
How should I handle loading alkaline pH range gels?
For gels with a pH range of 6-11, it is recommended to use cup loading for improved sample application, especially for alkaline pH range gels.
What issues arise from storing second-dimension gels at low temperatures?
Storing second-dimension gels at excessively low temperatures can cause SDS precipitation, affecting gel integrity. To avoid this:
Optimal Storage Conditions: Store gels at 4–8°C for short periods (2 days to 2 weeks). Before running the second dimension, remove the gel from cold storage and allow it to acclimate to room temperature to prevent precipitation issues.
What is the principle of 2D electrophoresis?
The 2D electrophoresis principle combines two separation dimensions—isoelectric focusing (IEF) and SDS-PAGE—to resolve proteins first by charge (pI) and then by molecular weight. This dual approach produces a detailed protein map for quantitative and comparative proteomics.
What are the main applications of 2D electrophoresis?
Key 2D electrophoresis applications include:
- Protein expression profiling in cells and tissues
- Post-translational modification (PTM) studies
- Biomarker discovery for disease or drug research
- Host-cell protein (HCP) analysis and biologics QC
What types of samples can be analysed by 2D gel electrophoresis?
We analyse a wide variety of matrices: serum, plasma, urine, cerebrospinal fluid, cell lysates, tissue homogenates, microbial cultures, and plant extracts.
→ See our Proteomics Service Platform for full compatibility details.
How does 2D DIGE improve accuracy and sensitivity?
2D DIGE (Difference Gel Electrophoresis) uses fluorescent dyes (e.g., Cy2, Cy3, Cy5) to label multiple samples, which are co-run on the same gel. This eliminates gel-to-gel variation, enhances reproducibility, and detects protein expression changes as small as 10%.
Can 2D electrophoresis detect post-translational modifications (PTMs)?
Yes. The high resolution of 2D gel electrophoresis analysis allows detection of PTM-induced shifts in protein charge or size. Phosphorylation, glycosylation, acetylation, and methylation are among the most frequently studied modifications.
→ Learn more in our Protein Post-Translational Modification Analysis Service.
How many proteins can be resolved on a 2D gel?
Depending on gel size and sample complexity, up to 10,000 protein spots can be visualised per large-format gel, offering exceptional proteome coverage.
Can 2D electrophoresis be combined with mass spectrometry?
Yes. After separation, selected protein spots are digested and identified by LC–MS/MS, forming an integrated 2D gel electrophoresis mass spectrometry workflow for confident protein identification and quantification.
What is the typical workflow for 2D electrophoresis?
Our workflow includes:
- Sample preparation and clean-up
- Isoelectric focusing (pI separation)
- SDS-PAGE (mass separation)
- Staining or fluorescent imaging
- Data analysis + MS identification
How reproducible are the results?
Our 2D electrophoresis service achieves high reproducibility through DIGE co-running, standardised reagents, and strict quality control. Inter-gel CV values typically remain below 10%.
How does 2D electrophoresis compare with LC–MS-only workflows?
While LC–MS provides high-throughput data, 2D electrophoresis adds a visual dimension—detecting isoforms, charge variants, and PTM shifts that may be missed in peptide-based approaches. The combination of both yields the most comprehensive proteomic insight.
What are common challenges and solutions in 2D electrophoresis?
- Low resolution: Optimise IPG strip pH range and gel composition.
- Gel cracking: Prevent dehydration and use high-quality acrylamide.
- Protein loss: Minimise salt content and freeze–thaw cycles.
- Bubbles or streaking: Degas buffers and ensure even sample loading.
What quality-control measures are implemented?
We apply internal and external controls in every run, use image-analysis software for spot validation, and verify key targets by mass spectrometry to maintain consistency and traceability.
Can Creative Proteomics help interpret the data?
Yes. Our scientists provide full bioinformatics support, including spot-to-protein mapping, functional annotation, and quantitative comparison reports.
Learn about other Q&A about proteomics technology.