Serum Metabolomics Analysis Service
Creative Proteomics delivers expert serum metabolomics analysis to support metabolic pathway exploration, biomarker discovery, and treatment evaluation. With advanced mass spectrometry platforms and robust workflows, we provide reliable, high-resolution metabolic data tailored for complex biological research.
Key Advantages:
- Broad untargeted and targeted metabolite coverage
- High-sensitivity detection and excellent reproducibility
- Metabolic pathway mapping and enrichment analysis
- Stable isotope-labeled flux and turnover studies
- Scalable batch processing for multi-group designs
- Custom bioinformatics and data visualization solutions
Submit Your Request Now
×
What You Will Receive
- Untargeted & targeted metabolite profiling
- Metabolic pathway mapping & enrichment analysis
- Stable isotope-labeled flux studies
- Custom statistical & bioinformatics reports
- High-throughput batch processing
- Publication-ready data visualization
- What We Provide
- Advantages
- Technology Platform
- Sample Requirements
- Demo
- FAQs
- Case Study
Why Choose Serum for Metabolomics Analysis?
Serum is one of the most widely used and informative biological matrices for metabolomics research. Easily obtained and relatively stable, it contains a broad spectrum of endogenous metabolites that reflect systemic metabolic activity across multiple tissues and organs. These metabolites include amino acids, organic acids, lipids, carbohydrates, bile acids, and microbiota-derived compounds, providing a high-resolution snapshot of physiological and biochemical states.
In experimental research, serum metabolomics offers a non-invasive, reproducible, and scalable approach to evaluate treatment responses, metabolic pathway regulation, nutritional effects, and environmental exposures. Its compatibility with both targeted and untargeted workflows enables comprehensive metabolic profiling and dynamic comparison across time points, interventions, or phenotypic groups—making it an essential matrix in systems biology, pharmacology, toxicology, and nutritional studies.
Serum Metabolomics Analysis Service Offered by Creative Proteomics
- Untargeted Metabolomics Profiling: High-resolution LC-MS/MS and GC-MS analysis to detect and annotate hundreds to thousands of serum metabolites without prior bias.
- Targeted Metabolite Quantification Panels: Absolute or relative quantification of specific metabolic classes.
- Pathway-Focused Metabolomics Assays: Tailored panels for in-depth investigation of key metabolic routes.
- Stable Isotope-Labeled Metabolite Tracing: For metabolic flux and turnover studies using 13C-, 15N-, or 2H-labeled compounds in serum samples.
- Multigroup and Time-Course Comparative Analysis: Designed for dose-response, intervention, or longitudinal studies, with integrated statistical and bioinformatics support.
- Metabolic Pathway Mapping and Enrichment Analysis: Annotation and visualization of metabolite changes in the context of KEGG, Reactome, and HMDB pathway databases.
- Data Processing and Biostatistical Interpretation: Includes PCA, PLS-DA, heatmaps, volcano plots, clustering, and custom bioinformatics reporting upon request.
List of Detected Serum Metabolomics and Related Metabolites
| Metabolite Class | Representative Compounds | Associated Pathways |
|---|---|---|
| Amino Acids & Derivatives | Valine, Leucine, Isoleucine, Tryptophan, Glutamate, Ornithine | BCAA catabolism, Urea cycle, Kynurenine pathway |
| TCA Cycle Intermediates | Citric acid, Isocitric acid, α-Ketoglutarate, Fumarate, Malate | Energy metabolism, Mitochondrial respiration |
| Fatty Acids | Palmitic acid, Stearic acid, Oleic acid, Linoleic acid | β-oxidation, Lipogenesis |
| Acylcarnitines | Acetylcarnitine, Propionylcarnitine, Octanoylcarnitine | Fatty acid transport, Mitochondrial entry |
| Bile Acids | Cholic acid, Chenodeoxycholic acid, Deoxycholic acid | Primary and secondary bile acid synthesis |
| Purines & Pyrimidines | Adenine, Inosine, Xanthine, Uracil, Thymine | Nucleotide metabolism, DNA/RNA turnover |
| Polyamines | Spermidine, Spermine, Putrescine | Cell proliferation, Amino acid decarboxylation |
| Organic Acids | Lactic acid, Pyruvic acid, Succinic acid, 3-Hydroxybutyrate | Glycolysis, Ketone body metabolism |
| Sugars & Sugar Alcohols | Glucose, Fructose, Mannose, Sorbitol | Glycolysis, Polyol pathway |
| Redox Cofactors | NAD⁺, NADH, FAD, FMN, Glutathione (GSH/GSSG) | Oxidative stress response, Redox homeostasis |
| Vitamins & Derivatives | Riboflavin, Biotin, Nicotinamide, Pantothenic acid | Coenzyme synthesis, Energy metabolism |
| Microbial-Derived Metabolites | Indole-3-propionic acid, p-Cresol sulfate, TMAO | Gut microbiota-host interaction |
| Short-Chain Fatty Acids (SCFAs) | Acetate, Propionate, Butyrate | Gut microbial fermentation, Colonocyte nutrition |
| Phenolic Metabolites | Ferulic acid, Caffeic acid, Gallic acid | Dietary polyphenol metabolism |
| Sterols & Steroid Hormones | Cholesterol, DHEA-S, Cortisol | Lipid metabolism, Endocrine regulation |
| Ketone Bodies | β-Hydroxybutyrate, Acetoacetate | Starvation response, Lipid oxidation |
Advantages of Serum Metabolomics Assay
- Broad Metabolite Coverage: Detects over 1,200 endogenous and microbial-derived metabolites in a single untargeted LC-MS/MS run.
- High Sensitivity and Low Detection Limits: Quantifies key metabolites such as bile acids, SCFAs, and amino acids with LOD < 1 nM in serum matrices.
- Excellent Reproducibility: Achieves intra-assay CV ≤ 10% and inter-assay CV ≤ 15% across technical replicates.
- Multi-platform Compatibility: Combines LC-MS/MS and GC-MS methods to cover both polar and volatile metabolite classes, increasing analytical depth.
- Pathway-Level Insights: Enables mapping to 60+ curated biological pathways via KEGG, HMDB, and Reactome databases.
- Batch Processing Efficiency: Supports 96+ serum samples per batch, ideal for dose-response, time-course, and comparative study designs.
- Flexible Data Outputs: Delivers both absolute and relative quantification, customizable statistical reports, and publication-ready visuals.
- Stable Isotope Compatibility: Supports 13C-, 15N-, and 2H-labeled tracer analysis for metabolic flux and pathway activity studies.
Workflow for Serum Metabolomics Analysis Service
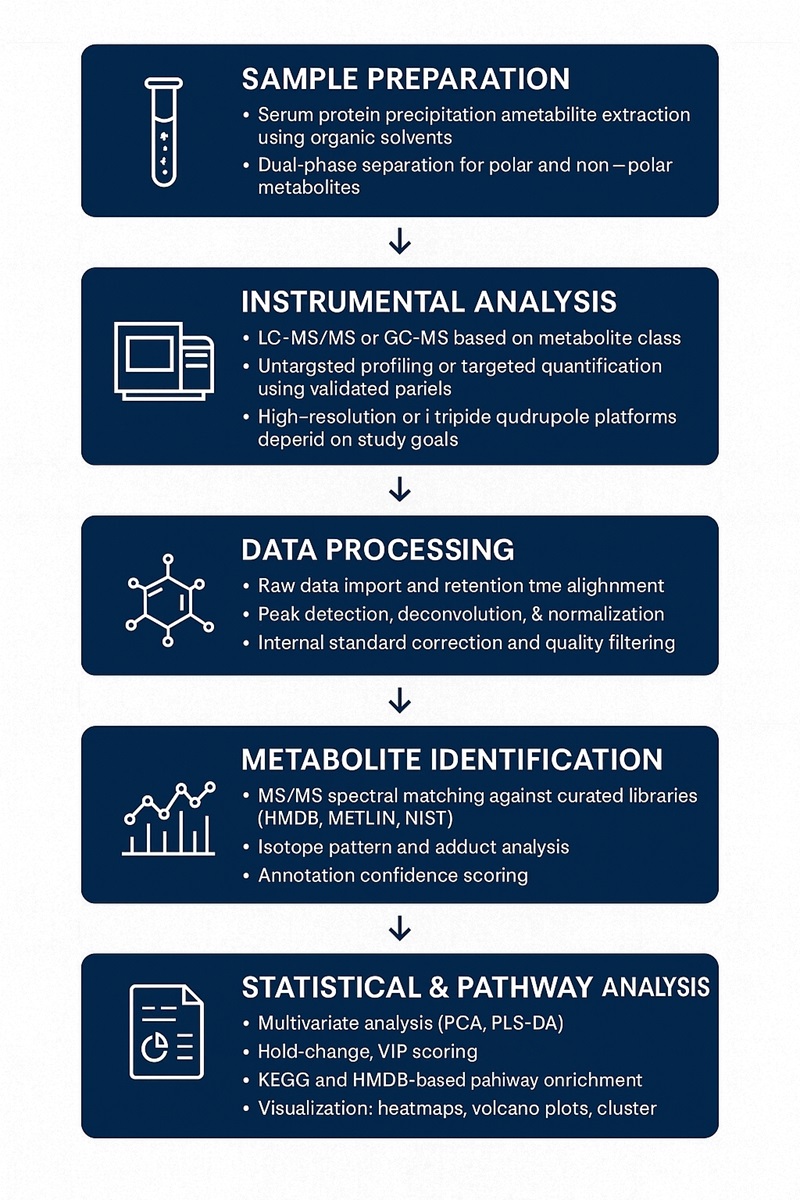
Methods and Instrumentation for Serum Metabolomics Analysis
LC-MS/MS (Liquid Chromatography–Tandem Mass Spectrometry): Broad coverage of polar and semi-polar metabolites including amino acids, bile acids, organic acids, nucleotides, and lipid mediators.
Thermo Scientific Q Exactive Orbitrap + Vanquish UHPLC
- High-resolution accurate mass (HRAM) for untargeted profiling
- Suitable for pathway discovery and compound annotation
Sciex Triple Quad™ 6500+ LC-MS/MS
- Targeted quantification via MRM with excellent sensitivity
- Ideal for absolute quantification of key metabolites
GC-MS (Gas Chromatography–Mass Spectrometry): Detection of volatile and derivatized metabolites such as SCFAs, sugars, and amino acids.
Agilent 7890B GC + 5977B MSD
- Robust and reproducible platform
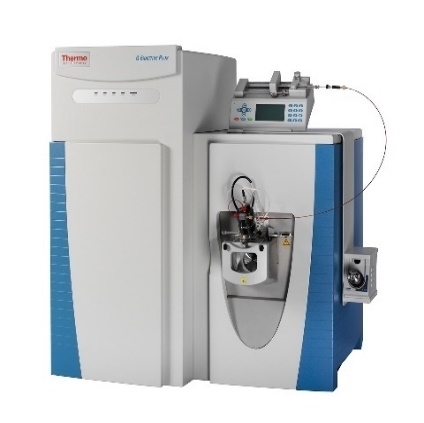
Thermo Fisher Q Exactive (Figure from Thermo Fisher)
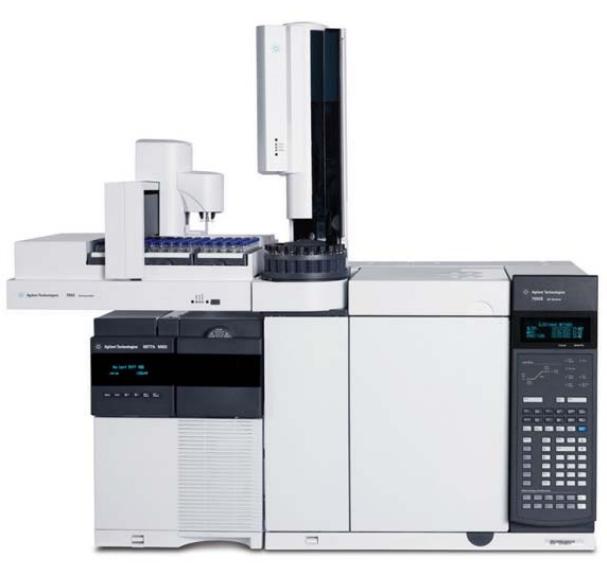
Agilent 7890B-5977B (Figure from Agilent)
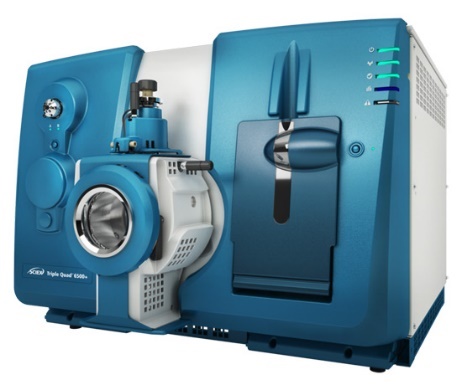
SCIEX Triple Quad™ 6500+ (Figure from Sciex)
Sample Requirements for Serum Metabolomics Analysis Service
| Parameter | Requirement |
|---|---|
| Sample Type | Human or animal serum (preferred); plasma also accepted (EDTA or heparin only) |
| Minimum Volume | ≥ 200 µL per sample (≥ 3 replicates recommended for each group) |
| Collection Tubes | Serum separation tubes (no anticoagulant); avoid hemolysis |
| Processing Time | Centrifuge within 1 hour of collection; separate serum promptly |
| Storage Temperature | –80°C |
| Shipping Conditions | Ship on dry ice in sealed, clearly labeled cryotubes |
| Avoid | Repeated freeze-thaw cycles; citrate-based anticoagulants; lipemic or hemolyzed samples |
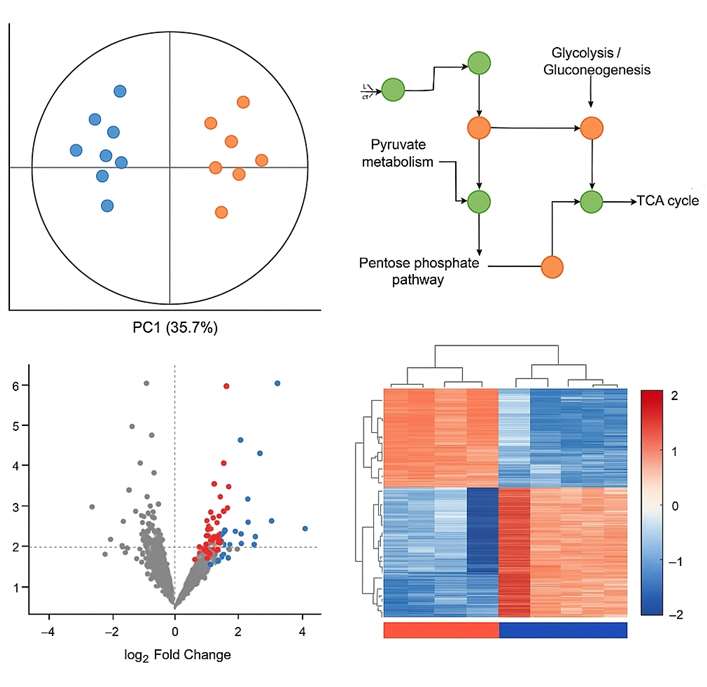
Demo Results

Quantitative comparison of selected serum metabolites between control and treated groups.

Pathway enrichment analysis showing rich factor and significance (-log10 p-value) of affected metabolic pathways.

PLS-DA visualization highlighting distinct metabolic patterns between experimental groups.

Pathway enrichment analysis showing rich factor and significance (-log10 p-value) of affected metabolic pathways.

RSD values of representative serum metabolites indicating analytical repeatability within acceptable limits.
FAQ of Serum Metabolomics Analysis Service
Can I submit both serum and plasma samples in the same project?
Yes. We accept both matrices and will process them independently to account for their biochemical differences. It's recommended to avoid cross-matrix comparisons unless explicitly designed.
How should I aliquot serum samples to avoid degradation?
We recommend aliquoting immediately after centrifugation into 1.5 mL cryotubes (≥200 µL per tube), followed by –80°C storage. Avoid repeated freeze-thaw cycles.
What species are supported for serum metabolomics analysis?
We support a wide range of species, including human, mouse, rat, monkey, pig, dog, and more. If using uncommon models, we can evaluate compatibility upon request.
Can I receive both raw data and processed data?
Yes. We provide the raw instrument files, the processed data matrix (normalized/annotated), and statistical outputs. Bioinformatics interpretations are available upon request.
How do you handle batch effect correction for large sample sets?
We apply internal standards and pooled QC samples across batches, followed by signal correction algorithms (e.g., LOESS, median scaling) to minimize batch bias.
Is it possible to focus only on a specific metabolic pathway or compound class?
Absolutely. You can choose from our predefined targeted panels or request custom panels focused on a single pathway (e.g., TCA cycle, bile acids, kynurenine pathway).
What if my sample volume is limited (e.g.,<100 µL)?
We can apply a miniaturized protocol, though some low-abundance metabolites may fall below detection thresholds. Please contact us before shipping limited-volume samples.
Do you provide assistance with statistical interpretation or publication support?
Yes. Our team can help generate figures (e.g., PCA, volcano plots), provide summary descriptions, and offer pathway insights suitable for publication or internal reporting.
How long is the typical turnaround time?
The average turnaround is 10–20 working days depending on project size, platform, and whether targeted or untargeted analysis is requested. A precise timeline will be confirmed upon project setup.
Learn about other Q&A.
Serum Metabolomics Analysis Service Case Study
Title: A Personalized Probabilistic Approach to Ovarian Cancer Diagnostics
Journal: Gynecologic Oncology
Published: 2024
- Background
- Methods
- Results
- Reference
Early detection of ovarian cancer (OC) remains critical yet challenging due to its asymptomatic nature and molecular heterogeneity. Traditional binary diagnostic methods lack the sensitivity and nuance needed for early-stage detection. Metabolomic profiling—analyzing serum metabolite levels—offers a promising route by capturing the downstream phenotypic effects of genomic changes. The study aims to harness metabolomics combined with machine learning (ML) to develop a personalized, probabilistic diagnostic tool that's more informative than simple yes/no tests
- Serum samples: Collected from 431 OC patients and 133 healthy controls across four regions (Atlanta, Philadelphia, Chapel Hill, Alberta).
- Metabolomic analysis: Sent to Creative Proteomics (Shirley, NY) for UPLC-MS/MS. Each sample was processed through two chromatographic columns (HILIC and C18) using both positive and negative ion modes, producing four datasets (HP, HN, RP, RN).
- Quality control: Pooled QC samples were run every 10 injections to correct instrument drift, ensuring reproducibility and eliminating batch effects (confirmed via PCA).
- Feature selection: Employed recursive feature elimination (RFE) with repeated cross-validation to identify reliable metabolite features.
- Classifier building: Five ML models—logistic regression, random forest, support vector machine, k-nearest neighbor, and adaptive boosting—were trained. Their outputs were then combined into a consensus classifier.
- Probabilistic scoring: The model assigned each sample a probability score (normalized between –2 to +2) reflecting the likelihood of OC, supporting a personalized diagnostic interpretation.
Creative Proteomics provides clients with:
Creative Proteomics provided full UPLC-MS/MS-based metabolomic services—including sample processing, dual-column and dual-ion mode analyses, batch drift correction via pooled QC samples, and high-resolution data acquisition—enabling high-quality, reproducible metabolomic profiling for end-to-end diagnostic development.
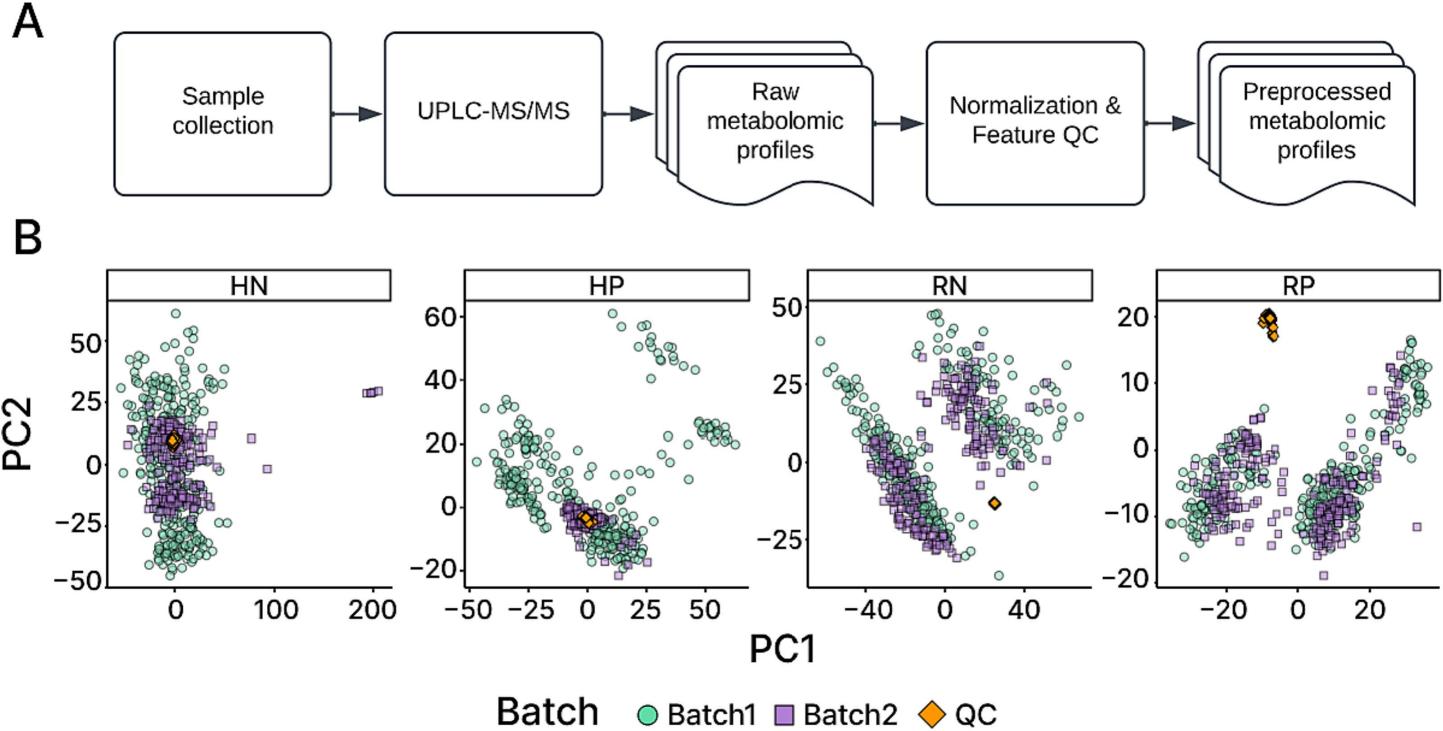 Workflow diagram illustrating data acquisition and preparation process.
- Classifier performance: The consensus model achieved ~93% accuracy overall, with precision (PPV) up to 97%, negative predictive value (NPV) up to 92%, and MCC values up to 0.87 across datasets.
- Metabolite insights: Only ~7% of top predictive metabolites were annotated via HMDB; lipids made up the majority of identified biomarkers.
- Probabilistic scoring effectiveness: 97% of cancer samples scored between +1 and +2, while 83% of normal samples scored between –2 and –1. Early-stage OC classification remained highly accurate (98% for early-stage; 92.7% for late-stage at score >1.5).
- Clinical tool: The probability-based scoring can guide follow-up: low-risk scores suggest routine monitoring, high-risk scores indicate need for immediate intervention, and intermediate scores may trigger additional testing.
Reference
- Ban, Dongjo, et al. "A personalized probabilistic approach to ovarian cancer diagnostics." Gynecologic oncology 182 (2024): 168-175. https://doi.org/10.1016/j.ygyno.2023.12.030
Publications
Here are some of the metabolomics-related papers published by our clients:

- A personalized probabilistic approach to ovarian cancer diagnostics. 2024. https://doi.org/10.1016/j.ygyno.2023.12.030
- Identification of a novel function of hepatic long-chain acyl-CoA synthetase-1 (ACSL1) in bile acid synthesis and its regulation by bile acid-activated farnesoid X receptor. 2019. https://doi.org/10.1016/j.bbalip.2018.12.012
- Quantification of choline in serum and plasma using a clinical nuclear magnetic resonance analyzer. 2022. https://doi.org/10.1016/j.cca.2021.11.031
- A human iPSC-derived hepatocyte screen identifies compounds that inhibit production of Apolipoprotein B. 2023. https://doi.org/10.1038/s42003-023-04739-9
- The activity of the aryl hydrocarbon receptor in T cells tunes the gut microenvironment to sustain autoimmunity and neuroinflammation. 2023. https://doi.org/10.1371/journal.pbio.3002000
- Lipid droplet-associated lncRNA LIPTER preserves cardiac lipid metabolism. 2023. https://doi.org/10.1038/s41556-023-01162-4
- Inflammation primes the kidney for recovery by activating AZIN1 A-to-I editing. 2023. https://doi.org/10.1101/2023.11.09.566426
- Anti-inflammatory activity of black soldier fly oil associated with modulation of TLR signaling: A metabolomic approach. 2023. https://doi.org/10.3390/ijms241310634