Phenolic Acids Analysis Service
Creative Proteomics provides high-sensitivity phenolic acids analysis through targeted quantification (e.g., caffeic, ferulic acids) and untargeted metabolite profiling using LC-MS/MS and HPLC.
We help you:
- Ensure batch consistency (RSD < 5%)
- Detect trace-level bioactives (LOD: 0.5 ng/mL)
- Map phenolic pathways with KEGG-based interpretation
Optimized for plant tissues, biological fluids, and complex matrices—accelerate your research and product development with accurate, high-throughput data.
Submit Your Request Now
×
- What We Provide
- Advantage
- Workflow
- Technology Platform
- Sample Requirements
- FAQ
- Case Study
What are Phenolic Acids?
Phenolic acids are a subclass of phenolic compounds characterized by an aromatic ring bearing hydroxyl and carboxylic acid groups. Structurally, they are divided into two primary categories: hydroxybenzoic acids (e.g., vanillic, protocatechuic) and hydroxycinnamic acids (e.g., caffeic, ferulic, p-coumaric). These compounds are ubiquitous in plants, contributing to flavor, color, and bioactive properties, and are integral to human health due to their antioxidant, anti-inflammatory, and antimicrobial activities.
Why Analyze Phenolic Acids?
Phenolic acids are critical bioactive compounds involved in plant defense, antioxidant activity, and quality traits of food and botanical materials. Accurate analysis is essential for:
- Quantification & Standardization – Ensure consistency and compliance in food, nutraceutical, and agricultural products.
- Functional Compound Identification – Discover phenolic acids with antioxidant, antimicrobial, or stress-mitigation properties.
- Metabolic Pathway Analysis – Track biosynthesis and degradation pathways for systems biology and metabolic engineering.
- Quality & Authenticity Control – Verify raw material identity through phenolic acid profiling.
- Environmental & Stress Response Studies – Assess plant responses to environmental stimuli by phenolic acid variation.
- Process Optimization – Monitor phenolic acid content during extraction, fermentation, and processing stages.
Creative Proteomics provides high-resolution, reproducible phenolic acid profiling to support research, development, and quality control with actionable data.
Phenolic Acids Analysis Service Offered by Creative Proteomics
- Targeted Quantification of Major Phenolic Acids: Precise measurement of specific phenolic acids such as caffeic acid, ferulic acid, gallic acid, and p-coumaric acid using LC-MS/MS.
- Untargeted Metabolite Profiling: Broad-spectrum detection of known and unknown phenolic acid compounds and derivatives to uncover novel biomarkers or compound patterns.
- Phenolic Acid Derivatives & Conjugates Identification: Analysis of glycosylated, methylated, and esterified phenolic forms to support pathway and bioavailability studies.
- Metabolic Pathway Mapping: Annotation of phenolic acid biosynthetic and degradation pathways using KEGG and other curated databases.
- Quantification of Total Phenolic Content (TPC): Spectrophotometric and LC-based assessment of total phenolic concentration for antioxidant capacity evaluation.
- Comparative Phenolic Profile Analysis: Differential analysis across sample groups (e.g., treated vs. control) to identify phenolic response patterns or stress biomarkers.
- Data Interpretation & Pathway Integration: Bioinformatics-assisted result interpretation, including heatmaps, PCA, clustering, and metabolic pathway visualization.
Detected Phenolic Acids and Related Analytes
| Phenolic Acid | Related Metabolites | Associated Metabolic Pathways |
|---|---|---|
| Caffeic Acid | Chlorogenic acid, Ferulic acid, Caffeoylquinic acid | Phenylpropanoid biosynthesis, Flavonoid biosynthesis |
| Ferulic Acid | 4-Vinylguaiacol, Sinapic acid | Phenylpropanoid biosynthesis, Lignin biosynthesis |
| p-Coumaric Acid | p-Coumaroyl-CoA, Caffeic acid | Phenylpropanoid biosynthesis, Stilbenoid biosynthesis |
| Gallic Acid | Methyl gallate, Digallic acid | Gallic acid pathway, Hydrolysable tannin biosynthesis |
| Chlorogenic Acid | Neochlorogenic acid, Cryptochlorogenic acid | Caffeoylquinic acid biosynthesis, Antioxidant metabolism |
| Sinapic Acid | Sinapoyl glucose, Sinapoyl malate | Phenylpropanoid biosynthesis, Brassicaceae-specific metabolism |
| Ellagic Acid | Urolithins, Hexahydroxydiphenic acid derivatives | Tannin degradation, Gut microbial metabolism |
| Vanillic Acid | Vanillin, Protocatechuic acid | Lignin degradation, Benzoate metabolism |
| Syringic Acid | Syringaldehyde, Syringol | Methoxylated phenolics biosynthesis, Lignin metabolism |
| Protocatechuic Acid | Catechol, Benzoic acid | Benzoate degradation, Aromatic compound metabolism |
| Rosmarinic Acid | Caffeic acid, Salvianolic acids | Caffeic acid ester metabolism, Antioxidant pathway |
| Gentisic Acid | 3,5-Dihydroxybenzoic acid | Salicylate metabolism, Aromatic compound catabolism |
Advantages of Phenolic Acids Assay
- Ultra-Low Detection Limits: Our LC-MS/MS methods achieve detection limits as low as 0.5 ng/mL, enabling confident quantification even in trace-level samples.
- Exceptional Quantification Accuracy: Quantitative results demonstrate relative standard deviations (RSD) consistently below 5%, ensuring high analytical reliability and reproducibility.
- Wide Linear Dynamic Range: The method supports a dynamic quantification range exceeding 10,000-fold, allowing simultaneous analysis of samples with vastly different concentration levels.
- High Throughput Capacity: Our automated pipeline is capable of processing over 200 samples per day, making it ideal for large-scale or time-sensitive projects.
- Low Sample Volume Requirements: Validated protocols require as little as 50 mg of solid sample or 500 µL of liquid extract, minimizing material consumption.
- Full Pathway Coverage: Comprehensive profiling includes quinic acid and over 10 related metabolites across the shikimate and phenylpropanoid pathways, providing deep biological insight.
- Strict Quality Control: Each batch includes internal standards and QC samples, and inter-assay coefficient of variation is maintained below 8%.
- Flexible Customization: Protocols are tailored to your specific matrix and research objective, including options for enzymatic hydrolysis, isotope labeling, or comparative group analysis.
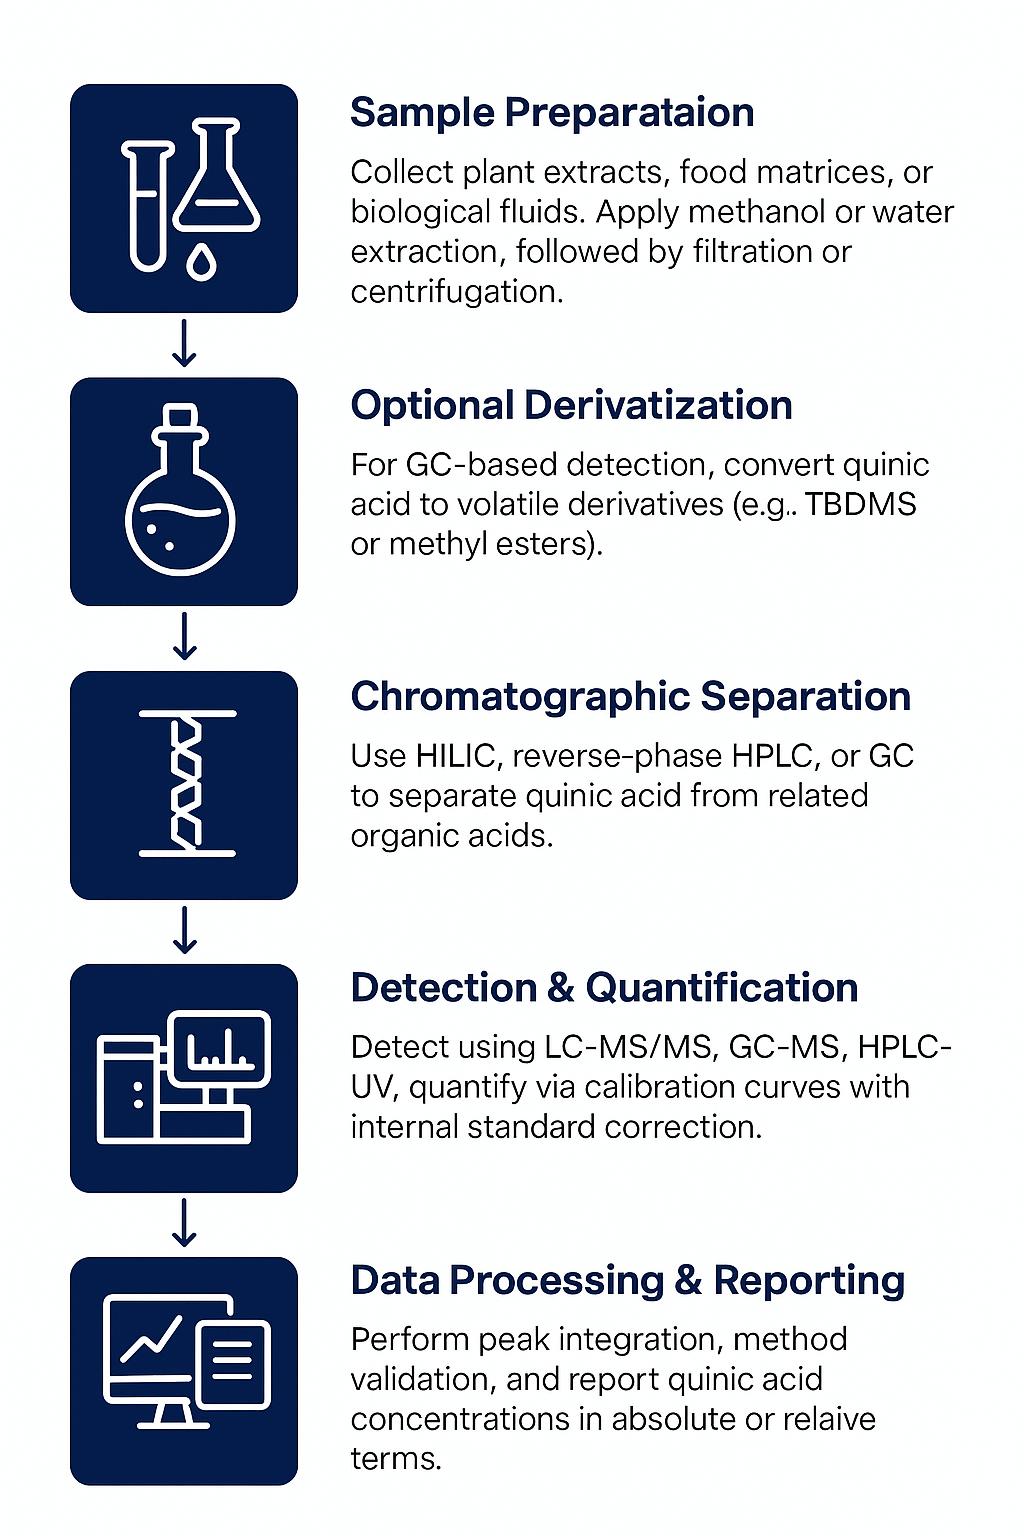
Workflow for Phenolic Acids Analysis Service
Technology Platform for Phenolic Acids Analysis Service
Agilent 6495C Triple Quadrupole LC/MS – For ultra-sensitive targeted quantification of phenolic acids in complex biological matrices.
Agilent 7890B GC coupled with 5977A MSD – For analysis of volatile or derivatized phenolic compounds and degradation products.
Agilent 1260 Infinity II HPLC – For high-resolution separation and UV/DAD-based quantification of phenolic acids.
Agilent 6495C Triple Quadrupole (Figure from Agilent)
Agilent 7890B-5977A (Figure from Agilent)
Agilent 1260 Infinity II HPLC (Fig from Agilent)
Sample Requirements for Phenolic Acids Analysis Service
| Sample Type | Required Amount | Notes |
|---|---|---|
| Plant Tissue (leaf, root, stem, etc.) | ≥ 200 mg (fresh weight) / ≥ 50 mg (dry weight) | Flash-freeze in liquid nitrogen and store at -80°C; avoid repeated freeze-thaw. |
| Fruits & Vegetables | ≥ 200 mg (fresh) | Homogenize thoroughly; avoid browning or oxidation prior to submission. |
| Fermented Products (wine, tea, etc.) | ≥ 1 mL | Store at -20°C in sealed vials; avoid light exposure. |
| Food Samples (powder, extract) | ≥ 100 mg | Provide dry powder or concentrated extract; indicate solvent if applicable. |
| Serum / Plasma | ≥ 200 µL | Collect using EDTA or heparin tubes; centrifuge and aliquot; freeze at -80°C. |
| Urine | ≥ 1 mL | Collect midstream, store at -80°C; avoid preservatives. |
| Cell / Microbial Pellet | ≥ 1 × 10⁷ cells | Wash with PBS and freeze at -80°C promptly after collection. |
| Culture Supernatant | ≥ 1 mL | Filter sterilize if needed; avoid contamination. |
FAQ of Phenolic Acids Analysis Service
How should liquid samples (e.g., serum, plant extracts) be prepared for analysis?
Liquid samples should be centrifuged (10,000 × g, 10 min) to remove particulates. For plant extracts, filter through a 0.22 μm PVDF membrane. Avoid preservatives like sodium azide; store at -80°C in amber vials.
Can you identify structurally novel phenolic acids not listed in your database?
Yes. Our untargeted LC-MS workflows (Agilent 6495C QqQ) coupled with in-house fragmentation libraries enable de novo characterization of unknown phenolic acids using accurate mass (<3 ppm error) and MS/MS spectral matching.
Is your method sensitive enough for environmental samples (e.g., soil leachates)?
Absolutely. Our LC-MS/MS protocols achieve detection limits of 0.5 ng/mL even in complex matrices. For trace-level analytes, we apply SPE pre-concentration to enhance sensitivity by 10–50×.
Do you support collaborative projects requiring international sample shipping?
Yes. We provide validated sample collection kits with stabilizing buffers and dry ice-compatible packaging. Customs documentation (e.g., MSDS, non-hazardous certifications) is included for seamless global shipping.
What if my sample quantity is insufficient for your standard protocol?
We offer micro-scale workflows requiring 10 mg solid or 100 µL liquid, leveraging our Agilent 6495C's high sensitivity. Note: Detection limits may increase slightly (e.g., 1.0 ng/mL vs. 0.5 ng/mL).
How do you validate method accuracy for uncommon matrices (e.g., fermented products)?
We perform spike-and-recovery tests (70–120% acceptable range) and matrix-matched calibration curves using client-provided blank matrices. For fermented samples, isotopic internal standards (e.g., ¹³C-labeled caffeic acid) correct for ionization suppression.
How are batch effects minimized in high-throughput studies (200+ samples)?
Each batch includes QC samples (pooled reference material) and internal standards. Inter-batch CV is maintained below 8% through instrument recalibration and column conditioning every 50 injections.
Can you develop methods for novel phenolic acid derivatives (e.g., acylated forms)?
Yes. We synthesize reference standards in-house or collaborate with partners to characterize derivatives via NMR (¹H, ¹³C) prior to LC-MS method optimization. Turnaround time for custom method development is 4–6 weeks.
Do your reports include statistical comparisons between sample groups?
Yes. Advanced bioinformatics options include ANOVA, PCA, and heatmap clustering. For clinical/nutraceutical studies, we provide fold-change analysis with p-values adjusted for false discovery rate (FDR<0.05).
Learn about other Q&A.
Phenolic Acids Analysis Service Case Study
Title: Formulation and Chemical Characterization of Clerodendrum infortunatum Leaf Extract in Relation to Antifungal Activity
Journal: Heliyon
Published: 2018
- Background
- Methods
- Results
- Conclusion
- Reference
This study aimed to develop an eco-friendly botanical fungicide using Clerodendrum infortunatum leaf extract. Researchers performed flash chromatography to isolate active fractions and used LC-MS/MS to identify phenolic acids. A total of seven phenolic acids were detected across different fractions, with concentrations up to 2.17 mg/g. One fraction (F8) showed the highest antifungal activity (ED₅₀ = 46.8 mg/mL) against Phomopsis vexans, a pathogen responsible for brinjal fruit rot.
The study established a strong negative correlation between antifungal activity and total phenol, flavonoid, and phenolic acid content (r = –0.60 to –0.69). Among the identified phenolic acids, benzoic acid and trans-cinnamic acid demonstrated the strongest antifungal effects. The findings highlight the relationship between phytochemical composition and bioactivity, supporting the development of plant-derived fungicides as sustainable alternatives to synthetic agrochemicals.
Clerodendrum infortunatum leaves were collected, shade-dried, and extracted with chloroform using Soxhlet apparatus. The crude extract was fractionated via flash chromatography into ten fractions (F1–F10); eight (F3–F10) were selected for further analysis based on TLC.
Total phenolics and flavonoids were quantified using Folin-Ciocalteu and aluminum chloride assays, respectively. LC-MS/MS (Agilent 6420 Triple Quad) was used to identify and quantify phenolic acids with standard calibration.
A 20% emulsifiable concentrate (EC) formulation was prepared for the extract and fractions. Physicochemical properties were assessed per FAO/WHO guidelines.
Antifungal activity was tested against Phomopsis vexans using the poisoned food technique. Growth inhibition was measured, and ED₅₀ values were calculated using probit analysis. Correlations between phenolic content and antifungal efficacy were evaluated statistically.
Creative Proteomics can provide:
Based on this study, Creative Proteomics can provide:
- Plant extract profiling: Comprehensive phytochemical screening, including LC-MS/MS-based identification and quantification of phenolic compounds.
- Fractionation services: Advanced chromatographic separation (e.g., flash chromatography) for bioactive compound isolation.
- Statistical correlation: Data analysis services including ED₅₀ modeling, probit regression, and correlation coefficient interpretation.
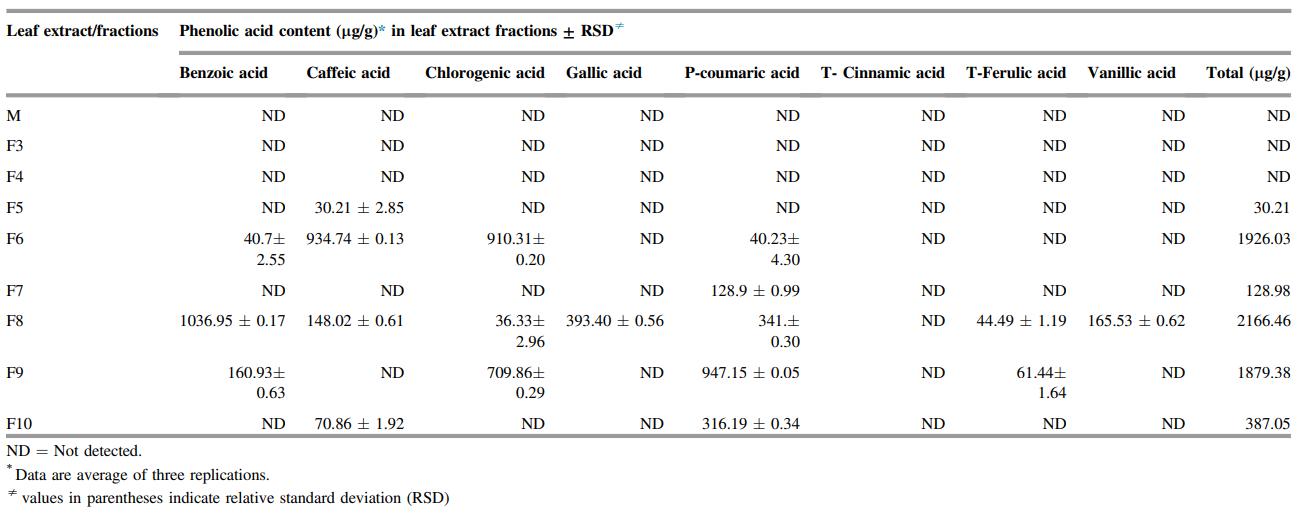
Fraction Yield and Composition: Flash chromatography yielded 8 fractions covering 74.09% of the crude extract. F4 had the highest yield (14.05%), while F8, though lowest in yield (4.19%), had the highest total phenol (48.25 mg GAE/g) and flavonoid (25.29 mg QE/g) content.
Phenolic Acid Profile: LC-MS/MS identified eight phenolic acids. F8 contained the highest total phenolic acids (2166.46 mg/g), dominated by benzoic, gallic, and p-coumaric acids. F6 and F9 followed in phenolic acid content.
Formulation Properties: EC formulations with 20% active ingredient and 3:2 surfactant ratio showed stable emulsification, acceptable pH (6.23–6.89), low foaming, and high thermal/storage stability.
Antifungal Activity: EC formulations from F5–F9 showed stronger inhibition against Phomopsis vexans than the crude extract. F8 had the lowest ED₅₀ (46.8 mg/mL), followed by F9, F6, F5, and F7. Antifungal activity negatively correlated with total phenol (r = –0.694), phenolic acid (r = –0.692), and flavonoid content (r = –0.604), though composition appeared more influential than content alone.
Mechanism Insight: Fractions rich in benzoic and t-cinnamic acids, both lacking hydroxyl groups, exhibited potent antifungal effects likely due to their lipophilic and weak acidic nature, which may disrupt fungal metabolism via oxidative phosphorylation uncoupling and protein complexation.
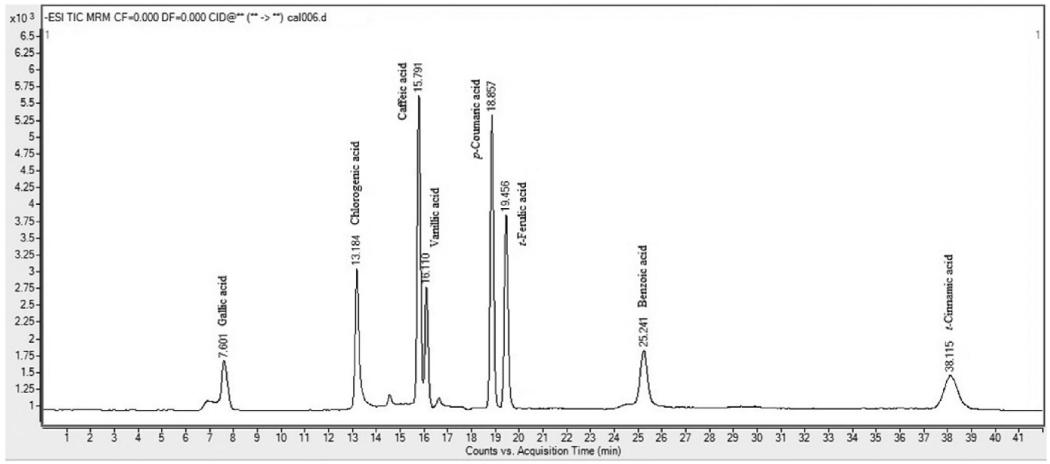 LC-MS/MS chromatogram of mixture of 8 phenolic acids.
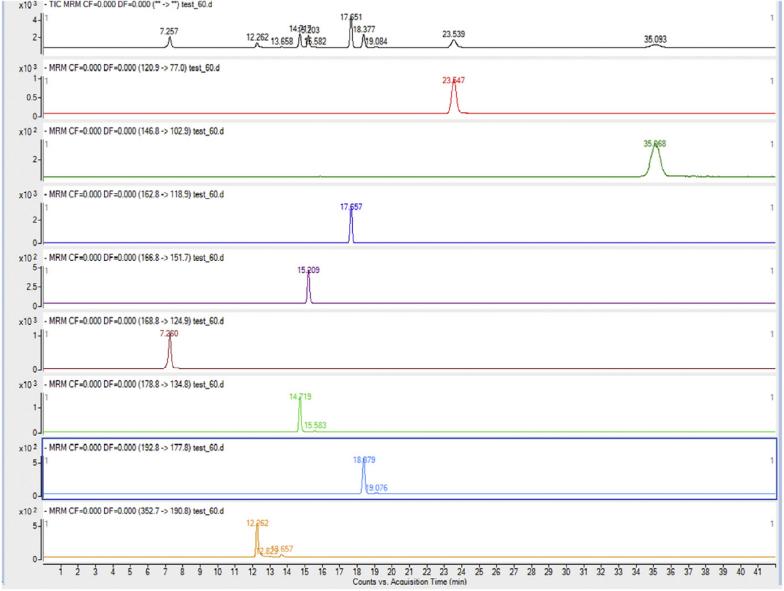 Multiple reactions monitoring transition (Quantifier) of eight standard phenolic acids.
Table. Phenolic acid profile of chloroform extract fraction of Clerodendrum leaves.
Fraction F8 of Clerodendrum infortunatum chloroform extract exhibited the strongest antifungal activity, driven by high benzoic acid content. While total phenol, flavonoid, and phenolic acid content correlated with activity, composition was more critical. EC formulations with optimal stability and potency suggest potential for botanical fungicide development.
Reference
- Saha, Soumen, et al. "Formulation and chemical characterization of Clerodendrum infortunatum leaf extract in relation to anti-fungal activity." Heliyon 4.12 (2018). https://doi.org/10.1016/j.heliyon.2018.e01047
Publications
Here are some publications in Metabolomics research from our clients:

- A comprehensive biochemical characterization of settlement stage leptocephalus larvae of bonefish (Albula vulpes). 2021. https://doi.org/10.1111/jfb.14846
- Pan-lysyl oxidase inhibition disrupts fibroinflammatory tumor stroma, rendering cholangiocarcinoma susceptible to chemotherapy. 2024. https://doi.org/10.1097/HC9.0000000000000502
- Inflammation primes the kidney for recovery by activating AZIN1 A-to-I editing. 2023. https://doi.org/10.1101/2023.11.09.566426
- The Vibrio cholerae type six secretion system is dispensable for colonization but affects pathogenesis and the structure of zebrafish intestinal microbiome. 2021. https://doi.org/10.1128/iai.00151-21
- Resting natural killer cell homeostasis relies on tryptophan/NAD+ metabolism and HIF‐1α. 2023. https://doi.org/10.15252/embr.202256156