Integrated Transcriptomics and Metabolomics Analysis with RNA-seq & LC/GC-MS
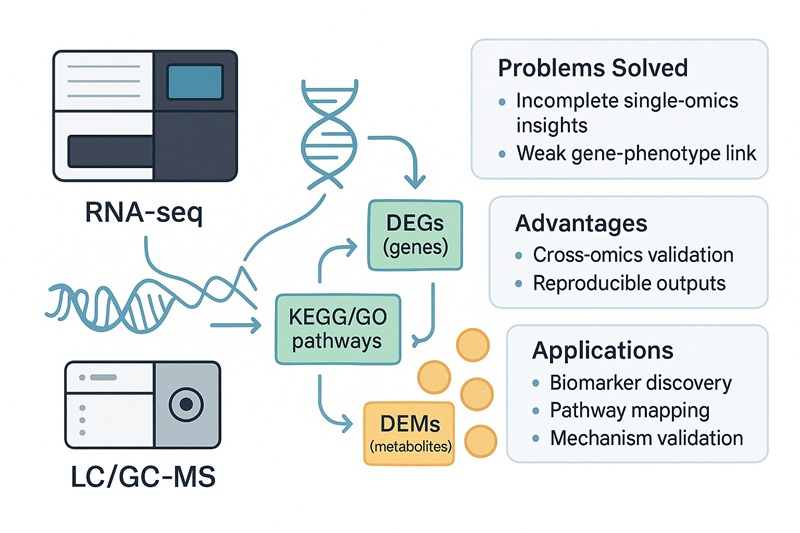
Single-omics studies often provide incomplete or inconsistent conclusions. Our Integrated Transcriptomics and Metabolomics Analysis Service combines RNA-seq with LC/GC-MS profiling to connect gene activity with metabolic changes. This multiomics workflow helps research teams, biotech developers, and CROs uncover regulatory pathways, validate biomarkers, and link molecular signals to phenotypes with greater accuracy.
Problems We Solve for Clients
- Incomplete insights from transcriptomics or metabolomics alone
- Difficulty linking gene expression to metabolic outcomes
- High false-positive rates in biomarker discovery
Our Advantages
- End-to-end transcriptome + metabolome integration
- KEGG/GO pathway mapping with cross-omics validation
- Reproducible, publication-ready deliverables backed by expert bioinformatics
Submit Your Request Now
×
- Why This Service
- Analysis Strategy
- Service Details
- Applications
- Why Us
- Deliverables
- Sample Requirements
- Demo
- FAQs
- Case Study
Why This Service
Transcriptomics captures how genes are expressed, while metabolomics measures the biochemical products of these changes. On their own, each dataset offers only a partial view of biology. Transcriptomics without metabolomics cannot confirm whether altered genes lead to measurable outcomes, and metabolomics alone does not reveal which genes drive those shifts.
Our Integrated Transcriptomics and Metabolomics Analysis Service solves these limitations by linking RNA-seq profiles with LC/GC-MS metabolite data. This combined view strengthens pathway interpretation, reduces false positives, and provides more reliable biomarkers for research in plants, animals, and biomedical models.
Key Benefits
- Holistic insight: connect gene expression with metabolic outcomes in a single workflow
- Improved accuracy: cross-omics validation filters noise and ensures reproducibility
- Actionable data: generate publication-ready figures and pathway maps for high-impact studies
Analysis Strategy
A successful integrated transcriptomics and metabolomics analysis requires careful planning, from study design to data integration. At Creative Proteomics, we follow a stepwise approach that ensures reproducible, biologically meaningful results.
Step 1. Experimental Design
Define a clear research objective such as developmental regulation, stress response, or quality trait formation. For example, to study sugar accumulation during fruit ripening, samples should cover critical timepoints (e.g., 0, 6, 12, 24 hours of treatment), tissues (root, leaf, fruit), or contrasting phenotypes (wild type vs. mutant).
Step 2. Sampling Strategy
- Transcriptomics: ≥3 biological replicates per group
- Metabolomics: ≥6 biological replicates per group
Synchronised sampling across both omics ensures temporal and spatial consistency, reducing variability between datasets.
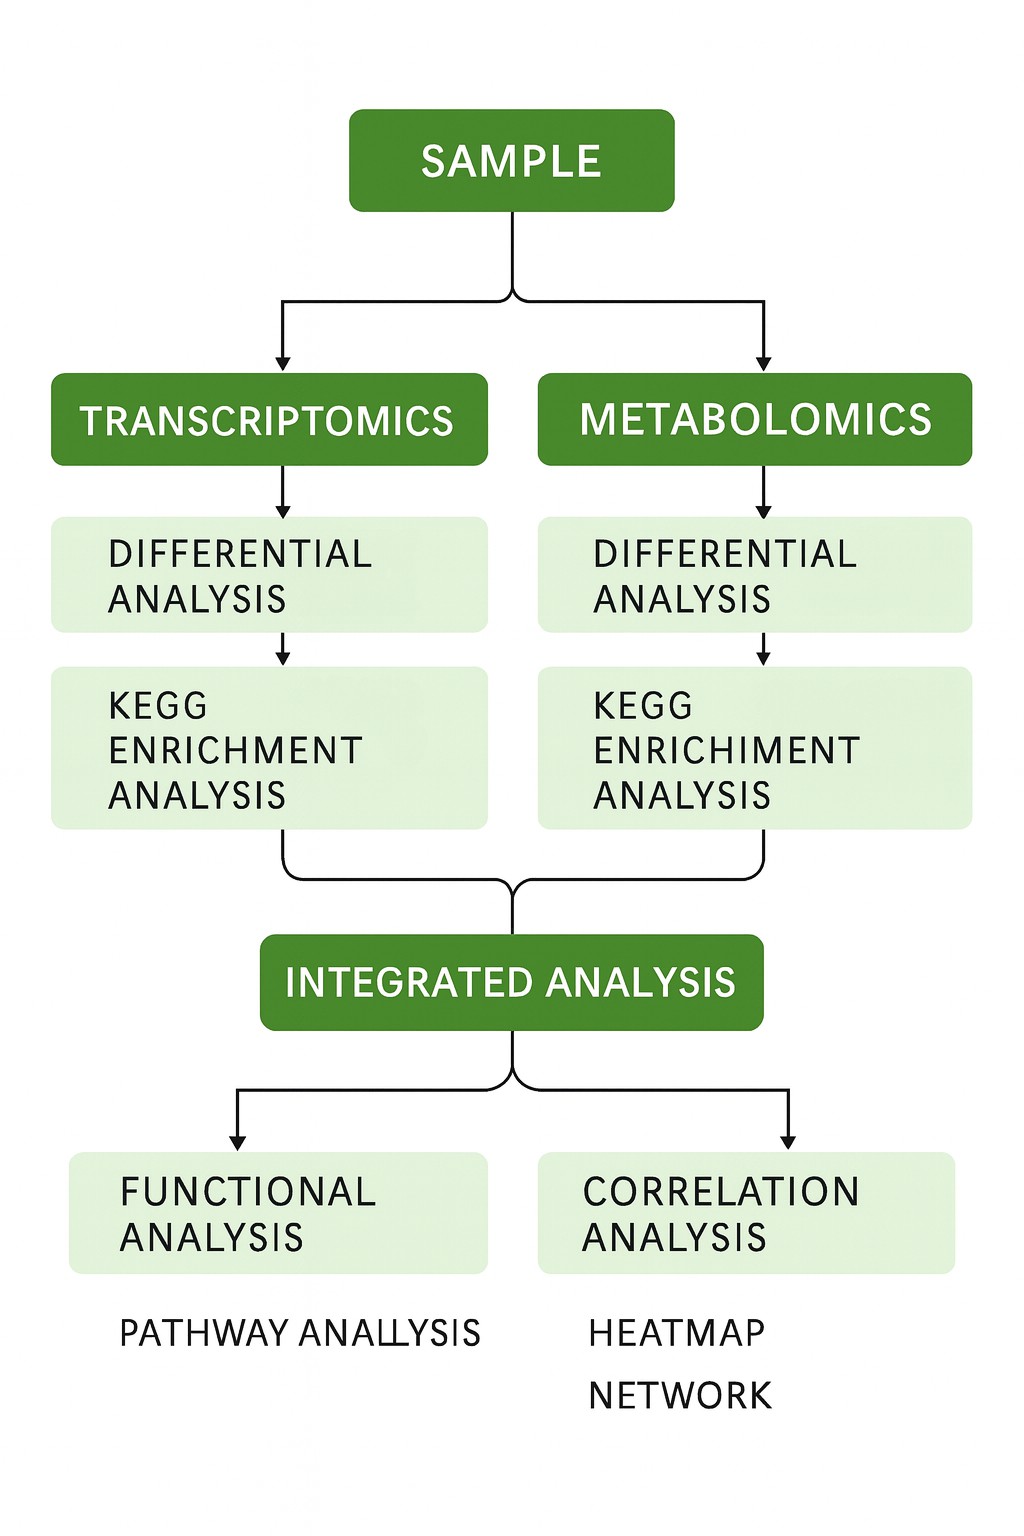
Step 3. Single-Omics Analysis
- Transcriptomics: Quantification of gene expression, identification of differentially expressed genes (DEGs), functional enrichment analysis.
- Metabolomics: Detection of metabolites, identification of differentially accumulated metabolites (DEMs), pathway enrichment.
Step 4. Integrated Multiomics Analysis
- Identify overlapping KEGG pathways enriched in both DEGs and DEMs.
- Calculate correlations between differentially expressed genes and metabolites, and construct correlation networks to identify regulatory hubs.
- Apply machine-learning models to extract drivers of phenotypic changes from large-scale datasets.
- Highlight candidate genes and metabolites that likely shape metabolic responses and link them to phenotypic outcomes.
This integrated workflow connects gene-level regulation with metabolic outputs, helping researchers move from descriptive data to testable hypotheses and actionable biomarkers.
Service Details
Content of Combined Transcriptomics and Metabolomics Analysis
Our service integrates transcriptome and metabolome data into a unified workflow that strengthens biological interpretation. The main analysis content includes:
- Transcriptome Differential Gene Analysis – Identification of differentially expressed genes (DEGs) and their functional annotation.
- Differential Metabolite Analysis – Detection and classification of differentially accumulated metabolites (DEMs).
- Pathway-Based Integration – Mapping DEGs and DEMs onto KEGG and GO pathways to highlight shared biological processes.
- Enzyme–Gene–Metabolite Integration – Linking metabolite-related enzymes with transcriptomic data to build regulatory models.
Technology Platforms
| Category | Capabilities |
|---|---|
| Transcriptomics | - RNA-seq for mRNA, lncRNA, circRNA, and small RNAs - Bulk and single-cell RNA sequencing options - Strand-specific library prep with deep coverage for accurate quantification |
| Metabolomics | - LC-MS and GC-MS for untargeted and targeted metabolomics - Detection of hundreds to thousands of metabolites across diverse classes - Extension to lipidomics for comprehensive metabolic coverage |
| Bioinformatics Integration | - KEGG and GO enrichment analysis - Correlation analysis and Canonical Correlation Analysis (CCorA) - Network construction with WGCNA and pathway overlays |
Creative Proteomics combines RNA-seq sequencing with LC/GC-MS metabolomics platforms to deliver reliable cross-omics data.
Workflow
Sample QC and Processing
- RNA integrity (RIN value) checked before sequencing
- Metabolite stability evaluated during extraction and storage
- Strict criteria for purity, concentration, and reproducibility
Omics Profiling
- RNA-seq using Illumina or equivalent platforms
- Metabolite profiling with high-resolution LC/GC-MS
Differential Analysis
- Identification of DEGs and DEMs between groups
- Functional enrichment of DEGs; metabolite classification
Cross-Omics Integration
- Pathway mapping of shared KEGG/GO terms
- Gene–metabolite correlation analysis (Pearson/WGCNA)
- Consistency testing using CCorA
Data Interpretation
- Network reconstruction linking regulatory genes with metabolites
- Highlighting of key pathways and candidate biomarkers
- Preparation of publication-ready figures and models
Quality Control
- Sequencing QC: base quality scores, mapping rates, read distribution
- Metabolomics QC: retention time stability, signal-to-noise ratio, metabolite identification levels
- Cross-omics QC: replicate correlation, coefficient of variation (CV), internal standard monitoring
- Reporting: all QC metrics are documented and included in the final report
Data Delivery
Clients receive a complete package including raw and processed data, bioinformatics reports, and figures.
- Raw Data: FASTQ files for RNA-seq; raw LC/GC-MS spectra
- Processed Data: DEG and DEM tables with statistical outputs
- Enrichment Results: KEGG/GO annotation, pathway overlays
- Visual Outputs: volcano plots, PCA, heatmaps, correlation networks, pathway diagrams
- Final Report: detailed workflow description, QC summary, key findings, and expert interpretation for research or publication use
All deliverables are optimised for direct use in manuscripts, grant applications, or follow-up validation experiments.
Applications
Plant Research
- Reveal pathways controlling stress tolerance and adaptation
- Analyse sugar, acid, and secondary metabolite changes during fruit ripening
- Support crop breeding, quality improvement, and conservation strategies
Animal and Nutrition Research
- Investigate metabolic regulation of growth and immune function
- Assess nutritional traits in meat, milk, and other animal products
- Guide breeding programs with omics-based biomarkers
Biomedical Research (RUO)
- Define mechanisms of complex diseases by linking genes to metabolites
- Discover and validate biomarkers across transcript and metabolite layers
- Provide data for patient stratification and personalised model development
Pharmaceutical Development
- Characterise drug mechanisms of action and off-target pathways
- Identify and validate therapeutic biomarkers with multiomics support
- Enhance preclinical research through pathway and biomarker evidence
Why Us
Advanced Mass Spectrometry Platforms
Our laboratory is equipped with multiple high-resolution instruments, including the Q Exactive™ series, Orbitrap Exploris™ 480, Orbitrap Fusion Lumos, and Bruker timsTOF Pro2. These platforms ensure accurate detection and reliable quantification across complex metabolite classes.
Comprehensive Databases
Beyond standard resources such as Thermo's mzCloud, Creative Proteomics has built proprietary reference libraries. This includes the OTCML Traditional Chinese Medicine Metabolite Database, which contains over 1,200 authenticated compounds with fragment spectra. These resources improve identification rates and annotation quality.
Expert Data Interpretation
Multiomics datasets are complex. Our bioinformatics team delivers detailed report interpretation, pathway insights, and tailored analysis recommendations to support research decisions and publication goals.
Personalised Visualisation
We continually update our analysis pipelines and plotting tools to provide flexible, customised data visualisation. Clients receive figures optimised for both presentation and journal submission.
Deliverables
At the end of each project, Creative Proteomics provides a concise, publication-ready package that enables researchers to move quickly from data to insight.
- Quality Control Report – sequencing and metabolomics QC metrics documented in detail
- Data Tables – annotated lists of differentially expressed genes (DEGs) and metabolites (DEMs)
- Pathway Enrichment Results – KEGG/GO outputs highlighting shared biological processes
- Visual Figures – volcano plots, PCA, heatmaps, and network diagrams ready for direct use
- Final Report – clear summary of workflow, key findings, and expert interpretation
This streamlined set of deliverables ensures technical rigour without overwhelming clients with unnecessary outputs.
Sample Requirements
| Omics Type | Sample Types Accepted | Recommended Amounts (Typical Range) | Storage & Shipping Conditions |
|---|---|---|---|
| Transcriptomics | Fresh tissue, cultured cells, blood (RNA extraction possible) | ≥30 mg tissue or ≥1×10⁶ cells | Flash freeze in liquid nitrogen, store at –80°C, ship on dry ice |
| Proteomics | Animal/plant tissues, cells, body fluids (serum, plasma, CSF, urine, saliva, etc.) | Tissue: 30–200 mg; Cells: ≥5×10⁶; Plasma/serum: 20–100 μL | Flash freeze, avoid repeated freeze–thaw, ship on dry ice |
Demo

FAQ
What is integrated transcriptomics and metabolomics analysis?
It is a joint analysis method combining RNA-seq–based gene expression profiling with LC/GC-MS metabolite quantification to uncover mechanistic links between genes and metabolites.
Why should I integrate these two omics?
Because transcript changes alone don't guarantee metabolic effects, and metabolite shifts lack upstream regulatory context—the integration strengthens pathway insights, reduces false positives, and reveals drivers of phenotype.
How many replicates are needed for reliable results?
We recommend at least three biological replicates for transcriptomics and six for metabolomics to ensure statistical robustness and reliable cross-omics correlation.
How do you align data across RNA and metabolite scales?
Each dataset is normalized independently (e.g. quantile, z-score), then scaled to permit correlation and multivariate modeling, ensuring comparable data across omics layers.
What if gene expression and metabolite levels disagree?
Discordance is common due to post-transcriptional regulation, enzyme kinetics, or feedback loops. We interpret such cases carefully and use metabolite data to guide which molecular layer is functionally relevant.
Can this service help me discover biomarkers?
Yes. By cross-validating signals at both transcript and metabolite levels and ranking candidates via correlation and network models, you get higher-confidence biomarker candidates for downstream validation.
Can I expand the analysis later to proteomics or lipidomics?
Absolutely. Our modular platform supports further integration with proteomics or lipidomics services when your project needs deeper multiomics context.
Learn about other Q&A.
Case Study: Lgr5-mediated p53 Repression through PDCD5 leads to doxorubicin resistance in Hepatocellular Carcinoma
Journal: Theranostics
Published: 2019
- Main Technology
- Abstract
two-hybrid analysis, Co-immunoprecipitation (Co-IP) and Glutathione-S-transferase (GST) pull-down.
The devastating prognosis of hepatocellular carcinoma (HCC) is partially attributed to chemotherapy resistance. Accumulating evidence suggests that the epithelial-mesenchymal transition (EMT) is a key driving force of carcinoma metastasis and chemoresistance in solid tumors. Leucine-rich repeat-containing G protein-coupled receptor 5 (Lgr5), as an EMT inducer, is involved in the potentiation of Wnt signaling in HCC. This study proposes uncovering the roles of Lgr5 in Doxorubicin (Dox) resistance of HCC to improve treatment efficacy for HCC.
Methods: We investigated the expression and significance of Lgr5 in HCC tissue and different cell lines. The effect of Lgr5 in EMT and Dox resistance was analyzed in HCC cells and implanted HCC tumor models. A two-hybrid analysis, using the Lgr5 gene as the bait and a HCC cDNA library, was used to screen targeted proteins that interact with Lgr5. The positive clones were identified by coimmunoprecipitation (Co-IP) and Glutathione-S-transferase (GST) pull-down. The impact of the interaction on Dox resistance was investigated by a series of assays in vitro and in vivo.
Result: We found that Lgr5 was upregulated and positively correlated with poor prognosis in HCC. Additionally, it functioned as a tumor promoter to increase cell migration and induce EMT in HCC cells and increase the resistance to Dox. We identified programmed cell death protein 5 (PDCD5) as a target gene of Lgr5 and we found that PDCD5 was responsible for Lgr5-mediated Dox resistance. Further analysis with Co-IP and GST pull-down assays showed that the N-terminal extracellular domain of Lgr5 could directly bind to PDCD5. Lgr5 induced p53 degradation by blocking the nuclear translocation of PDCD5 and leading to the loss of p53 stabilization. Lgr5 showed a protection against the inhibition of Dox on the growth of tumor subcutaneously injected. Moreover, Lgr5 suppressed Dox-induced apoptosis via the p53 pathway and attenuated the cytotoxicity of Dox to HCC.
Conclusion: Lgr5 induces the EMT and inhibits apoptosis, thus promoting chemoresistance by regulating the PDCD5/p53 signaling axis. Furthermore, Lgr5 may be a potential target gene for overcoming Dox resistance.
![]() Figure 1. A graphical model for Lgr5-mediated Dox resistance in HCC cell lines.
Figure 1. A graphical model for Lgr5-mediated Dox resistance in HCC cell lines.
Publication

- Zlatkov N, Näsman MEC, Uhlin BE. Metabolic and Morphotypic Trade-Offs within the Eco-Evolutionary Dynamics of Escherichia coli. Microbiol Spectr. 2022
- LAL KRISHAN KUMAR et al,. Impaired phagocytosis of photoreceptor outer segments by RPE in CLN3 disease is a consequence of altered sphingolipid metabolism. Investigative Ophthalmology & Visual Science June 2024, Vol.65, 1565
- Liang, Y.Y., Khalid, K., Le, H.V. et al. MS CETSA deep functional proteomics uncovers DNA repair programs leading to gemcitabine resistance. Nat Commun 16, 4234 (2025).
- Cook E, Langenberg L, Luebbering N, Ibrahimova A, Myers KC, Sabulski A, Dandoy C, Lake K, Ziady A, Lane A, Webster A, Abdullah S, Jodele S, Davies SM. Oxidative Stress Early After Hematopoietic Stem Cell Transplant. Transplant Cell Ther. 2025
References
- Ren, X., Huang, Y., Zhang, L. et al. Integrated analysis of transcriptomics and metabolomics of Dendrobium officinale flowers at different developmental stages. Sci Rep 15, 10342 (2025).
- Xue, J., Lu, D., Wang, S. et al. Integrated transcriptomic and metabolomic analysis provides insight into the regulation of leaf senescence in rice. Sci Rep 11, 14083 (2021).
- Wang X, Liu Y, Han Z, Chen Y, Huai D, Kang Y, Wang Z, Yan L, Jiang H, Lei Y, Liao B. Integrated Transcriptomics and Metabolomics Analysis Reveal Key Metabolism Pathways Contributing to Cold Tolerance in Peanut. Front Plant Sci. 2021