MALDI Imaging Lipidomics Service
Creative Proteomics offers advanced MALDI Imaging Lipidomics services, providing detailed analysis of lipid distribution and composition in biological samples. Using high-resolution mass spectrometry, the service enables the identification and quantification of a wide range of lipid species, such as neutral lipids, glycolipids, cholesterol, fatty acids, and lipid metabolites. This service supports various research areas, including biomedical inquiry, drug development, and biomarker discovery, with applications in disease mechanism studies, tissue analysis, and cellular signaling.
Submit Your Request Now
×
- Define
- What We Provide
- Substances We Detect
- Technology Platforms
- Advantage
- Applications
- Sample Requirements
- FAQs
- Case Study
- Publications
What Is MALDI Imaging Lipidomics
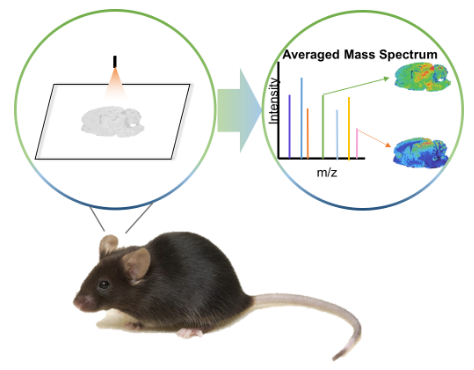
MALDI Imaging Lipidomics is an advanced analytical technique that combines Matrix-Assisted Laser Desorption/Ionization (MALDI) Mass Spectrometry Imaging (MSI) with lipidomics to study the spatial distribution and composition of lipids in biological samples. In modern life sciences and medical research, lipids are essential components of cell membranes, signaling molecules, and energy storage. Their diverse structures and functions, however, pose significant challenges in analysis. Traditional methods often fail to reveal the precise spatial localization of lipids within tissues, making it difficult to understand their roles in biological processes and diseases.
MALDI imaging solutions address this limitation by enabling researchers to generate detailed molecular maps of lipid distribution directly from tissue sections. This imaging technique provides spatial lipidomics data, offering insights into the localization, types, and relative abundances of lipids in their native environments. By integrating MALDI-MSI with lipidomics, this approach allows scientists to explore the intricate relationship between lipid molecules, cellular processes, and disease mechanisms.
Through MALDI Imaging, researchers can visualize how lipids are distributed at the tissue, cellular, or even subcellular level, which is invaluable for understanding their involvement in health and disease. The ability to map lipids in situ is crucial for biomedical applications, such as drug development, disease diagnosis, and understanding metabolic pathways. Ultimately, MALDI Imaging Lipidomics is revolutionizing the way lipids are studied, providing a comprehensive view of their roles in both normal physiology and pathological conditions.
Our MALDI Imaging Lipidomics Service
Creative Proteomics provides a well-established solution of MALDI-Imaging. Up to a thousand lipid species can be detected, and the result provides both molecular–histological maps from the localization and identification of lipid biomolecules based on mass-to- charge ratio (m/z). Imaging data may be normalized to the total ion current to calculate lipid abundances and subject to statistical test appropriate for the experimental questions. Creative Proteomics provides reliable, rapid and cost-effective lipidomics MALDI-Imaging service to meet your different needs.
Substances We Can Detect
| Analyzable Substance | Description |
|---|---|
| Neutral Lipids | Includes triglycerides and phospholipids. |
| Glycolipids | Comprises glycosphingolipids and glycerophospholipids. |
| Cholesterol & Derivatives | Encompasses cholesterol and its various derivatives. |
| Fatty acids | Includes both saturated and unsaturated fatty acids. |
| Lipid metabolites | Covers oxidized lipids, lipid peroxides, lipid-based drugs, and their metabolites. |
| Glycerophospholipids (GPL) | A type of phospholipid, typically analyzed in lipidomics. |
| Sphingomyelins (SM) | A class of sphingolipids, including sphingomyelins. |
| Sulfatides (ST) | Lipids containing sulfate groups, analyzed by MALDI-MSI. |
Technology Platforms Used for MALDI Imaging Lipidomics Analysis
Bruker UltrafleXtreme MALDI-TOF/TOF Mass Spectrometer
The Bruker UltrafleXtreme is one of the most commonly used MALDI-TOF/TOF systems for imaging lipid distributions. This system excels in producing high-resolution, high-sensitivity mass spectrometry images, enabling the visualization of lipid distributions in complex tissue samples with precision.
Key Features:
- High resolution for precise lipid localization at the cellular level
- Advanced TOF/TOF functionality, allowing both accurate mass determination and structural information for lipid identification
- Fast data acquisition with minimal sample preparation, ideal for high-throughput lipidomic studies

Waters SYNAPT G2-Si HDMS System
The Waters SYNAPT G2-Si system integrates Ion Mobility Spectrometry (IMS) with traditional MALDI-TOF to provide even higher resolution and better separation of lipid species based on both their mass and shape. This added dimension of analysis helps to separate lipids that may overlap in traditional mass spectrometry, providing more detailed and comprehensive lipidomic profiles.
Key Features:
- Combines MALDI with Ion Mobility Spectrometry (IMS) for enhanced lipid separation and identification
- High resolution and sensitivity for complex lipid analysis in biological tissues
Advanced software for lipid annotation and quantification, helping researchers gain deeper insights into lipid behavior in health and disease

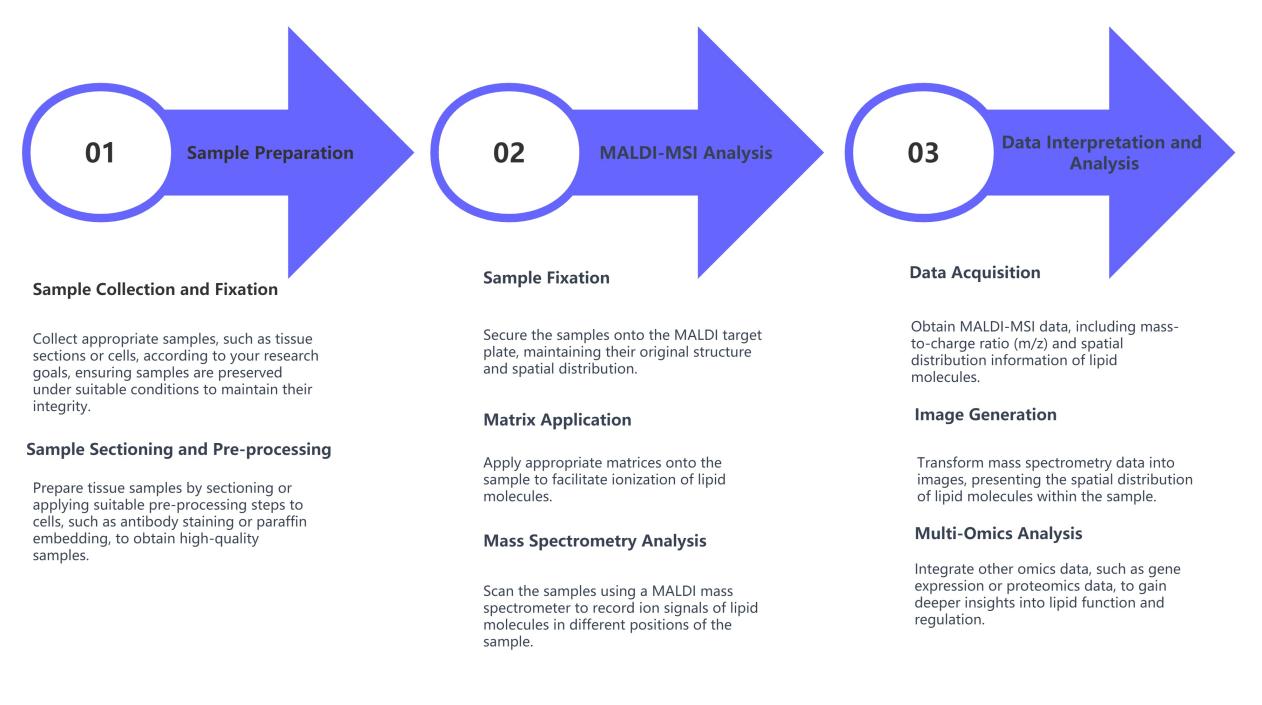
MALDI-MSI Lipidomics Service Workflow
Feature and Advantage of MALDI Imaging Lipidomics Service
- Spatial Precision: At the microscale, MALDI-MSI furnishes lipid analyses upon tissue sections or sample interfaces, effectively unveiling disparities in lipid distribution among distinct cell lineages and regions.
- Enhanced Throughput: Through the capability of simultaneous analysis of multiple samples or lipid entities, MALDI-MSI bolsters high-throughput proficiency, thereby expediting research strides.
- Unlabelled Insight: In contrast to methodologies such as immunohistochemistry, the unlabelled nature of MALDI-MSI circumvents the need for specific markers, mitigating sample manipulation and extraneous influence.
- Holistic Profiling: With the capacity to concurrently identify and quantify diverse lipid species, spanning neutral lipids, glycolipids, cholesterol, and more, MALDI-MSI furnishes an all-encompassing lipidomic panorama.
- Biomarker Prospects: Deployed as a potential biomarker discovery tool, MALDI-MSI plays a pivotal role in diagnostics and disease inquiry, especially when scrutinizing lipid perturbations linked to pathological conditions.
- Insight into Biological Function: Akin to peering into a topographical atlas of lipid molecules within living organisms, MALDI-MSI facilitates an in-depth comprehension of lipids' involvement in cellular signaling, metabolic modulation, and the intricacies of disease processes.
- Abundant Molecular Insight: A bounteous array of chemical details is uncovered by MALDI-MSI, elucidating facets like fatty acid chain lengths and degrees of saturation, ultimately fostering a profound exploration of lipid diversity.
- Tailored Experimentation Schemes: Acknowledging the idiosyncrasies inherent to each research endeavor, our commitment extends to crafting bespoke experimental designs. Adapted to your research prerequisites, we fine-tune experimental parameters to safeguard the acquisition of top-tier data quality.
Applications of MALDI-MSI Lipidomics
Biomedical Inquiry
MALDI-MSI lipidomics helps study lipid distribution in physiological changes and disease states, aiding in disease mechanism understanding, particularly in oncology, cardiovascular diseases, and neurodegenerative disorders.
Pharmaceutical Dynamics
It assists in understanding drug distribution, metabolism, therapeutic efficacy, and transformation within tissues, playing a critical role in drug development and evaluation.
Histological Probing
With high spatial resolution, MALDI-MSI lipidomics analyzes lipid distribution in tissue slices, providing insights into tissue architecture and function.
Signaling Terrain Elucidation
It helps reveal the role of lipids in cellular signaling, metabolic pathways, and cellular functions.
Glycolipid Exploration
MALDI-MSI lipidomics studies the distribution, structure, and function of glycolipids, offering insights into their roles in physiological and pathological conditions.
Biomarker Revelation
It aids in discovering biomarkers for early diagnosis, disease monitoring, and prognosis.
Sample Requirements for MALDI Imaging Lipidomics Analysis
| Sample Type | Sample Size | Preparation Method | Recommended Storage | Notes |
|---|---|---|---|---|
| Tissue Sections | 5-10 µm thickness | Cryosectioning or paraffin embedding | -80°C for cryosections, room temperature for paraffin | Ensure sections are flat and mounted on conductive slides |
| Cell Culture Samples | 106 - 107 cells | Cells fixed on glass slides or membrane | -80°C for frozen cells, 4°C for fixed cells | Cells should be fixed using formalin or other compatible fixatives |
| Plasma or Serum | 50 µL | Direct MALDI spot analysis or drop deposition | -80°C for storage | No special preparation required beyond aliquoting |
| Organs (e.g., liver, brain) | 1-2 cm2 tissue section | Cryosectioning or formalin fixation | -80°C for frozen tissue, 4°C for formalin-fixed tissue | Ensure samples are fresh and stored appropriately |
| Tumor Samples | 1-2 cm2 tissue section | Cryosectioning or formalin fixation | -80°C for frozen tissue, 4°C for formalin-fixed tissue | Maintain tumor integrity and avoid degradation |
| Bacterial/Yeast Samples | 106 - 107 cells | Direct analysis after centrifugation and plating | -80°C for storage | Ensure even distribution on the MALDI target plate |
FAQs
How does MALDI-MSI lipidomics differentiate between various lipid species in complex biological samples?
MALDI-MSI lipidomics utilizes mass spectrometry to ionize lipid molecules from tissue samples without the need for labeling. The matrix assists in desorbing and ionizing lipids, while the mass spectrometer measures the mass-to-charge ratio (m/z) of the ions. By analyzing the m/z values and comparing them to known lipid databases, MALDI-MSI can differentiate between various lipid species, such as phospholipids, glycolipids, and cholesterol derivatives. The spatial distribution of each lipid species is then mapped across the sample, providing both compositional and topographical information. This allows researchers to examine lipid diversity and localization in tissue sections at high resolution.
What kind of spatial resolution can be achieved with MALDI-MSI for lipid analysis?
The spatial resolution achievable with MALDI-MSI largely depends on the capabilities of the mass spectrometer and the quality of sample preparation. Typically, spatial resolutions ranging from 20 µm to 50 µm are achievable in standard MALDI-MSI systems. However, some advanced systems with higher laser precision or specialized optics can achieve even finer resolutions, down to 5 µm. This high spatial resolution enables the detection of lipid distribution at the cellular and subcellular levels, which is critical for understanding the role of lipids in cellular processes, disease progression, and tissue-specific functions.
Can MALDI-MSI lipidomics be used for quantitative analysis of lipid species?
While MALDI-MSI is primarily a qualitative technique, it can also provide semi-quantitative data. The intensity of the ion signals in MALDI-MSI correlates with the abundance of lipid species, allowing researchers to estimate relative lipid concentrations across different regions of the tissue. For more accurate quantification, calibration standards or label-free quantitative methods (such as using the total ion current or normalizing to a known reference lipid) can be employed. Additionally, advanced techniques like the use of isotopically labeled internal standards or external calibration curves can improve the accuracy and precision of lipid quantification in MALDI-MSI experiments.
How does MALDI-MSI lipidomics compare to other lipid analysis techniques like liquid chromatography-mass spectrometry (LC-MS)?
MALDI-MSI lipidomics offers several advantages over traditional techniques like LC-MS, particularly in terms of spatial resolution. While LC-MS excels in quantifying lipid species and analyzing complex lipid mixtures, it does not provide spatial information about the distribution of lipids within biological samples. MALDI-MSI, on the other hand, generates molecular distribution maps, enabling researchers to directly visualize lipid localization in tissue sections. However, LC-MS typically offers better sensitivity and quantification, especially for low-abundance lipids. A complementary approach that combines MALDI-MSI for spatial analysis and LC-MS for detailed quantification can provide a more comprehensive lipidomic profile.
Learn about other Q&A.
Case Study
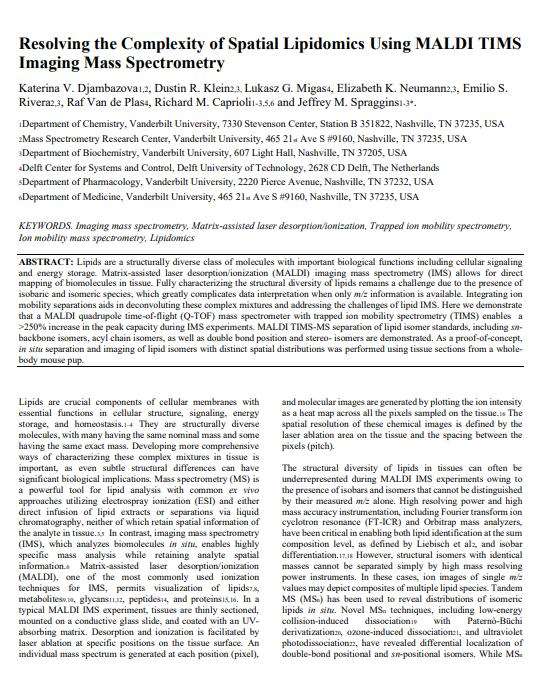
Resolving the complexity of spatial lipidomics using MALDI TIMS imaging mass spectrometry.
Journal: Analytical Chemistry
Published: 2020
- Background
- Materials & Methods
- Results
Lipids play essential biological roles, including cellular signaling, energy storage, and membrane structure. Due to their structural diversity, analyzing lipids in tissue is challenging, particularly because many lipids have the same exact or nominal mass, making it difficult to differentiate them using traditional mass spectrometry techniques. Imaging mass spectrometry (IMS), especially Matrix-assisted laser desorption/ionization (MALDI), enables the visualization of lipids in situ within tissues. However, the presence of isobaric and isomeric species complicates the interpretation of data based solely on mass-to-charge (m/z) ratios.
To address this, integrating ion mobility spectrometry (IMS) with MALDI has shown potential for improving lipid analysis. Specifically, trapped ion mobility spectrometry (TIMS) has emerged as a powerful technique for increasing peak capacity and separating complex lipid mixtures. This study demonstrates the application of TIMS in MALDI IMS to improve lipid isomer separation and spatial mapping, which enhances lipidomics research and provides better insights into lipid distribution in tissues.
Materials:
Chemicals: 1,5-diaminonaphthalene (DAN), 2',5'-dihydroxyacetophenone (DHA) from Sigma-Aldrich; HPLC-grade solvents (acetonitrile, methanol, ethanol, chloroform, tetrahydrofuran) from Fisher Scientific; Lipid standards from Avanti Polar Lipids.
Sample Preparation:
- Tissue: C57BL/6 control mouse pup (one-week old) was snap frozen at -80°C, shaved over dry ice, and cryosectioned (20 µm thickness) using a Leica CM3050 S cryostat. Sections were mounted on indium tin oxide-coated glass slides and coated with a 15 mg/mL solution of DAN in THF via TM Sprayer (HTX Technologies).
- Lipid Standards: Lipid standards (5 mg/mL in chloroform) were dried under nitrogen, dissolved in 80% methanol (1.0 mg/mL), mixed with DHA matrix (90% acetonitrile), and spotted on a steel target (MTP AnchorChip).
MALDI TIMS-IMS:
Experiments were performed on a prototype timsTOF fleX mass spectrometer (Bruker Daltonik). Imaging was carried out in TIMS mode with ion transfer time of 100 µs, pre-pulse storage time of 8 µs, and TIMS funnel RFs of 450 Vpp (accumulation) and 400 Vpp (analysis). Data were collected in positive ion mode (m/z 50-1500), with a spatial resolution of 50 µm and 200 shots per pixel at 48% laser power. The TIMS EFG scan time was 650 ms with reduced mobility (1/K0) range of 1.370 – 1.520 Vs/cm².
Custom in-house software for TIMS data visualization. Lipid identifications were made using high mass accuracy and LIPIDMAPS lipidomics gateway.
MALDI FT-ICR IMS:
Data from whole-body mouse pup tissue were acquired using a 15T MALDI FT-ICR mass spectrometer (Bruker Daltonics). Images were generated with 50 µm laser settings and a spatial resolution of 150 µm using 300 laser shots per pixel at 46% laser power. The m/z range was 460-1500, with resolving power ~600,000 at m/z 760.
Data Processing:
- Data Export: Data were exported in a custom binary format. A mean mass spectrum was generated and peak-picked, identifying the 400 most intense ions. Ion mobility-selected ion images were processed to examine conformational-specific localization.
- Peak Capacity: Calculated by determining the area under the curve (AUC) and full-width at half-maximum (FWHM) for each spectral feature. Ion mobility profiles were fitted with Gaussian peaks to represent multi-conformational species.
TIMS Peak Capacity
The integration of TIMS into imaging mass spectrometry (IMS) significantly enhances peak capacity, a measure of the number of detectable features in a mass spectrum. A comparison was made between mass spectra obtained from whole-body mouse pup tissue with and without the incorporation of TIMS. Without ion mobility separation, the mass spectrum from the m/z 680-880 range had a peak capacity of 247. However, with the addition of a 650 ms TIMS separation, the peak capacity increased to 916, marking an increase of over 250%. This improvement is attributed to the ability of TIMS to resolve isobaric and isomeric species, which overlap in the m/z dimension without mobility separation. For example, the overlap of an M+2 isotopologue of one lipid species with the monoisotopic peak of another lipid with one less double bond can lead to mass errors. TIMS resolves these overlaps, providing more accurate identification of lipid species.
Separation of Lipid Isomer Standards
Lipid isomers, which share the same chemical formula but differ in structure, pose a challenge in IMS due to their identical m/z values. TIMS resolves these isomeric species by separating them based on their ion mobility. The study used standards representing various types of isomeric differences, including sn-position, acyl chain composition, and double bond characteristics. For example, differences in the sn-position of acyl chains in bis(monoacylglycerol)phosphates (BMPs) and phosphatidylglycerols (PGs) were resolved using TIMS, allowing for differentiation of their biological roles and cell locations.
Subtle structural differences, such as those in acyl chain composition or double bond positions, were also assessed. Lipids with cis and trans double bonds exhibited different ion mobility values, with cis double bonds causing a more compact structure due to their bent conformation. The study found that the more compact structure of cis double bonds and variations in the position and stereochemistry of double bonds could be separated effectively by TIMS. This demonstrated the potential for in situ lipid analysis and spatial mapping in biological samples.
MALDI TIMS in Whole-body Mouse Pup Tissue
MALDI TIMS-IMS was utilized to visualize the distribution of lipid isomers in whole-body mouse pup tissue. For example, at m/z 718.58, three distinct species were resolved in the extracted ion mobilogram. The mobility-separated ions showed unique spatial distributions across various organs, highlighting the power of TIMS for in situ imaging of lipid species. Complementary FT-ICR MS data confirmed that these species were isomers and provided high-confidence identification of these lipids, further validating the effectiveness of TIMS in lipid analysis.
 The added dimension of ion mobility helps address spectral ambiguities to show how the double bond ambiguity is resolved for the ion of m/z 848.55.
 Extracted ion mobilograms of MALDI-generated ions of isomeric lipid standards are shown for both negative
 TIMS enables the separation of lipid isomers in whole-body mouse pup tissues.
Reference
- Djambazova, Katerina V., et al. "Resolving the complexity of spatial lipidomics using MALDI TIMS imaging mass spectrometry." Analytical Chemistry 92.19 (2020): 13290-13297.
- Experimental microbial dysbiosis does not promote disease progression in SIV-infected macaques. 2018. https://doi.org/10.1038/s41591-018-0132-5
- Glucosylceramide is essential for Heartland and Dabie bandavirus glycoprotein-induced membrane fusion. 2023. https://doi.org/10.1371/journal.ppat.1011232
- Microbial dysbiosis associated with impaired intestinal Na+/H+ exchange accelerates and exacerbates colitis in ex-germ free mice. 2018. https://doi.org/10.1038/s41385-018-0035-2
- Evidence for phosphate-dependent control of symbiont cell division in the model anemone Exaiptasia diaphana. 2024. https://doi.org/10.1128/mbio.01059-24
- Loss of G0/G1 switch gene 2 (G0S2) promotes disease progression and drug resistance in chronic myeloid leukaemia (CML) by disrupting glycerophospholipid metabolism. 2022. https://doi.org/10.1002/ctm2.1146
Publications
Here are some publications in proteomics research from our clients:


