Discover Biomarkers with Integrated Transcriptomic, Proteomic, and Metabolomic Analysis Service
Single-omics studies often provide incomplete or inconsistent results. By combining transcriptomics, proteomics, and metabolomics, Creative Proteomics delivers a multi-layered analysis that connects gene activity, protein function, and metabolic changes. This multiomics approach helps researchers, pharma teams, and CROs uncover regulatory pathways, validate biomarkers, and build a reliable genotype-to-phenotype link.
Problems We Solve for Clients
- Limited conclusions from single-omics experiments
- Difficulty connecting molecular mechanisms to biological phenotypes
- High false-positive rates in biomarker discovery
Our Advantages
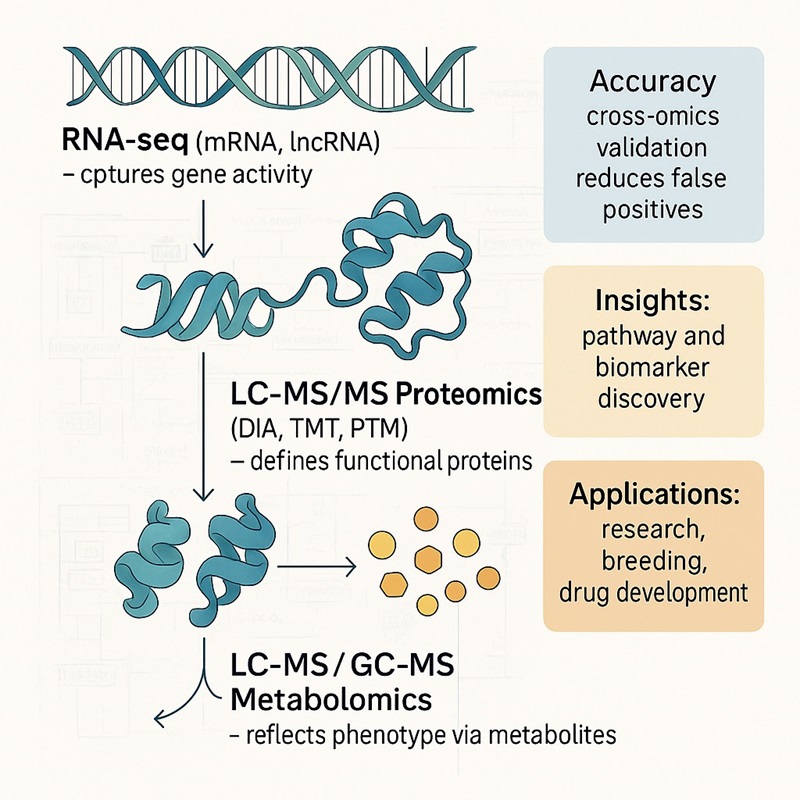
- End-to-end multiomics integration: RNA-seq, LC-MS/MS proteomics, and LC/GC-MS metabolomics
- Cross-omics correlation improves accuracy and reproducibility
- Pathway and biomarker discovery with publication-ready deliverables
Submit Your Request Now
×
- Why This Service
- Analysis Strategy
- Service Details
- Deliverables
- Applications
- Why Us
- Platforms & Requirement
- Demo
- FAQs
- Case Study
Why Choose Integrated Transcriptomic, Proteomic, and Metabolomic Analysis?
Multiomics integration provides a complete view of biological systems that single-omics cannot achieve. By combining transcriptomics, proteomics, and metabolomics, researchers can directly link gene expression, protein function, and metabolic outcomes. This approach helps overcome common challenges in discovery research and product development.
Holistic perspective: Capture molecular changes at RNA, protein, and metabolite levels in one pipeline.
Improved accuracy: Cross-omics validation reduces false positives and increases reproducibility.
Pathway insights: Identify shared KEGG and GO pathways across omics layers for mechanistic clarity.
Biomarker discovery: Detect and validate biomarkers supported by multi-layer evidence.
Actionable outputs: Generate publication-ready data that supports plant, animal, biomedical, and pharmaceutical studies.
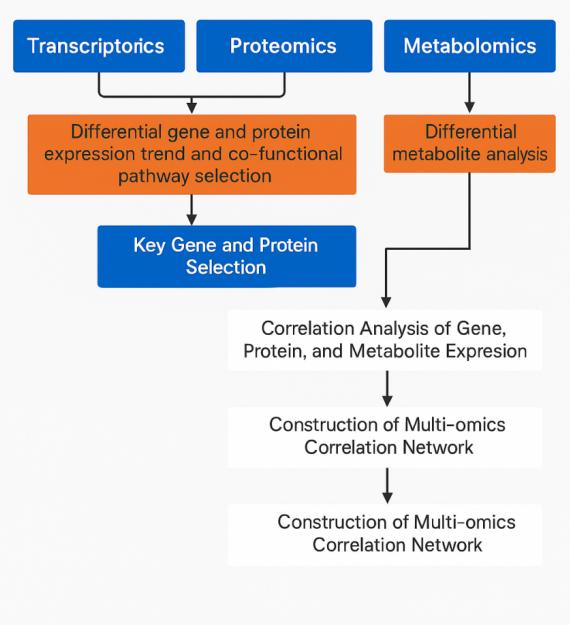
Joint Analysis Strategy
Integrating transcriptomics, proteomics, and metabolomics requires a structured approach. Creative Proteomics applies advanced bioinformatics and statistical methods to ensure reliable and reproducible multiomics integration.
Our strategy begins with differential molecules at RNA, protein, and metabolite levels. We then:
- Map overlapping pathways to identify shared regulatory circuits.
- Build correlation networks to trace regulatory cascades.
- Highlight candidate biomarkers supported by cross-omics evidence.
- Deliver pathway-based interpretations that explain phenotype–genotype connections.
Service Details
Creative Proteomics provides an end-to-end multiomics service, combining sequencing and mass spectrometry platforms with advanced bioinformatics. Our integrated transcriptomic, proteomic, and metabolomic analysis is designed to deliver reproducible, publication-ready results.
Technology Platforms
| Platform | Capabilities |
|---|---|
| Transcriptomics |
|
| Proteomics |
|
| Metabolomics |
|
Workflow
Sample QC and Processing – Rigorous quality checks to ensure integrity and comparability
Omics Profiling – RNA-seq, LC-MS/MS proteomics, and LC/GC-MS metabolomics
Differential Analysis – Identify DEGs, DEPs, and DEMs across groups
Cross-Omics Correlation – Link expression trends across RNA, proteins, and metabolites
Pathway and Network Mapping – KEGG/GO enrichment, KGML pathway reconstruction
Biomarker Discovery – Feature ranking, Random Forest, and ROC validation
Data Integration and Reporting – Final outputs include publication-ready figures and detailed interpretation
![]()
Analysis Content And Workflow
| Category | Analysis Provided |
|---|---|
| Data Processing | Data quality control |
| Differential Analysis | Differential expression analysis of mRNA, protein data, and metabolomic data |
| Transcriptome–Proteome Integration | mRNA and protein correlation analysis mRNA and protein correlation result interactions analysis |
| Functional Annotation | Target gene GO annotation, KEGG enrichment analysis GO annotation and KEGG enrichment analysis of associated proteins |
| Proteomics Networks | Protein interaction network diagram |
| Metabolomics Analysis | Differential expression metabolite analysis and Pearson correlation coefficient analysis Differential metabolite classification |
| Multi-Omics Integration | Combined mRNA, protein, and metabolome analysis Pathway integration analysis, KEGG annotation-based screening of differentially expressed metabolites |
| Pathway & Clustering | mRNA, protein, and metabolite pathway statistics and cluster analysis |
| Systems-Level Modeling | Regulatory network construction |
![]()
Deliverables
- Comprehensive technical report with QC metrics
- Annotated tables of DEGs, DEPs, and DEMs
- Pathway enrichment outputs and KEGG/GO annotations
- Correlation heatmaps, volcano plots, PCA/O2PLS models
- Regulatory and correlation network diagrams
- Optional biomarker validation with AUC scoring
- Expert consultation to review findings and guide next steps
Applications
Integrated multiomics analysis supports diverse projects in plant, animal, biomedical, and pharmaceutical research. By combining transcriptomics, proteomics, and metabolomics, Creative Proteomics helps researchers uncover regulatory mechanisms, validate biomarkers, and generate high-value data for publication or product development.
Plant Research
- Investigate biotic and abiotic stress responses
- Characterise growth, development, and metabolic pathways
- Identify active compound pathways in medicinal plants
- Support crop breeding, yield improvement, and conservation studies
Animal Research
- Explore disease mechanisms and immune regulation
- Analyse nutritional quality in meat and milk
- Support animal breeding and genetic improvement programs
Biomedical Research
- Define molecular mechanisms of complex diseases
- Discover and validate cross-omics biomarkers
- Support disease typing, patient stratification, and personalised research models
- Provide data-driven insight into embryonic and developmental biology
Pharmaceutical Research
- Characterise drug mechanisms of action and off-target effects
- Identify and validate drug targets across multiple omics layers
- Support preclinical studies with biomarker and pathway-based evidence
- Evaluate drug efficacy using integrated RNA, protein, and metabolite profiling
Reporting Standards
- Publication-ready figures suitable for high-impact journals
- Exportable formats (Excel, PDF, image files) for direct use in manuscripts or presentations
- Interpretation focused on actionable insights: regulatory cascades, candidate biomarkers, and phenotype–genotype links
Why Creative Proteomics?
Creative Proteomics is a trusted CRO partner with extensive experience in proteomics, metabolomics, and multiomics integration. Our platforms, technical expertise, and commitment to quality ensure reliable results that support high-impact research and product development.
Our Strengths
Proven Experience: Delivering proteomics and metabolomics services to academic, biotech, and pharma clients worldwide
Advanced Platforms: State-of-the-art RNA-seq, high-resolution LC-MS/MS, and LC/GC-MS platforms for reproducible multiomics profiling
Expert Bioinformatics: Dedicated data scientists specialising in KEGG/GO enrichment, pathway mapping, and cross-omics network analysis
Quality and Reproducibility: Strict sample QC and validated workflows ensure consistent, publication-ready outputs
Collaborative Support: One-to-one consultation to interpret results, plan validation, and design follow-up experiments
Trusted by Global Researchers
Our services have supported:
- Plant and crop stress tolerance studies
- Animal health and nutritional trait projects
- Biomarker and disease mechanism discovery in biomedical research
- Drug development programs in pharmaceutical pipelines
Sample Requirements
| Omics Type | Sample Types Accepted | Recommended Amounts (Typical Range) | Storage & Shipping Conditions |
|---|---|---|---|
| Transcriptomics | Fresh tissue, cultured cells, blood (RNA extraction possible) | ≥30 mg tissue or ≥1×10⁶ cells | Flash freeze in liquid nitrogen, store at –80°C, ship on dry ice |
| Proteomics | Animal/plant tissues, cells, body fluids (serum, plasma, CSF, urine, saliva, etc.) | Tissue: 30–200 mg; Cells: ≥5×10⁶; Plasma/serum: 20–100 μL | Flash freeze, avoid repeated freeze–thaw, ship on dry ice |
| Metabolomics | Serum, plasma, urine, tissues, cell pellets, culture medium | Serum/plasma: ≥200 μL; Urine: ≥1 mL; Tissue: ≥50 mg | Store at –80°C, avoid degradation, ship on dry ice |
Demo

Frequently Asked Questions (FAQ)
What is multi-omics integration?
Multi-omics integration means combining data from transcriptomics, proteomics, and metabolomics to generate a unified biological view. This approach lets you see how gene expression (RNA) translates into proteins and downstream metabolites. It reveals regulatory relationships and pathway activities that single-omics alone cannot resolve.
Why should I integrate transcriptomics with proteomics and metabolomics?
Because each omics layer provides unique insight: transcriptomics captures gene activity, proteomics reveals functional protein output, and metabolomics shows the resulting biochemical effects. Integrating them helps validate key signals, reduce noise, and generate stronger biomarkers or hypotheses for downstream work.
What challenges arise when combining these data types?
Challenges include differences in data scale, measurement noise, and missing values across datasets. Normalization and alignment methods (e.g. z-score, quantile, log transform) are needed to harmonise them. Also, overfitting due to high dimensionality and biological variability must be managed carefully.
How do you handle different scales in transcriptomics, proteomics, and metabolomics datasets?
We apply per-dataset normalization (e.g. log transform for metabolites, quantile normalization for RNA) and then further scale each dataset to a common reference (e.g. z-scores). That ensures meaningful comparisons and integration across omics layers.
Can integrated multiomics data help me discover reliable biomarkers?
Yes. By combining evidence from RNA, protein, and metabolite levels, you reduce false positives and increase confidence in candidates. Machine-learning approaches such as random forest + ROC validation help prioritize biomarkers supported across layers.
What is the typical workflow for multiomics analysis?
The workflow begins with sample collection and QC, followed by individual omics profiling (RNA-seq, LC-MS/MS proteomics, LC/GC-MS metabolomics), then preprocessing (filtering, normalization), integration analyses (correlation, multivariate modeling, pathway mapping), and finally biological interpretation, networks, and biomarker prioritization.
How do you interpret discordant signals—when RNA and protein levels don't match?
Discordance is common due to post-transcriptional regulation, protein degradation, or translational control. We examine such discrepancies to highlight key regulatory nodes, and integrate metabolomics to further resolve which layer drives phenotypic effects.
How reproducible are multiomics studies?
Reproducibility depends on strong experimental design, technical replicates, and robust statistical validation. We use metrics like coefficient of variation (CV) and cross-omics consistency to assess reliability across layers and repeat experiments when needed.
Learn about other Q&A.
Client Case Study: Multiomics Reveals Trade-Offs in E. coli Pathogenic Strains
- Background
- Objective
- Methods
- Key Findings
- Impact
Escherichia coli is a genetically diverse species, ranging from harmless commensals to invasive pathogens. Certain neonatal meningitis-causing E. coli (NMEC) strains exhibit unusual phenotypes, including the ability to utilize citrate under aerobic conditions or to adopt filamentous morphologies. These atypical traits raise fundamental questions about bacterial adaptation and metabolic trade-offs in host environments.
The study aimed to investigate how two NMEC strains, IHE3034 and RS218, maintain distinct and stable phenotypes—citrate fermentation versus filamentous growth—and to determine whether these traits are linked through underlying proteomic and metabolomic mechanisms.
Researchers applied an integrated transcriptomic, proteomic, and metabolomic approach:
Proteomics: Label-free LC–MS/MS profiling identified >1,700 proteins, revealing distinct expression signatures between the two strains.
Metabolomics: Untargeted LC-MS compared metabolic pathways under aerobic conditions, detecting over 300 annotated metabolites.
Integrative Analysis: Phase variation and signaling pathways (c-di-GMP, SOS response) were explored to connect morphology and metabolism.
Phenotypic Trade-Off:
- IHE3034 grows as typical rods and can ferment citrate when glucose is present.
- RS218 forms long filaments and cannot use citrate.
- These traits are mutually exclusive, controlled by phase variation events involving the sfa gene cluster.
 As shown in Figure 1 (Yang et al., 2022), IHE3034 maintained a typical rod-shaped morphology with the ability to ferment citrate, while RS218 exhibited filamentous growth and lacked citrate utilization.
Proteomic Insights:
- RS218 showed upregulation of stress-response proteins (RecA, LexA) and cytoskeletal regulators linked to filamentation.
- IHE3034 expressed proteins supporting anaerobic respiration pathways needed for citrate utilization.
Metabolomic Insights:
- RS218 relied on oxidative metabolism, with increased TCA cycle enzyme activity and amino acid uptake.
- IHE3034 favored anaerobic nitrate respiration, enabling aerobic citrate fermentation.
Network Analysis:
The combined multiomics data mapped a gene–protein–metabolite trade-off network, linking citrate metabolism to filamentation and demonstrating how bacterial populations balance survival strategies across host environments.
This study highlights the power of integrated proteomics and metabolomics analysis in revealing hidden trade-offs between metabolic capacity and morphological adaptation. For clients, such multiomics workflows can:
- Identify condition-specific biomarkers.
- Uncover regulatory switches controlling phenotype.
- Provide insights into evolutionary strategies of pathogens.
Publication

- Zlatkov N, Näsman MEC, Uhlin BE. Metabolic and Morphotypic Trade-Offs within the Eco-Evolutionary Dynamics of Escherichia coli. Microbiol Spectr. 2022
- LAL KRISHAN KUMAR et al,. Impaired phagocytosis of photoreceptor outer segments by RPE in CLN3 disease is a consequence of altered sphingolipid metabolism. Investigative Ophthalmology & Visual Science June 2024, Vol.65, 1565
References
- Amiour N, Imbaud S, Clément G, Agier N, Zivy M, Valot B, Balliau T, Armengaud P, Quilleré I, Cañas R, Tercet-Laforgue T, Hirel B. The use of metabolomics integrated with transcriptomic and proteomic studies for identifying key steps involved in the control of nitrogen metabolism in crops such as maize. J Exp Bot. 2012 Sep;63(14):5017-33. doi: 10.1093/jxb/ers186. PMID: 22936829.
- Han J, Chear S, Talbot J, Swier V, Booth C, Reuben-Thomas C, Dalvi S, Weimer JM, Hewitt AW, Cook AL, Singh R. Genetic and Cellular Basis of Impaired Phagocytosis and Photoreceptor Degeneration in CLN3 Disease. Invest Ophthalmol Vis Sci. 2024 Nov 4;65(13):23. doi: 10.1167/iovs.65.13.23. PMID: 39535788; PMCID: PMC11563035.