Gut Microbiota Metabolomics Services for Functional and Pathway Insights
Unlock the functional potential of your gut microbiome with Creative Proteomics. Our advanced LC-MS/MS and GC-MS platforms provide comprehensive, high-accuracy metabolite profiling to reveal host–microbe interactions, biological mechanisms, and functional outputs of the microbiota.
Key Advantages
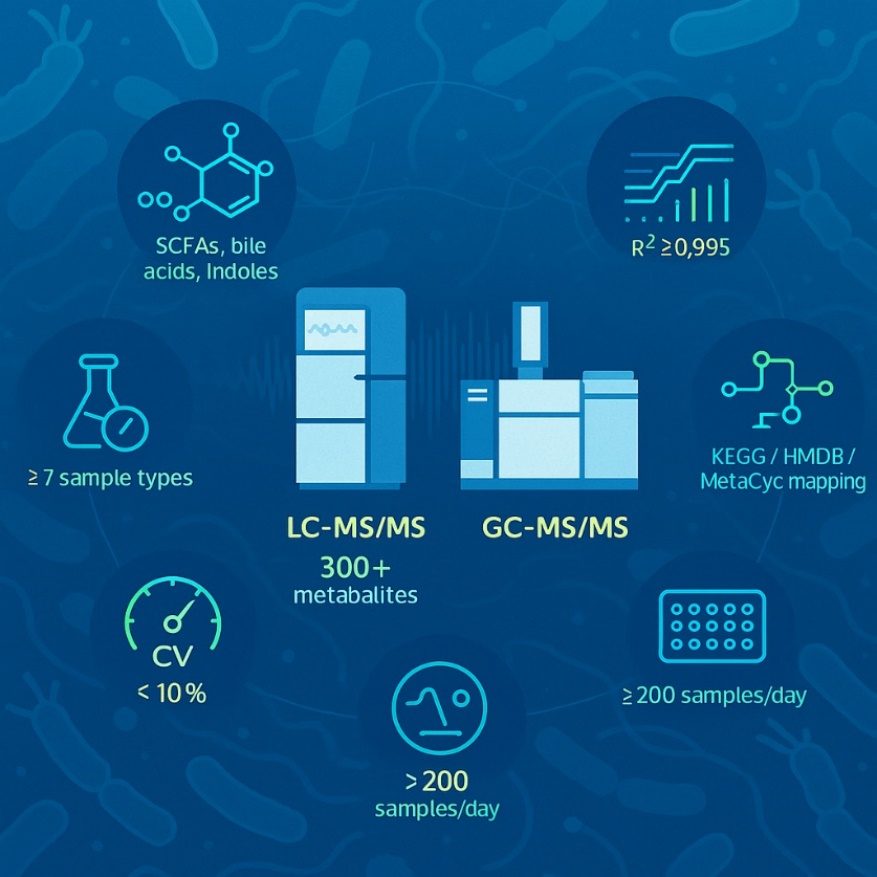
- Quantify 300+ gut-associated metabolites
- Identify SCFAs, bile acids, tryptophan derivatives, etc.
- Sample types: feces, plasma, serum, tissue, cell culture
- High-throughput, multi-group comparisons
- Bioinformatics mapping to KEGG, HMDB, and microbial pathways
Submit Your Request Now
×
What You Receive
- High-resolution chromatograms of target metabolites
- Quantitative data tables (absolute/relative abundance)
- Statistical analysis (PCA, volcano plot, heatmap)
- Pathway enrichment reports (KEGG/HMDB/MetaCyc)
- Comprehensive study report with interpretation
- What We Provide
- Advantages
- Technology Platform
- Sample Requirement
- Demo
- FAQs
What Research Problems Does Gut Microbiota Metabolomics Solve?
The gut microbiome plays a central role in human and animal health, but its functional output—the metabolome—offers the most direct insight into biological consequences. Creative Proteomics' gut microbiota metabolomics service supports:
- Decoding Microbial-Host Crosstalk: Quantify microbial metabolites that modulate immune responses, barrier integrity, or neurotransmission.
- Monitoring Intervention Outcomes: Assess how diet, pre/probiotics, or microbial therapies modulate gut metabolite profiles.
- Linking Microbial Profiles to Metabolic Phenotypes: Correlate metabolite abundance with inflammation, energy balance, or metabolic dysfunction.
- Biomarker Discovery: Identify non-invasive signatures in stool or plasma for translational research.
- Validating Engineered Strains or Consortia: Confirm functional activity of introduced microbes by metabolite output.
This service is designed to meet the needs of microbiome researchers, pharmaceutical developers, and nutrition scientists seeking actionable, functional insights.
What Services Are Offered in Our Gut Microbiota Metabolomics Solution?
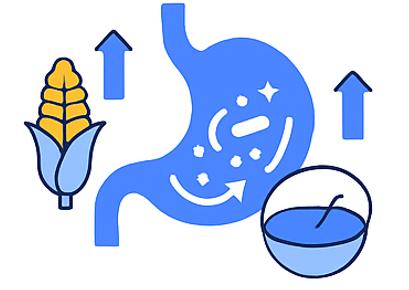
Nutritional and Dietary Intervention Studies
Track how specific diets—fiber-enriched, ketogenic, high-fat, or polyphenol-rich—impact gut microbial metabolism. Our SCFA, phenolic acids, and organic acid panels offer precise biochemical readouts for nutritional studies and time-course monitoring.

Probiotic, Prebiotic, and FMT Evaluation
Quantify beneficial microbial outputs such as butyrate, IAA, and secondary bile acids following intervention. Ideal for assessing the functional efficacy of single strains, synbiotics, or fecal microbiota transplants.

Gut–Brain Axis and Neurodevelopment Research
Measure neuroactive metabolites (e.g., indole derivatives, kynurenine, GABA precursors) to support studies on cognition, behavior, and neurodevelopmental pathways influenced by the microbiota

Inflammation, Immunity, and Barrier Function Assessment
Track key microbial metabolites that influence mucosal immunity and epithelial integrity, such as SCFAs, TMAO, and p-cresol. Suitable for IBD models, gut permeability assays, and host–microbe immune interaction studies.

Metabolic Syndrome and Cardiovascular Risk Research
Monitor gut-derived risk factors like TMAO, succinate, and bile acid imbalance across metabolic disease models. Our targeted assays align with lipidomics, glucose tolerance testing, and cardiometabolic profiling.

Host–Microbiome Co-metabolism and Xenobiotic Processing
Investigate how the microbiota modulates host metabolism of drugs, hormones, or environmental chemicals. Detect microbial biotransformation products and conjugated metabolites (glucuronides, sulfates) across multiple tissue types.
What Metabolites and Pathways Are Covered?
Detected Gut Microbial Metabolites
| Metabolite Class | Representative Compounds |
|---|---|
| Short-Chain Fatty Acids | Acetate, Propionate, Butyrate, Isobutyrate, Valerate, Caproate |
| Bile Acids | Cholic acid (CA), Deoxycholic acid (DCA), Lithocholic acid (LCA), Glycocholic acid, Taurocholic acid |
| Tryptophan Derivatives | Indole, Indole-3-acetic acid (IAA), Tryptamine, Kynurenine, Indole-3-propionic acid (IPA) |
| Phenolic Compounds | p-Cresol, Phenylacetic acid, Benzoic acid, 4-Hydroxybenzoic acid |
| Amines | Trimethylamine (TMA), Trimethylamine N-oxide (TMAO), Cadaverine, Putrescine, Agmatine |
| Vitamins & Cofactors | Riboflavin (B2), Biotin (B7), Niacin (B3), Vitamin K variants |
| Organic Acids | Lactic acid, Succinic acid, Fumaric acid, Phenyllactic acid |
Pathway Annotation & Coverage
| Pathway Category | Example Pathways | Database Reference |
|---|---|---|
| SCFA Biosynthesis | Pyruvate fermentation to butanoate/propanoate | KEGG map00650, map00640 |
| Tryptophan Metabolism | Tryptophan → Indole/IAA/Kynurenine | KEGG map00380 |
| Bile Acid Transformation | Primary → Secondary bile acid conversion (e.g., CA → DCA) | HMDB, KEGG map00120 |
| Host-Microbe Co-metabolism | Glucuronidation, Sulfation, Methylation of microbial metabolites | MetaCyc, Reactome |
| Vitamin Biosynthesis (Microbial) | Riboflavin and niacin biosynthesis from microbial pathways | KEGG map00740, map00760 |
| Microbial Aromatic Degradation | Phenylpropanoid → Benzoic acid/p-cresol | KEGG map00360 |
Why Choose Creative Proteomics for Indole-3-acetic Acid Analysis?
- High-Coverage Detection: Quantify over 300 gut-associated metabolites spanning SCFAs, bile acids, indoles, phenolics, amines, and vitamins across multiple biological matrices.
- Ultrasensitive Quantification: Achieve LODs as low as 0.1 ng/mL for volatile SCFAs and amines using internal standard–calibrated LC-MS/MS and GC-MS methods.
- Outstanding Reproducibility: Ensure data confidence with inter-batch CV<10% and correlation coefficients R² ≥ 0.995 in all targeted quantification runs.
- Comprehensive Sample Compatibility: Supports feces, serum, plasma, intestinal tissue, cell pellets, culture media, and microbial supernatants. Matrix-validated extraction protocols ensure ≥85% recovery.
- Multi-group & Longitudinal Study Readiness: High-throughput LC-MS/MS allows processing of >200 samples/day, ideal for intervention studies, time-course profiling, or cohort biomarker discovery.
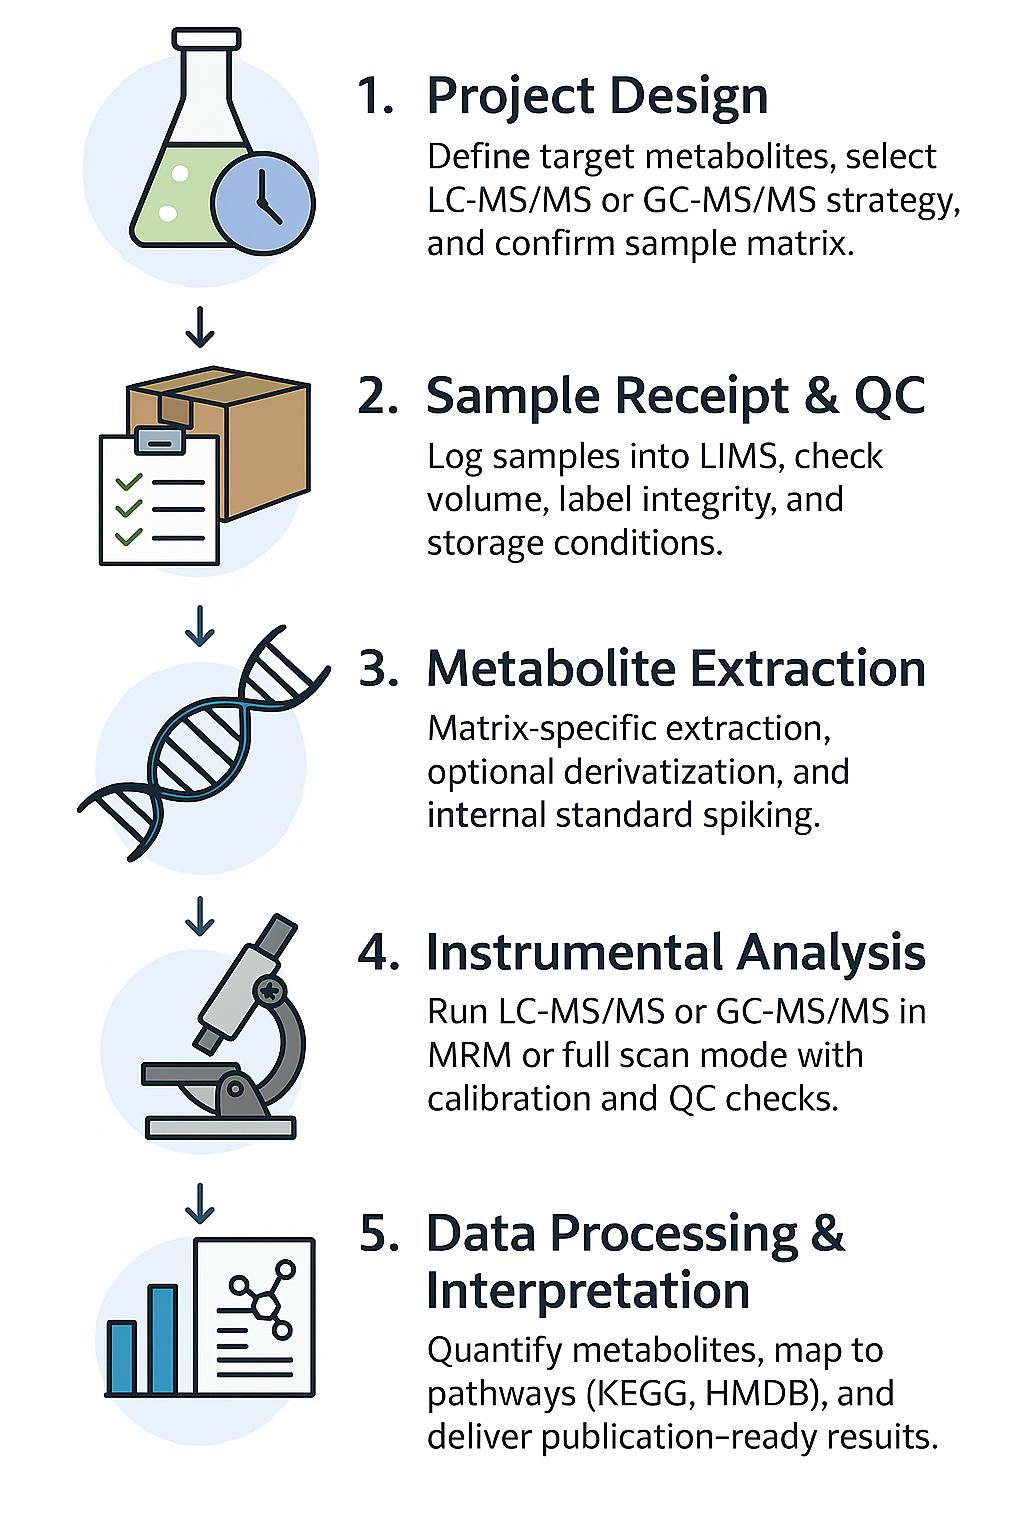
Gut Microbiota Metabolomics Analysis Workflow: Step-by-Step Process
Project Design & Sample Consultation
Define research objectives, sample types, and target metabolite classes (e.g., SCFAs, bile acids, indoles). Our experts assist in selecting targeted vs. untargeted strategies and compatible matrices.
Sample Receipt & Quality Control
Upon arrival, all samples undergo integrity checks, matrix verification, and barcode registration. Critical metadata (e.g., time points, treatment groups) are recorded into our LIMS.
Metabolite Extraction & Stabilization
Apply matrix-specific protocols—mechanical disruption, solvent extraction, derivatization (if needed)—with isotope-labeled internal standards added to enable absolute quantification.
Instrumental Analysis (LC-MS/MS or GC-MS/MS)
Perform analysis using SCIEX Triple Quad™ 6500+ or Agilent GC 7890B–5977B for high-resolution detection. Modes include full-scan, SIM, and dynamic MRM. QC samples are injected every 10 runs.
Data Processing, Quantification & Bioinformatics
Normalize data using calibration curves (R² ≥ 0.995). Identify and quantify 300+ gut-related metabolites. Bioinformatics annotation maps compounds to KEGG, HMDB, and MetaCyc pathways for biological insight.
What Methods Are Used for Gut Microbiota Metabolomics Analysis?
LC-MS/MS (Triple Quadrupole and High-Resolution Orbitrap)
Instruments:
- Thermo Scientific Q Exactive Orbitrap (untargeted profiling)
- SCIEX Triple Quad™ 6500+ (targeted panels for SCFAs, TMAO, bile acids, indoles)
Key Parameters:
- ESI+ and ESI− dual-mode acquisition
- Mass accuracy:<2 ppm (Orbitrap)
- Dynamic MRM mode for ≥100 transitions/run
- Calibration with isotope-labeled internal standards
- Linear quantification range: 0.1–10,000 ng/mL
- CV<10%,>0.995 for all standard curves
GC-MS/MS for Volatile Compounds
Instrument:
- Agilent 7890B GC + 5977B MSD
Application:
Targeted SCFA profiling using derivatized analysis (e.g., propyl or ethyl ester forms)
- Full-scan and SIM modes
- LOQ down to 0.1–1 ng/mL
- High-resolution separation of isomeric SCFAs
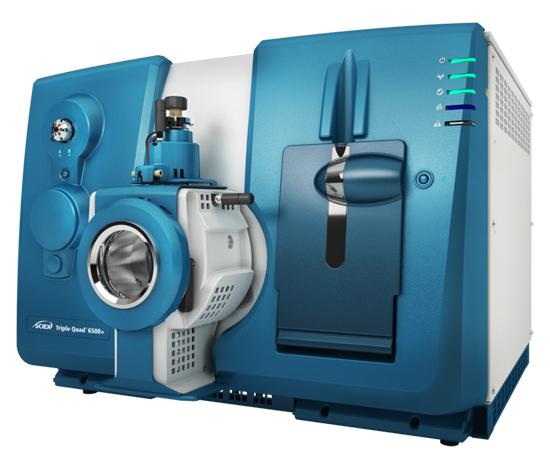
SCIEX Triple Quad™ 6500+ (Figure from Sciex)
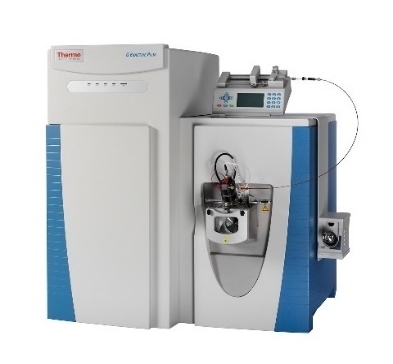
Thermo Fisher Q Exactive (Figure from Thermo Fisher)
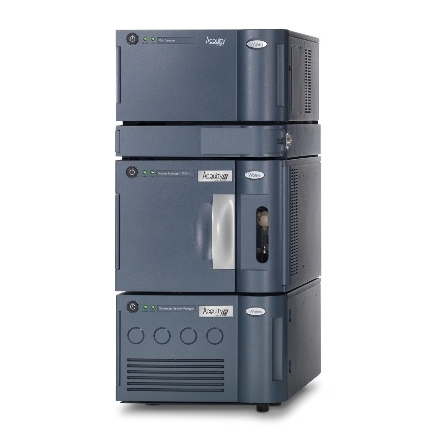
Waters ACQUITY UPLC System (Figure from Waters)
Sample Requirements for Gut Microbiota Metabolomics Analysis Service
| Sample Type | Recommended Amount | Container | Storage & Transport | Notes |
|---|---|---|---|---|
| Feces/Stool | ≥ 100 mg | 2 mL cryotube or sterile Eppendorf | −80°C; ship on dry ice | Avoid preservatives; remove excess moisture if possible |
| Plasma/Serum | ≥ 100 µL | 0.5–1.5 mL microcentrifuge tube | −80°C; ship on dry ice | Use EDTA or heparin plasma; avoid hemolysis |
| Urine | ≥ 200 µL | Sterile screw-cap tube | −80°C; ship on dry ice | Collect midstream; avoid bacterial contamination |
| Tissue (e.g. liver, colon) | ≥ 30 mg | Cryotube or foil-wrapped tube | Snap-freeze in liquid nitrogen; −80°C | Rinse with PBS before freezing; avoid thawing |
| Cell Pellets | ≥ 1 × 10⁶ cells | 1.5 mL tube | −80°C; ship on dry ice | Washed and centrifuged; no culture medium remaining |
| Microbial Supernatant | ≥ 500 µL | 1.5 mL tube | −80°C; filter or centrifuge before freezing | Filtered through 0.22 µm filter recommended |
| Culture Medium | ≥ 500 µL | Sterile screw-cap tube | −80°C; ship on dry ice | Collect post-culture; record time and conditions |
Demo Results
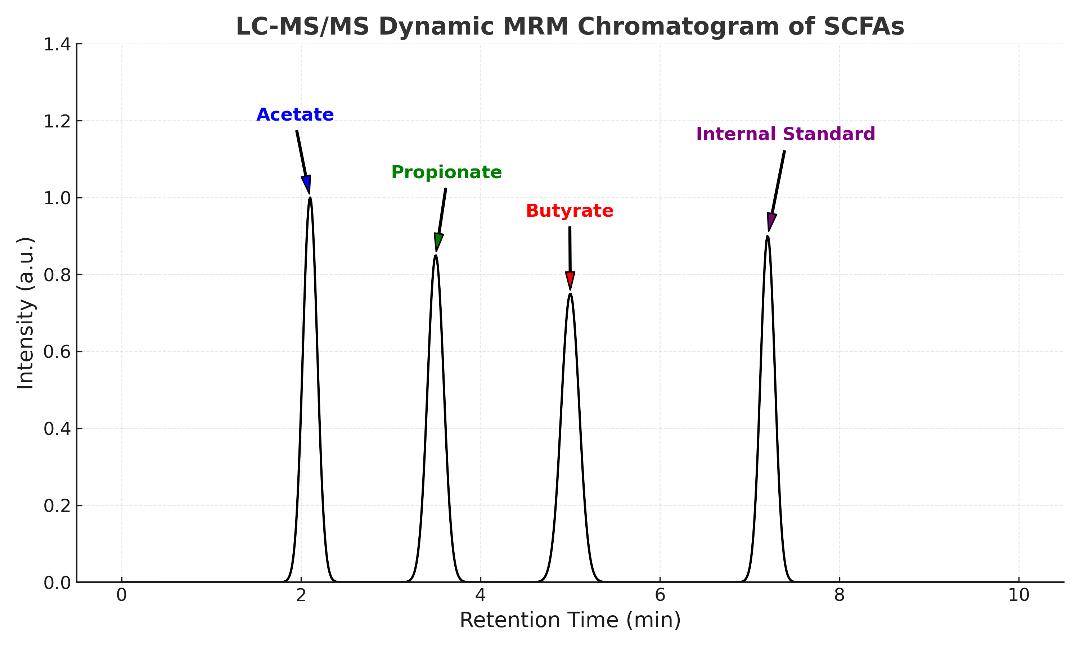
SCFAs LC-MS/MS Dynamic MRM Chromatogram
Dynamic MRM chromatogram of short-chain fatty acids (acetate, propionate, butyrate) with internal standard. Peaks are clearly separated with distinct retention times and high signal-to-noise ratios.
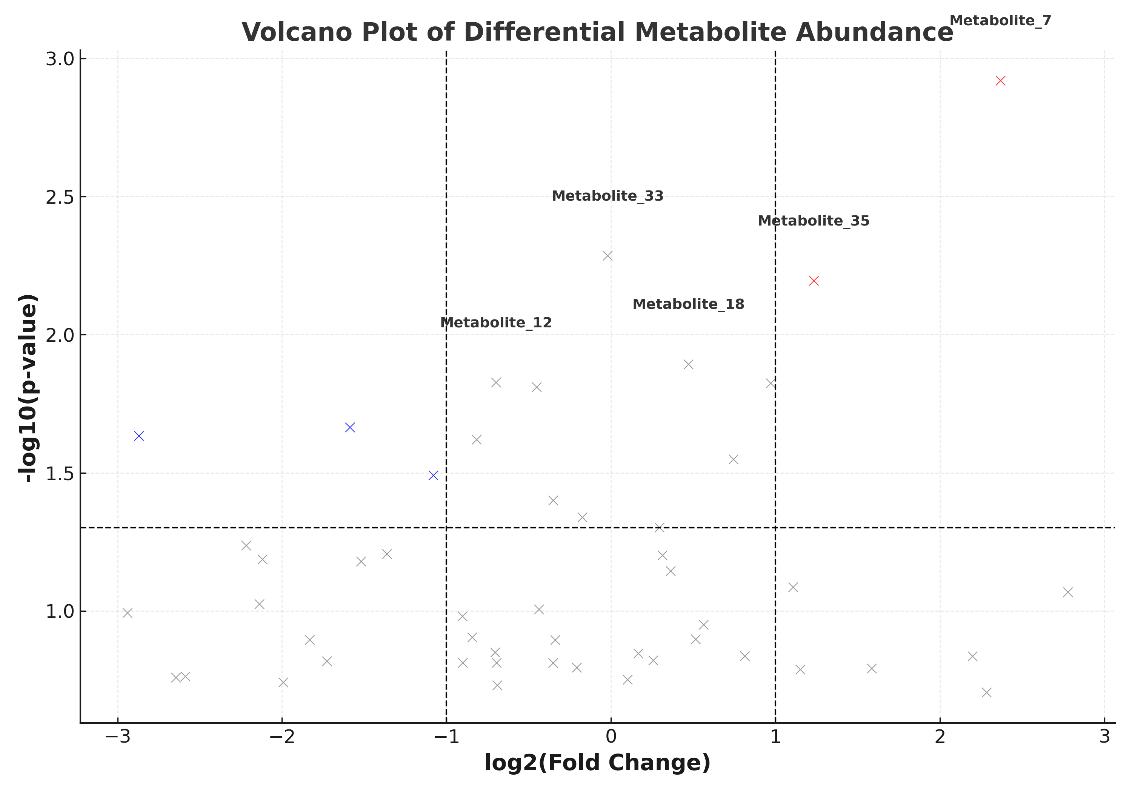
Volcano Plot of Differential Metabolite Abundance
Volcano plot highlighting significantly upregulated (red) and downregulated (blue) metabolites based on log2 fold change and -log10(p-value). Top hits are annotated.
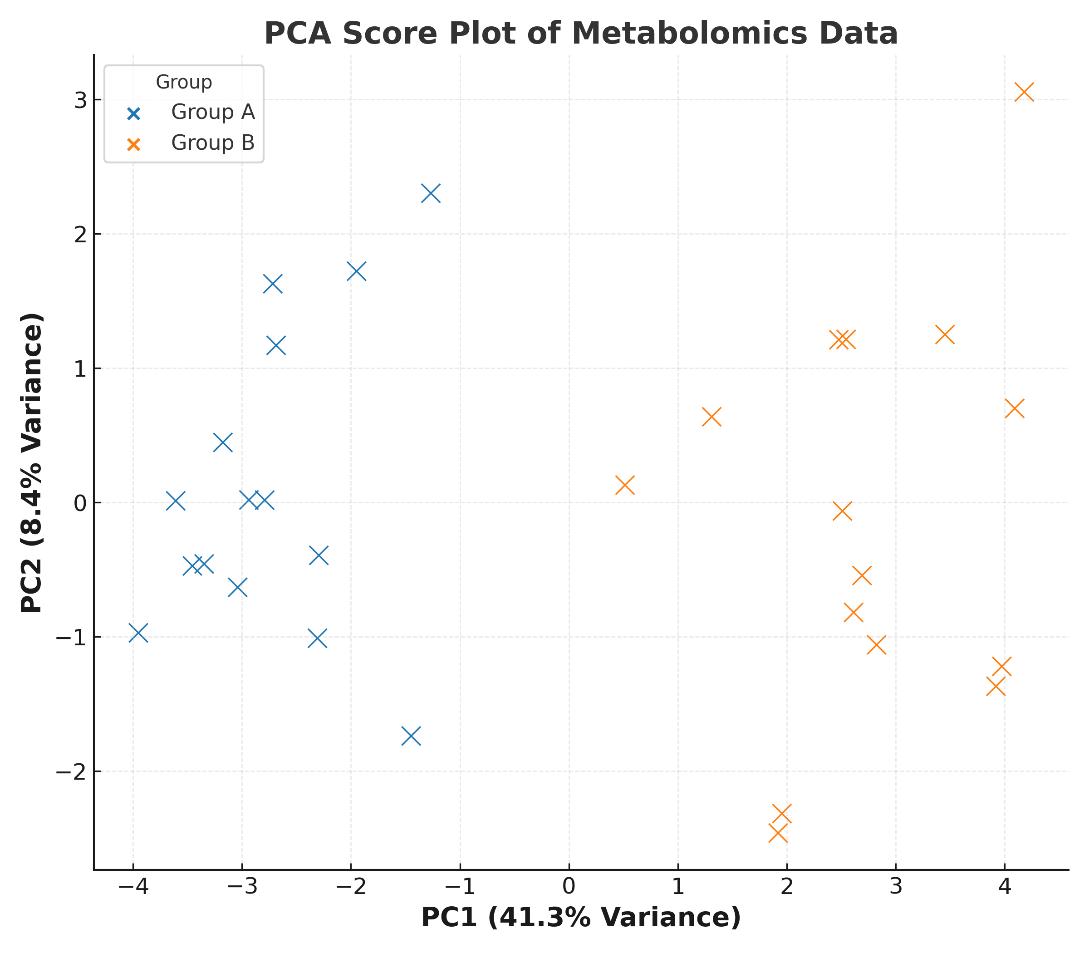
PCA Score Plot of Metabolomics Data
Principal component analysis (PCA) score plot displaying clear separation between Group A and Group B based on metabolite profiles. Variance explained by PC1 and PC2 is indicated.
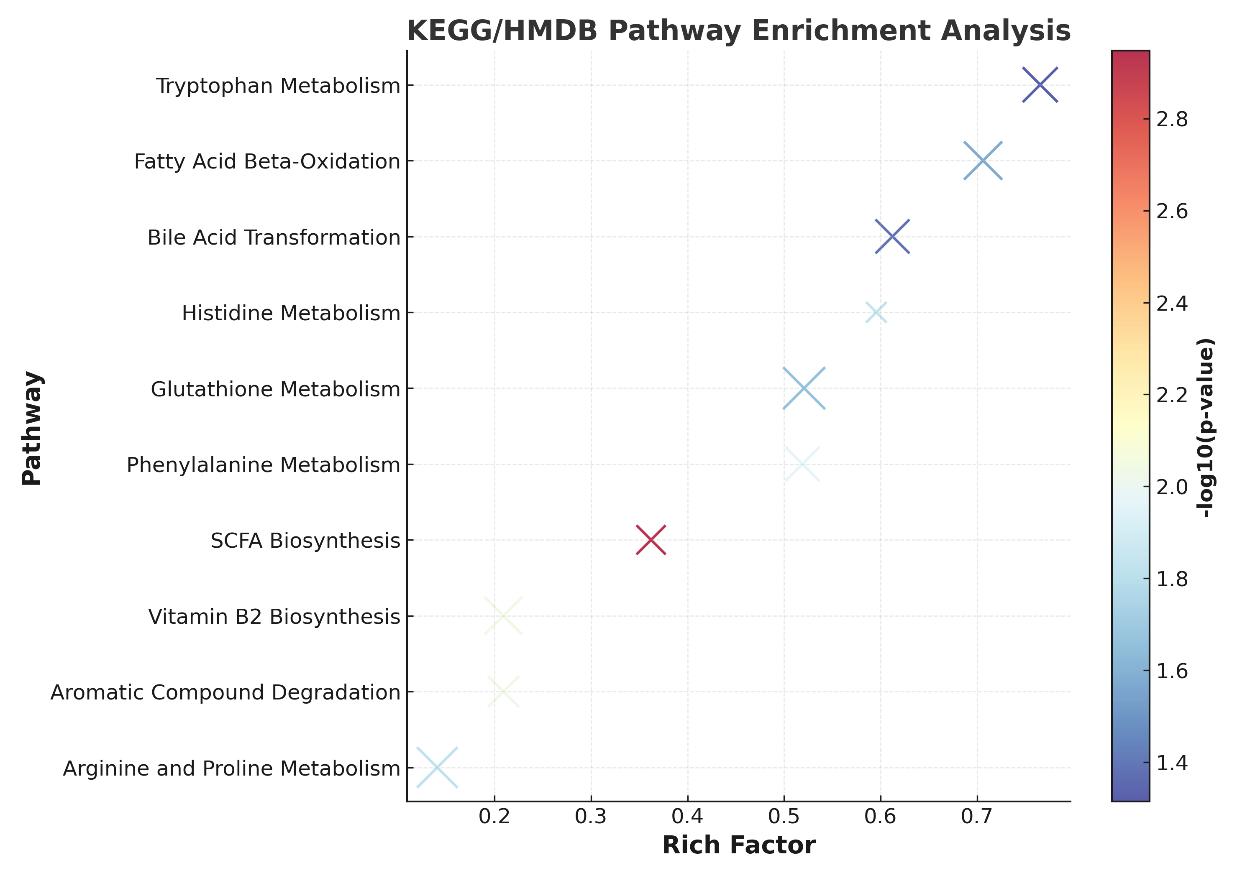
KEGG/HMDB Pathway Enrichment Bubble Chart
Pathway enrichment bubble chart showing KEGG/HMDB pathways ranked by rich factor, with bubble size representing metabolite counts and color scale indicating -log10(p-value).
Metabolomics Profiling of Tick Gut Microbiota Modulation by PIXR Protein
Journal: Nature communications
Published: 2017
- Background
- Objectives
- Methodology
- Key Findings
The study published in Nature Communications (Narasimhan et al., 2017) investigated how a secreted tick gut protein, PIXR, modulates the gut microbiota and metabolome of the Lyme disease vector Ixodes scapularis, ultimately influencing the colonization efficiency of Borrelia burgdorferi. This research highlights the intimate relationship between gut microbiota composition, metabolite profiles, and pathogen adaptation.
- Determine how suppression of PIXR affects gut microbial community structure and metabolic output.
- Identify specific metabolomic changes associated with altered microbial biofilm formation.
- Understand how these metabolite shifts impact B. burgdorferi gene expression during colonization.
- Experimental Groups: Larval and nymphal ticks fed on PIXR-immunized mice vs. control mice.
- Microbiome Analysis: 16S rRNA amplicon sequencing to profile gut bacterial communities.
- Metabolomics Platform: UPLC-MS untargeted metabolomics (positive and negative ion modes) to detect and quantify gut metabolites.
- Data Analysis: Hierarchical clustering, heatmap visualization, and pathway annotation (KEGG/HMDB).
- Gene Expression Correlation: qRT-PCR of B. burgdorferi colonization-related genes.
- Microbial Shifts: PIXR abrogation significantly altered gut bacterial diversity (ANOSIM R=0.71, p=0.001), with increased abundance of certain gram-positive genera such as Brevibacterium.
- Biofilm Modulation: Loss of PIXR led to denser gram-positive biofilm structures, confirmed via SEM and PNAG immunofluorescence.
- Metabolomic Changes:
- Identified 123 metabolites, with 38 (positive mode) and 39 (negative mode) significantly altered between groups.
- Shifts observed in SCFA-related metabolites, aromatic amino acid derivatives, and lipid-related compounds.
- Heatmap clustering clearly separated PIXR-deficient from control gut metabolomes.
- Functional Impact: Altered metabolome profiles corresponded with changes in B. burgdorferi gene expression, particularly in oxidative stress defense and carbohydrate utilization pathways.
Reference
- Narasimhan, Sukanya, et al. "Modulation of the tick gut milieu by a secreted tick protein favors Borrelia burgdorferi colonization." Nature communications 8.1 (2017): 184.
FAQ of GC-MS/MS Metabolomics Analysis Service
How do I choose between LC-MS/MS and GC-MS/MS for my gut microbiota metabolomics study?
he choice of method depends on the type of metabolites you're interested in. LC-MS/MS is ideal for detecting polar metabolites, such as SCFAs, bile acids, indoles, and phenolic compounds, while GC-MS/MS is typically used for volatile compounds (like SCFAs) and is more suitable for metabolites requiring derivatization. If you're unsure which method is best for your study, our team can help assess your needs and recommend the right approach.
What makes your service different from other gut microbiome metabolomics providers?
Our service stands out due to our high coverage of over 300 metabolites across multiple biological matrices, ultrasensitive quantification down to 0.1 ng/mL, and a commitment to outstanding reproducibility (CV<10%, R² ≥ 0.995). We also support high-throughput studies, processing over 200 samples per day, making us well-suited for large intervention or cohort studies.
Can I use stool samples from animals, or is this service only for human samples?
Yes, we accept both human and animal stool samples. Our methodologies are optimized for a wide variety of biological matrices, including human and animal tissues, blood, urine, and microbiome culture supernatants. Be sure to follow the provided sample collection guidelines for the best results.
Are the metabolites detected in fecal samples the same as those found in plasma or urine?
Not all metabolites are present in the same concentrations across different biological matrices. Fecal samples are rich in microbial-derived metabolites (like SCFAs and bile acids), whereas plasma and urine may contain metabolites that have been absorbed and are circulating in the body. We tailor our analysis based on the sample type to ensure accurate detection and quantification.
What should I do if I want to track long-term dietary or probiotic interventions?
For longitudinal studies, we recommend collecting multiple time-point samples to track changes over time. Our service is equipped to handle such time-course studies, enabling you to assess how dietary changes, probiotics, or FMT (fecal microbiota transplants) influence the gut microbiota metabolome across different stages of intervention.
What if my sample has low metabolite concentrations? Can your service still detect them?
Yes, we use highly sensitive methods (LC-MS/MS with isotope-labeled internal standards, GC-MS/MS with high-resolution separation) that can detect metabolites even at low concentrations (down to 0.1 ng/mL). However, it's important to provide the recommended sample amount to ensure a sufficient signal-to-noise ratio, especially for volatile compounds.
What happens if I submit a sample that doesn't meet the recommended specifications?
While we encourage following the sample specifications for the best possible results, we understand that deviations may occur. If your sample doesn't meet the guidelines, our team will assess the sample quality and may contact you for further clarification or to suggest alternative collection methods. In some cases, the analysis may still be possible, but we cannot guarantee optimal data quality.
How can I ensure my data is reliable for publication or regulatory submissions?
We employ strict quality control measures throughout the analysis process, including internal standards for calibration and validation, randomization, and QC samples every 10 injections. Our method yields high reproducibility (CV<10%) and high correlation (R² ≥ 0.995), ensuring that the data is both reliable and suitable for scientific publication or further regulatory work.
Can I request targeted analyses for a specific group of metabolites instead of a full panel?
Yes, we offer both targeted and untargeted metabolomics. If you're only interested in a specific class of metabolites (e.g., SCFAs, bile acids, or tryptophan derivatives), we can tailor the analysis to focus on those compounds. Contact us to discuss which metabolites or pathways you'd like to target.
How do you handle potential contamination or cross-sample interference in microbiome samples?
We take contamination seriously and use rigorous sample handling procedures to minimize potential interference. Samples are processed in a contamination-free environment, and we include QC samples and blanks throughout the analysis to detect and mitigate any unwanted background signals. Our methods also ensure sample randomization to reduce bias during batch processing.
Is there an option for joint analysis of the gut microbiome and other omics data, like proteomics or genomics?
Absolutely! We offer the option to integrate metabolomics data with other types of omics data, including proteomics, genomics, and transcriptomics. This multi-omics approach provides deeper insights into the biological processes at play and can help you correlate metabolite abundance with other markers of health or disease.
What if I need help interpreting the data or generating hypotheses from the results?
In addition to raw data and statistical analyses, we offer data interpretation services to help generate actionable insights from your results. Our team can assist with pathway analysis, biomarker discovery, and experimental design suggestions, ensuring that your findings are both meaningful and aligned with your research goals.
Learn about other Q&A about proteomics technology.
Publications
Here are some of the metabolomics-related papers published by our clients:

- Methyl donor supplementation reduces phospho‐Tau, Fyn and demethylated protein phosphatase 2A levels and mitigates learning and motor deficits in a mouse model of tauopathy. 2023.
- A human iPSC-derived hepatocyte screen identifies compounds that inhibit production of Apolipoprotein B. 2023.
- The activity of the aryl hydrocarbon receptor in T cells tunes the gut microenvironment to sustain autoimmunity and neuroinflammation. 2023.
- Lipid droplet-associated lncRNA LIPTER preserves cardiac lipid metabolism. 2023.
- Inflammation primes the kidney for recovery by activating AZIN1 A-to-I editing. 2023.
- Anti-inflammatory activity of black soldier fly oil associated with modulation of TLR signaling: A metabolomic approach. 2023.