Purines Analysis Service
Gain accurate, pathway-informed insights into purine metabolism with Creative Proteomics' targeted LC-MS/MS platform.
We help you:
- Quantify key purine metabolites including ATP, AMP, inosine, hypoxanthine, xanthine, uric acid, and more
- Support diverse research areas such as energy metabolism, oxidative stress, renal function, and drug mechanism studies
- Deliver high-confidence results with absolute quantification, metabolic ratio analysis, and QC-verified precision (CV ≤ 5%)
Advance your biomedical, pharmaceutical, or toxicological research with data you can trust.
Submit Your Request Now
×
What You Will Receive
- Full concentration tables (ng/mL or µmol/g)
- Annotated chromatograms and standard curves
- QC reproducibility (CV%) summary
- Pathway-based data interpretation
- Customizable reporting format (PDF/Excel)
- What We Provide
- Advantages
- Technology Platform
- Sample Requirements
- Demo
- FAQs
- Case Study
Overview of Purines
Purines are nitrogen-containing heterocyclic compounds that serve as fundamental building blocks in various biological systems. As core components of nucleotides—including adenosine monophosphate (AMP), guanosine monophosphate (GMP), and their corresponding deoxy forms—they are essential to DNA and RNA structure. Beyond their genetic role, purines also participate in critical cellular functions, including ATP-mediated energy transfer, GTP signaling, and cofactor synthesis (e.g., NAD⁺, FAD). Abnormal purine metabolism is closely linked to diseases such as gout, cancer, metabolic syndromes, and neurodegenerative disorders.
Why Analyze Purines?
Purine metabolism plays a foundational role in cellular homeostasis, linking genetic material, energy currency, and signaling molecules. Dysregulation in purine pathways is implicated in a wide range of biological processes, including oxidative stress, immune activation, mitochondrial dysfunction, and renal overload. In both basic research and applied settings, purine profiling offers unique value across multiple domains:
- Cellular energy balance: AMP/ATP ratios reflect metabolic shifts under hypoxia or drug treatment
- Stress and degradation pathways: Accumulation of hypoxanthine or uric acid reveals oxidative load and xanthine oxidase activity
- Biomarker discovery: Specific purine derivatives can signal disease progression or pharmacodynamic effects
- Pathway characterization: Insights into salvage and de novo biosynthesis routes support metabolic engineering and therapeutic design
- Bioprocess optimization: Fine-tuning purine availability in cell cultures or microbial systems improves yield and system stability
Analyzing purines is not just about quantifying molecules—it's about decoding the dynamics behind cell fate, metabolic flux, and disease adaptation.
Purines Analysis Service Offered by Creative Proteomics
- Quantification of canonical purine nucleotides: ATP, ADP, AMP, GTP, GDP, GMP across biological matrices (plasma, serum, CSF, tissue, cell lysate, microbial extracts)
- Profiling of purine bases and degradation products: adenine, guanine, hypoxanthine, xanthine, uric acid, inosine
- Measurement of purine nucleosides and nucleotides in dynamic time-course studies, including stress, hypoxia, and drug perturbation experiments
- Assessment of purine salvage and de novo synthesis pathway intermediates, enabling upstream/downstream pathway reconstruction
- Stable isotope-labeled tracing services (e.g., ¹³C-adenine, ¹⁵N-inosine) to monitor flux through purine biosynthetic pathways
- Comparative analysis of purine metabolism under different experimental conditions, such as disease models, engineered strains, or therapeutic interventions
- Custom method development for rare purine analogs, cofactor-associated species (e.g., NAD⁺, FAD), or pharmaceutical derivatives
List of Detected Purines and Related Metabolites
| Category | Analyte Name | Abbreviation | Biological Role / Pathway |
|---|---|---|---|
| Purine Bases | Adenine | A | DNA/RNA backbone; precursor in de novo pathway |
| Guanine | G | DNA/RNA backbone; precursor in de novo pathway | |
| Hypoxanthine | HX | Purine degradation intermediate | |
| Xanthine | X | Oxidized purine intermediate; target of XO | |
| Uric Acid | UA | Final product of purine degradation in humans | |
| Nucleosides | Adenosine | Ado | Energy signaling; immune modulation |
| Guanosine | Guo | Precursor for GTP synthesis | |
| Inosine | Ino | Salvage pathway intermediate | |
| Xanthosine | Xao | Intermediate in xanthine production | |
| Ribonucleotides | Adenosine Monophosphate | AMP | Energy metabolism (ATP/AMP ratio); signaling |
| Adenosine Diphosphate | ADP | Energy carrier | |
| Adenosine Triphosphate | ATP | Universal energy molecule | |
| Guanosine Monophosphate | GMP | GTP precursor; involved in signaling | |
| Guanosine Diphosphate | GDP | Intermediate in GTP synthesis | |
| Guanosine Triphosphate | GTP | Energy donor; G-protein signaling | |
| Inosine Monophosphate | IMP | Central intermediate in purine biosynthesis | |
| Xanthosine Monophosphate | XMP | Intermediate from IMP to GMP conversion | |
| Deoxyribonucleotides | dAMP, dADP, dATP | – | DNA synthesis components |
| dGMP, dGDP, dGTP | – | DNA synthesis components | |
| Cofactor-related | Nicotinamide Adenine Dinucleotide | NAD⁺ / NADH | Redox cofactor; ATP regeneration coupling |
| Flavin Adenine Dinucleotide | FAD | Redox enzyme cofactor | |
| FMN (via Riboflavin) | FMN | Electron transport chain involvement | |
| Stable Isotopes | ¹³C-adenine, ¹⁵N-inosine | – | Metabolic flux tracing and pathway reconstruction |
Advantages of Purines Assay
- High Sensitivity and Low Detection Limits: Achieve detection down to 0.1–0.5 ng/mL for key purine metabolites such as ATP, hypoxanthine, and uric acid, suitable for low-abundance biological samples (e.g., CSF, intracellular extracts).
- Excellent Quantitative Precision: Intra- and inter-assay CV ≤ 5%, ensuring consistent results across replicates and batches.
- Wide Dynamic Range: Linear quantification across four to five orders of magnitude (e.g., 0.1 ng/mL to 100 µg/mL), enabling simultaneous detection of trace and abundant analytes.
- Pathway Coverage: Simultaneous analysis of 20+ purine-related compounds across de novo synthesis, salvage, and degradation pathways in a single run.
- Multiplexed Sample Processing: Process up to 96 samples per batch with automated extraction and LC-MS/MS quantification, optimizing throughput for cohort studies or time-course designs.
- Custom Ratio Calculations & Pathway Indices: Support for metabolic indices such as ATP/AMP, IMP/XMP, hypoxanthine/uric acid, tailored to disease modeling or stress profiling.
- Stable Isotope Tracing Support: Integrated workflows using ¹³C- or ¹⁵N-labeled compounds enable pathway-specific flux quantification and kinetic studies.
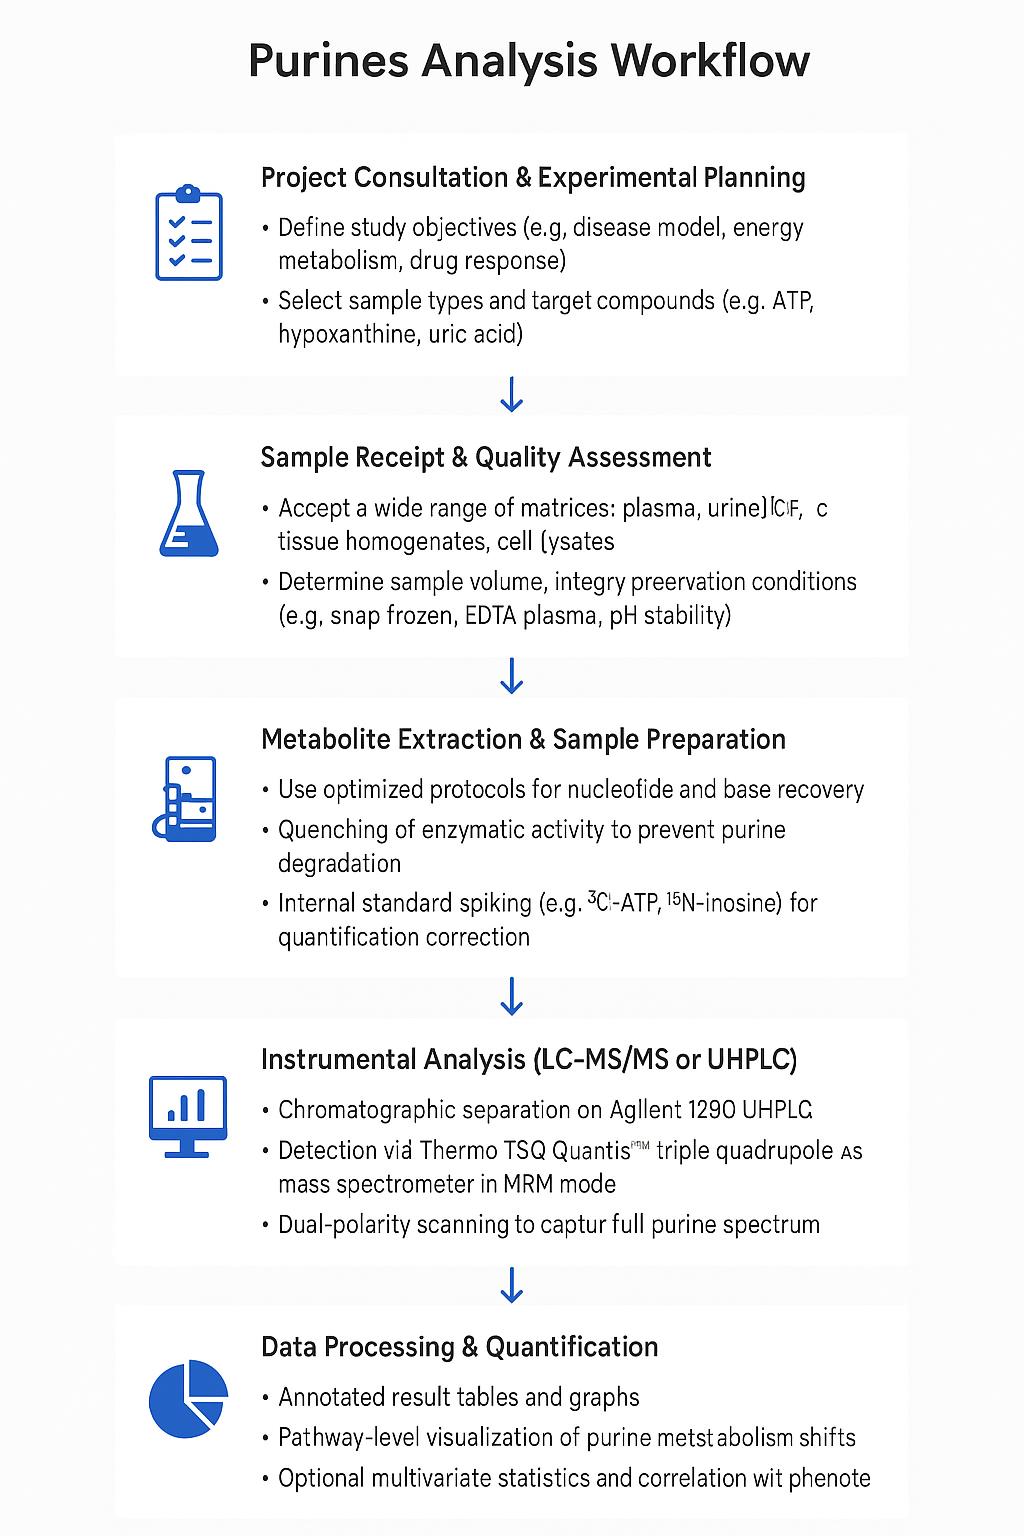
Workflow for Purines Analysis Service
Technology Platform for Purines Analysis Service
LC-MS/MS: Thermo Scientific™ TSQ Quantis™ Triple Quadrupole for targeted quantification
UHPLC: Agilent 1290 Infinity II for high-resolution chromatographic separation
Data Handling: Thermo Xcalibur™ and Compound Discoverer™ for signal processing and identification
Optional: Stable isotope tracing workflows available using ¹³C or ¹⁵N-labeled purines
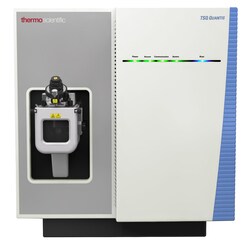
TSQ Quantis™ Triple Quadrupole (Figure from Thermo Scientific)
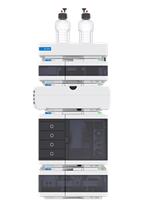
Agilent 1260 Infinity II HPLC (Fig from Agilent)
Sample Requirements for Purines Analysis Service
| Sample Type | Minimum Volume / Mass | Recommended Storage | Notes |
|---|---|---|---|
| Plasma / Serum | ≥ 100 μL | -80°C, aliquoted | Use EDTA or heparin tubes; avoid repeated freeze-thaw cycles |
| Urine | ≥ 200 μL | -80°C, pH-adjusted (optional) | Collect midstream sample; centrifuge to remove debris |
| Cerebrospinal Fluid | ≥ 50 μL | -80°C | Snap-freeze immediately after collection |
| Tissue Homogenates | ≥ 20 mg (wet weight) | Snap-frozen in liquid nitrogen | Store in cryovials; avoid delay between dissection and freezing |
| Cultured Cells | ≥ 1×10⁶ cells | Washed, snap-frozen | Remove culture medium completely; wash with PBS before freezing |
| Microbial Supernatants | ≥ 200 μL | -80°C | Filter or centrifuge to remove cells; store in sterile tubes |
| Fermentation Broth | ≥ 500 μL | -80°C | pH should be neutralized if acidic |
Demo Results
Concentrations of the detected compounds were calculated with internal-standard calibration by interpolating the constructed linear calibration curves of individual compounds within an appropriate concentration range for each compound.
Table 1 . Quantitative Results of Purine-Related Compounds in Test and QC Samples
| Sample_C(µmol/g or ppm) | Adenine | Adenosine | Cytidine | Cytosine |
|---|---|---|---|---|
| 01_S11 | 0.010137697 | 13.19207811 | 0.07989675 | 0.025798554 |
| 02_S12 | 0.006172711 | 13.08010022 | 0.071507282 | 0.024001392 |
| 03_S21 | 0.005079556 | 15.49480016 | 0.066231695 | 0.035768753 |
| 04_S22 | 0.004049685 | 14.58872029 | 0.056179632 | 0.035162897 |
| 05_S31 | 0.178592086 | 14.92748755 | 0.061898612 | 0.043892462 |
| 06_S32 | 0.145836273 | 16.70362739 | 0.047692858 | 0.04157569 |
| 07_S41 | 0.153798631 | 15.19871775 | 0.063177346 | 0.041044176 |
| 08_S42 | 0.106759819 | 14.66986091 | 0.060294108 | 0.0414638 |
| 09_S51 | 0.532269225 | 12.3470456 | 0.078734577 | 0.038760706 |
| 10_S52 | 0.533387532 | 14.68101141 | 0.013787334 | 0.034976939 |
| QC_01 | 0.009877496 | 13.19207811 | 0.079765046 | 0.025482708 |
| QC_02 | 0.010137697 | 13.57015856 | 0.07989675 | 0.025798554 |
| QC_03 | 0.009793479 | 13.30295421 | 0.079674113 | 0.027084818 |
| CV% | 1.8 | 1.5 | 0.1 | 3.2 |


FAQ of Purines Analysis Service
How should I prepare and ship my samples for purine analysis?
All samples should be frozen immediately after collection and stored at -80°C. Use dry ice for shipping and ensure samples remain frozen during transit. For plasma or serum, use EDTA- or heparin-coated tubes and avoid repeated freeze-thaw cycles.
Can I send samples from different organisms or species?
Yes. Our platform supports purine analysis from human, animal (e.g., mouse, rat), microbial, and plant samples. If you're working with non-model organisms, please notify us so we can assess matrix compatibility in advance.
Can you help with experimental design or selecting the right purine targets?
Absolutely. Our scientific team offers free consultation to help you design your experiment, select relevant purine metabolites, and choose optimal conditions for time-course or perturbation studies.
Are the results provided in raw data format or with interpretation?
Both. We provide raw LC-MS/MS data, quantified metabolite concentrations, and optional data interpretation reports with pathway heatmaps, metabolic ratios (e.g., AMP/ATP), and statistical comparisons upon request.
Is it possible to analyze both purine and pyrimidine metabolites in one run?
While our standard service is focused on purines, we can develop custom panels that include pyrimidines (e.g., uridine, cytidine, thymidine) upon request. This may require additional method development time.
How are low-abundance compounds handled?
We use highly sensitive LC-MS/MS instruments with detection limits down to 0.1 ng/mL. For very low-concentration matrices (like CSF), we recommend concentrating samples or optimizing extraction protocols.
How is data normalized for comparison across different sample types or conditions?
We normalize data based on protein content, cell number, or tissue weight where appropriate. Internal standards and quality control samples are used to ensure cross-batch comparability.
What types of controls should I include in my study?
We recommend including biological replicates, vehicle-treated controls, and, if possible, known purine pathway modulators (e.g., allopurinol for xanthine oxidase inhibition) to validate the system's responsiveness.
Do you offer statistical analysis or bioinformatics support?
Yes. For larger studies or multi-condition designs, we can provide multivariate analysis, clustering, PCA, and pathway enrichment tools to help interpret your purine data in a systems biology context.
Is your service suitable for time-course or pharmacokinetic studies?
Yes, our platform is ideal for dynamic profiling. We support analysis of multiple time points, allowing you to track purine fluctuations during treatment, stress response, or cell cycle phases.
Learn about other Q&A.
Purines Analysis Service Case Study
Title: Comprehensive quantification of purine and pyrimidine metabolism in Alzheimer's disease postmortem cerebrospinal fluid by LC–MS/MS with metal-free column
Journal: Biomedical Chromatography
Published: 2018
- Background
- Methods
- Results
- Reference
Alzheimer's disease (AD) is a neurodegenerative disorder characterized by progressive cognitive decline and behavioral disturbances in the elderly. Pathologically, it involves neurofibrillary tangles of tau protein and amyloid β plaques. Beyond these, mitochondrial dysfunction, neuroinflammation, and neurotransmitter disruptions are implicated in its progression. Purine and pyrimidine metabolism, critical for energy transfer and cellular regulation, have been linked to AD pathology.
The study employed liquid chromatography with tandem mass spectrometry (LC–MS/MS) for comprehensive analysis of 40 nucleobases, nucleosides, nucleotides, and phosphorylated metabolites involved in purine and pyrimidine metabolic pathways, typical of metabolomics studies. A metal-free PEEK column was utilized to overcome chromatographic challenges associated with interactions between phosphorylated residues and metal surfaces, which typically lead to peak tailing and reduced sensitivity.
The optimized LC–MS/MS method utilized a mobile phase of pH 7 with 10 mM ammonium formate to enhance stability and sensitivity, essential for metabolite detection in complex biological samples. Injection volume was set at 2 μl to ensure optimal peak shape and avoid double-peaking issues observed at higher volumes. Gradient elution conditions were tailored to achieve efficient separation and cleaning of the column, crucial for maintaining consistent performance and minimizing carryover in metabolomics analyses.
Analytical performance validation demonstrated the method's robustness: calibration curves exhibited excellent linearity (r² > 0.9959) across a concentration range of 5 nM to 0.1 mM for all compounds. The method achieved low limits of detection (LOD) ranging from 0.5 to 250 nM and limits of quantification (LOQ) ranging from 1 to 500 nM, surpassing those reported for ion-pairing LC–MS/MS methods (Laourdakis, 2014). Recovery rates for most compounds ranged from 70.5% to 144% in 10-fold diluted postmortem cerebrospinal fluid (pCSF) samples, indicating satisfactory accuracy for quantification despite matrix effects.
Application of the method to pCSF samples from control subjects and AD patients revealed detectable levels of 15 targeted compounds above LOQ values, predominantly downstream metabolites of purine and pyrimidine pathways. Statistical analysis, while showing variability among individual samples, indicated potential differences in nucleotide concentrations between control and AD groups, highlighting the method's utility in biomarker discovery and disease mechanism elucidation.
Reference
- Muguruma, Yoshio, et al. "Comprehensive quantification of purine and pyrimidine metabolism in Alzheimer's disease postmortem cerebrospinal fluid by LC–MS/MS with metal‐free column." Biomedical Chromatography 34.2 (2020): e4722. https://doi.org/10.1002/bmc.4722
Publications
Here are some of the metabolomics-related papers published by our clients:

- White matter lipid alterations during aging in the rhesus monkey brain. 2024. https://doi.org/10.1007/s11357-024-01353-3
- Multiomics of a rice population identifies genes and genomic regions that bestow low glycemic index and high protein content. 2024. https://doi.org/10.1073/pnas.2410598121
- The Brain Metabolome Is Modified by Obesity in a Sex-Dependent Manner. 2024. https://doi.org/10.3390/ijms25063475
- Characterization of Dnajc12 knockout mice, a model of hypodopaminergia. 2024. https://doi.org/10.1101/2024.07.06.602343
- Pan-lysyl oxidase inhibition disrupts fibroinflammatory tumor stroma, rendering cholangiocarcinoma susceptible to chemotherapy. 2024. https://doi.org/10.1097/HC9.0000000000000502
- Glycine supplementation can partially restore oxidative stress-associated glutathione deficiency in ageing cats. 2024. https://doi.org/10.1017/S0007114524000370
- The activity of the aryl hydrocarbon receptor in T cells tunes the gut microenvironment to sustain autoimmunity and neuroinflammation. 2023. https://doi.org/10.1371/journal.pbio.3002000
- Lipin-1 regulates lipid catabolism in pro-resolving macrophages. 2020. https://doi.org/10.1101/2020.06.03.121293
- Characterization of a novel AraC/XylS-regulated family of N-acyltransferases in pathogens of the order Enterobacterales. 2020. https://doi.org/10.1371/journal.ppat.1008776