FFPE Spatial Proteomics Service (High-Resolution MS)
Turn your archival tissue blocks into deep, functional maps of biology.
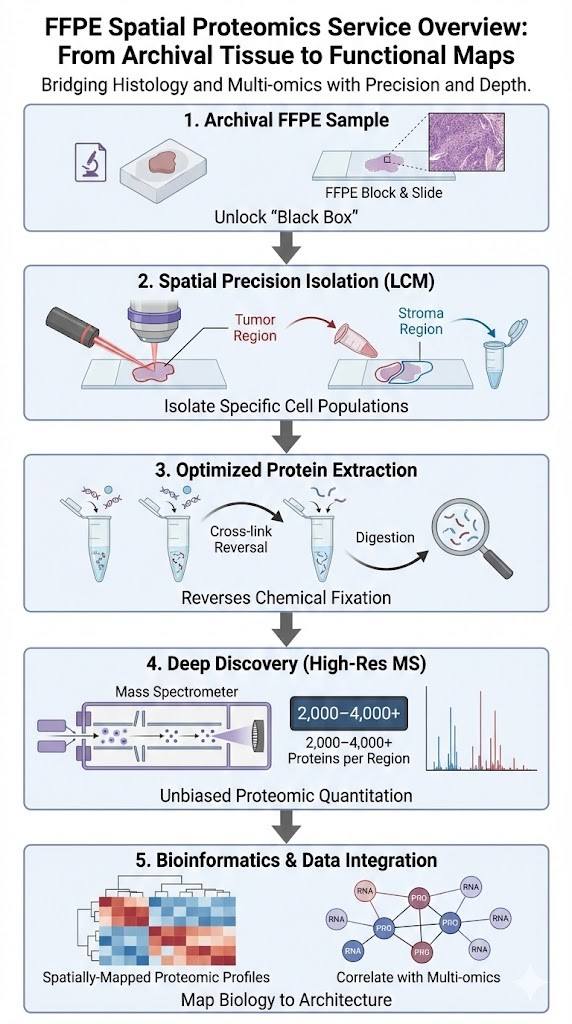
For decades, formalin-fixed paraffin-embedded (FFPE) tissues have been the gold standard for clinical storage, offering a vast repository of disease history. However, these samples have historically remained a "black box" for deep proteomic analysis due to the extensive chemical cross-linking induced by fixation. Creative Proteomics unlocks this treasure trove of data with our FFPE Spatial Proteomics Service (High-Resolution MS).
We bridge the critical gap between histology and multi-omics. By combining precise Laser Capture Microdissection (LCM) with ultra-sensitive Mass Spectrometry (MS), we allow researchers to isolate specific cell populations or morphological regions directly from FFPE slides and quantify thousands of proteins with high fidelity.
Key Capabilities:
- Spatial Precision: Isolate specific cell types (e.g., tumor epithelium vs. stromal fibroblasts) or defined histological regions with microscopic accuracy.
- Deep Discovery: Identify and quantify 2,000–4,000+ proteins per region (unbiased discovery), far exceeding the 50–100 targets of standard imaging panels.
- Archival Compatibility: Proprietary lysis and digestion protocols designed to effectively reverse methylene bridge cross-links in standard FFPE blocks.
- Bioinformatics Support: Full data integration services to map proteomic profiles back to tissue architecture and correlate with transcriptomic data.
Regulatory Note: This service is for Research Use Only (RUO). It is not intended for use in diagnostic or therapeutic procedures.
Request a Quote
×
- Overview
- Workflow
- Applications
- Case Study
- Specifications
- FAQs
Beyond scRNA-seq: Why Spatial Proteomics Matters
In the modern era of single-cell biology, context is everything. Single-cell RNA sequencing (scRNA-seq) has revolutionized cancer research and developmental biology by identifying distinct cell clusters and trajectories. However, scRNA-seq inherently lacks two critical dimensions required for a complete biological picture: Spatial Context and Protein Validation.
The "Transcript vs. Protein" Gap
It is a well-established biological reality that mRNA levels do not always correlate with protein abundance. The correlation coefficient between the transcriptome and proteome is often as low as 0.4–0.6. Proteins are the functional effectors of the cell, and their abundance is regulated by mechanisms invisible to RNA sequencing, such as translation efficiency, protein half-life, and degradation rates. Relying solely on RNA data means missing critical insights into post-translational modifications (PTMs), active signaling states, and actual phenotypic drivers.
Why Standard Imaging Isn't Enough
Traditional Immunohistochemistry (IHC) or Immunofluorescence (IF) preserves spatial context but is severely limited by the availability and specificity of antibodies. Even highly multiplexed imaging platforms are restricted to a pre-selected panel of 20–100 targets. You can only see what you already know to look for ("The Lamppost Effect").
The Solution: Unbiased Spatial Proteomics
Our service offers the best of both worlds. We retain the precise spatial information of histology while leveraging the "discovery power" of Mass Spectrometry. This allows you to:
- Validate scRNA-seq Clusters: Conclusively prove that the transcriptomic clusters you discovered actually exist as functional protein networks in situ.
- Discover Novel Biomarkers: Identify new protein markers, isoforms, or splice variants in specific tissue niches without the bias of pre-selected antibodies.
- Map the Microenvironment: Quantify the complex signaling crosstalk between tumor cells and immune infiltrates (e.g., exhausted T-cells vs. macrophages) in their native arrangement.
Our High-Resolution Spatial Workflow
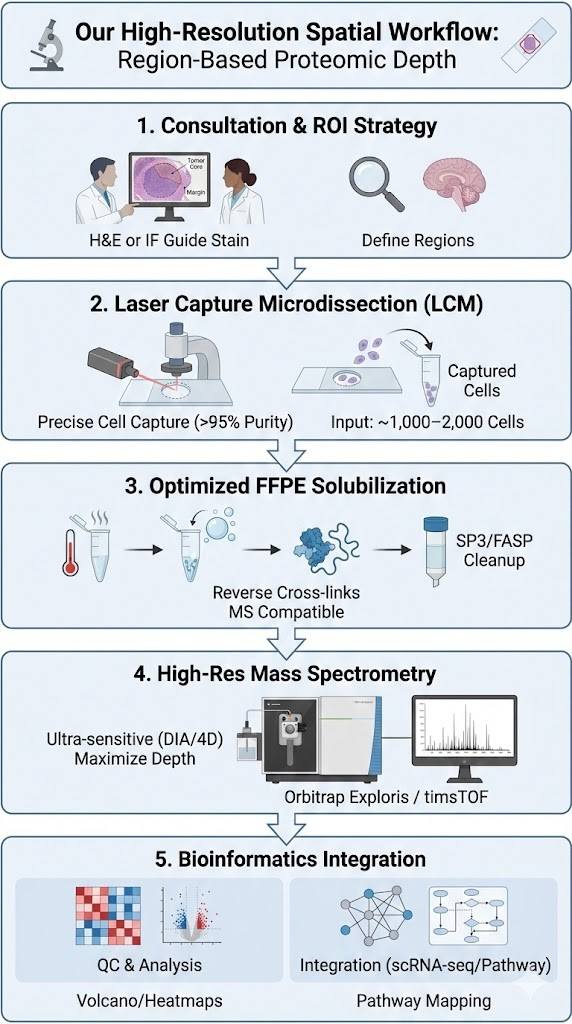
We utilize a rigorous "Region-Based" spatial approach. Unlike pixel-based MALDI imaging (which trades proteomic depth for resolution), our workflow prioritizes Proteomic Depth within defined morphological regions.
1. Consultation & ROI Strategy
We assess your FFPE block quality and define a robust spatial strategy (e.g., Tumor Core vs. Margin). We select the optimal guide stain (H&E or IF) to visualize targets.
2. Laser Capture Microdissection (LCM)
Using advanced LCM systems (Leica/Zeiss), we precisely cut and capture cells directly from membrane slides. This ensures >95% purity and zero contamination. Typical input: ~1,000–2,000 cells.
3. Optimized FFPE Solubilization
We use proprietary "High-Heat + High-Detergent" protocols to effectively reverse formalin cross-links and solubilize the proteome, followed by rigorous cleanup (SP3/FASP) for MS compatibility.
4. High-Res Mass Spectrometry
Peptides are analyzed on ultra-sensitive platforms (Orbitrap Exploris / timsTOF) using Data-Independent Acquisition (DIA) or 4D-Proteomics to maximize depth and sensitivity from low-input samples.
5. Bioinformatics Integration
We deliver QC reports, LFQ abundance tables, and differential expression analysis (Volcano/Heatmaps). Optional modules include scRNA-seq integration and pathway mapping.
Applications: Validating Targets in Context
Our clients use this service to answer complex biological questions that require both the "Where" (Location) and the "What" (Function).
1. Tumor Heterogeneity & TME Profiling
- Tumor Sub-clones: Tumors are not uniform masses; they are complex ecosystems containing distinct sub-clones and microenvironmental niches. Bulk analysis averages out these critical signals.
- Application: Compare protein expression in the Tumor Core vs. the Invasive Margin vs. Adjacent Normal Tissue.
- TME Insight: Specifically isolate the stromal compartment to analyze Cancer-Associated Fibroblasts (CAFs) or immune aggregates (Tertiary Lymphoid Structures).
- Result: Identify specific proteins driving metastasis at the invasive front, or mechanisms of immune exclusion in the stroma (e.g., collagen barriers or TGF-beta signaling).
2. scRNA-seq Confirmation & "Dropout" Recovery
- The Problem: A major limitation of scRNA-seq is "gene dropout," where low-abundance transcripts are missed. Reviewers frequently ask: "Is this RNA cluster real?"
- Application: Use your scRNA-seq clusters to guide LCM region selection. If you identified a "hypoxic" cluster, we can dissect hypoxic regions (guided by HIF-1a staining) and profile them.
- Result: Confirm that the unique transcriptomic signature of a rare cell population is reflected in the proteome. Recover functional information (receptors, secreted factors) that was lost in the RNA dropout noise.
3. Neuroscience & Brain Mapping
- Structure is Function: The brain is the most spatially complex organ.
- Application: Isolate specific brain nuclei, cortical layers (e.g., Layer V neurons), or pathological features like Amyloid Plaques or Neurofibrillary Tangles from archival brain banks.
- Result: Map layer-specific proteomes in neurodegenerative disease models (Alzheimer's, Parkinson's) to understand the local proteostasis environment surrounding toxic aggregates.
4. Clinical Biomarker Discovery
- Biobank Access: Retrospective studies often rely on hospital biobanks where only FFPE blocks are available.
- Application: Analyze "Responder" vs. "Non-Responder" patient biopsies from clinical trials.
- Result: Discover predictive protein biomarkers that correlate with therapeutic outcome, which can be developed into IHC assays for patient stratification.
Case Study: Scientific Benchmark
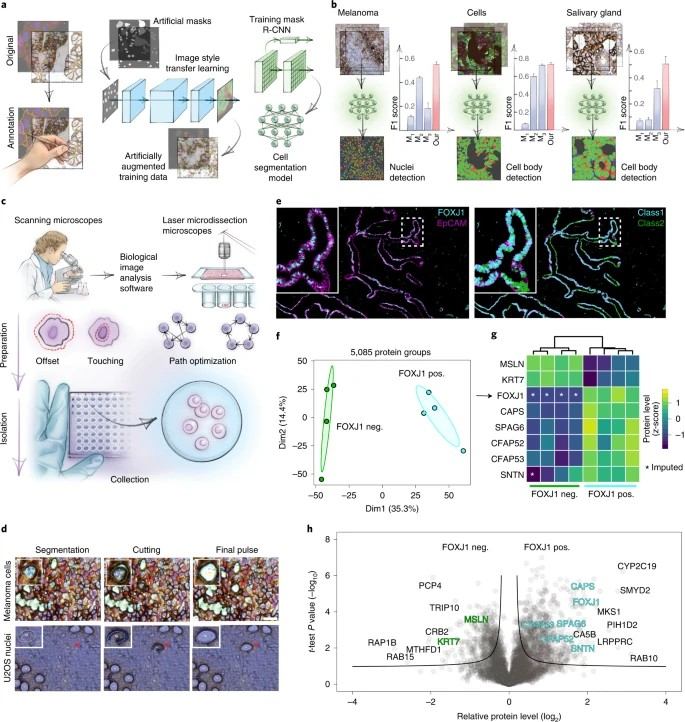
Benchmark Study: Deep Visual Proteomics defines single-cell identity and heterogeneity
Mundas, A., et al. (2022). Nature Biotechnology
- Background
- Methods
- Results
- Conclusions
The Challenge: The researchers needed to resolve the heterogeneity of melanoma cells and their interaction with the immune system. Bulk proteomics obscured the subtle signaling occurring at the tumor-immune interface, and single-cell RNA-seq could not capture the protein-level effectors of these interactions.
Methodology: The team utilized a workflow identical in principle to our service:
- High-Res Imaging: Phenotyping cells using advanced microscopy and AI-based segmentation.
- Laser Microdissection: Precisely cutting out melanocytes and adjacent immune cells from membrane slides.
- Ultra-Sensitive MS: Analyzing the tiny samples (hundreds of cells) to quantify the proteome.
Results: The study quantified over 5,000 proteins from these micro-regions. Crucially, they mapped the spatial distribution of key metabolic and signaling proteins, revealing functional states of cancer cells that were dependent on their location relative to immune cells—states that were completely invisible in non-spatial methods.
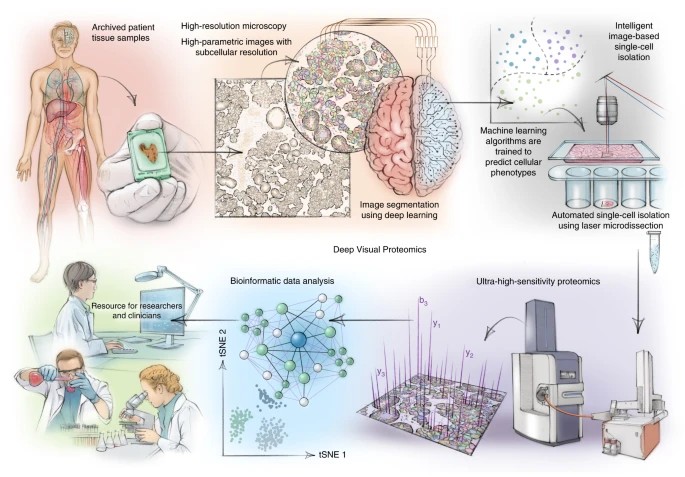 Concept of linking microscopy to MS (Representative Benchmark).
Conclusion: This study proves that combining LCM with modern Mass Spectrometry allows for "NSC-level" (Nature, Science, Cell) discovery. Creative Proteomics brings this same high-impact capability to your lab, operationalizing this cutting-edge workflow for your specific FFPE samples.
Technical Specifications & QC Standards
We are committed to transparency, reproducibility, and rigorous Quality Control.
| Feature | Specification |
|---|---|
| Sample Type | FFPE blocks (Standard) or Unstained Membrane Slides (PEN/PET). 10μm thickness recommended. |
| Input Requirements | Approx. 500–2,000 cells per ROI (Tissue dependent). Minimum area ~0.05 mm2;. |
| Proteome Depth | Typically 1,500 – 4,000 proteins per sample (dependent on tissue complexity and input amount). |
| Precision (CV) | < 15% CV (Coefficient of Variation) on technical replicates; typically<10% for high-abundance proteins. |
| Workflow Turnaround | Standard: 4–6 weeks. Fast-track options available upon request. |
| Data Format | Analysis-ready Excel/CSV Reports + Raw Data Files (.raw/ .d). |
| Equipment | High-Resolution LC-MS/MS (e.g., Thermo Orbitrap Exploris 480, Bruker timsTOF Pro/HT). |
Frequently Asked Questions (FAQ)
Can you perform spatial proteomics on old archival FFPE blocks?
Yes. While protein quality does degrade over time due to oxidation and hydrolysis, our optimized antigen retrieval and lysis protocols are designed to handle archival clinical samples effectively. We have successfully processed samples that have been stored for several years. For extremely old samples (>10 years), we strongly recommend a pilot study to assess proteome quality before processing a large cohort.
How is this service different from MALDI Imaging (MSI)?
MALDI-MSI provides a pixel-by-pixel image but typically detects fewer proteins (often limited to abundant proteins, lipids, or metabolites) without direct sequence identification. Our LCM-MS service is "Region-Based," meaning it sacrifices pixel resolution for significantly deeper proteome coverage (>2,000 proteins) and confident peptide identification. It is the preferred choice for deep mechanistic studies. For lipid or metabolite imaging, please check our Spatial Metabolomics / MALDI-MSI Services.
What is the minimum tissue area or cell count required?
This depends on the cellular density and protein content of the specific tissue. Generally, we recommend capturing an area equivalent to approx. 0.1 mm2; or roughly 1,000 cells to ensure deep proteome coverage. We can work with smaller inputs (down to hundreds of cells), but the total number of identified proteins may decrease.
Do I need to provide the antibodies?
No! That is the beauty of Mass Spectrometry. It is an "unbiased" omics approach, meaning we detect all extractable proteins in the sample (Discovery Mode). You do not need to select targets or provide antibodies beforehand, unlike in IHC or antibody-based spatial panels.
References
- Mundas, A., et al. Deep Visual Proteomics defines single-cell identity and heterogeneity. Nature Biotechnology. 2022.
- Piehowski, P. D., et al. Automated, high-throughput processing of ultra-low input samples for proteomics. Nature Communications. 2020.
- Doll, S., et al. Proteomic cartography of the human heart. Nature Communications. 2017.


