

Why Quantification Matters in MSI
Mass spectrometry imaging (MSI) is best known for producing visually striking ion heatmaps that map molecular distributions across tissue sections — a core capability of spatial metabolomics by mass spectrometry imaging. These images answer the question "where is this molecule?" — but they do not answer "how much is there?" A bright red pixel in an ion image may represent a genuinely high local concentration, or it may reflect regionally enhanced ionization efficiency unrelated to abundance. Without quantification, MSI remains a qualitative or, at best, semi-quantitative technique.
The Relative-to-Absolute Continuum in Spatial Metabolomics
MSI quantification exists on a spectrum. At the qualitative end, ion images are displayed on arbitrary intensity scales and compared only within a single experiment. Relative quantification — comparing the same analyte across tissue regions within one acquisition — adds value by revealing spatial gradients and hot spots, but cannot express concentrations in meaningful units (pmol/mg tissue, ng/g, μM). Absolute quantification, the gold standard, produces concentration maps where each pixel value represents an independently calibrated quantity traceable to a reference standard.
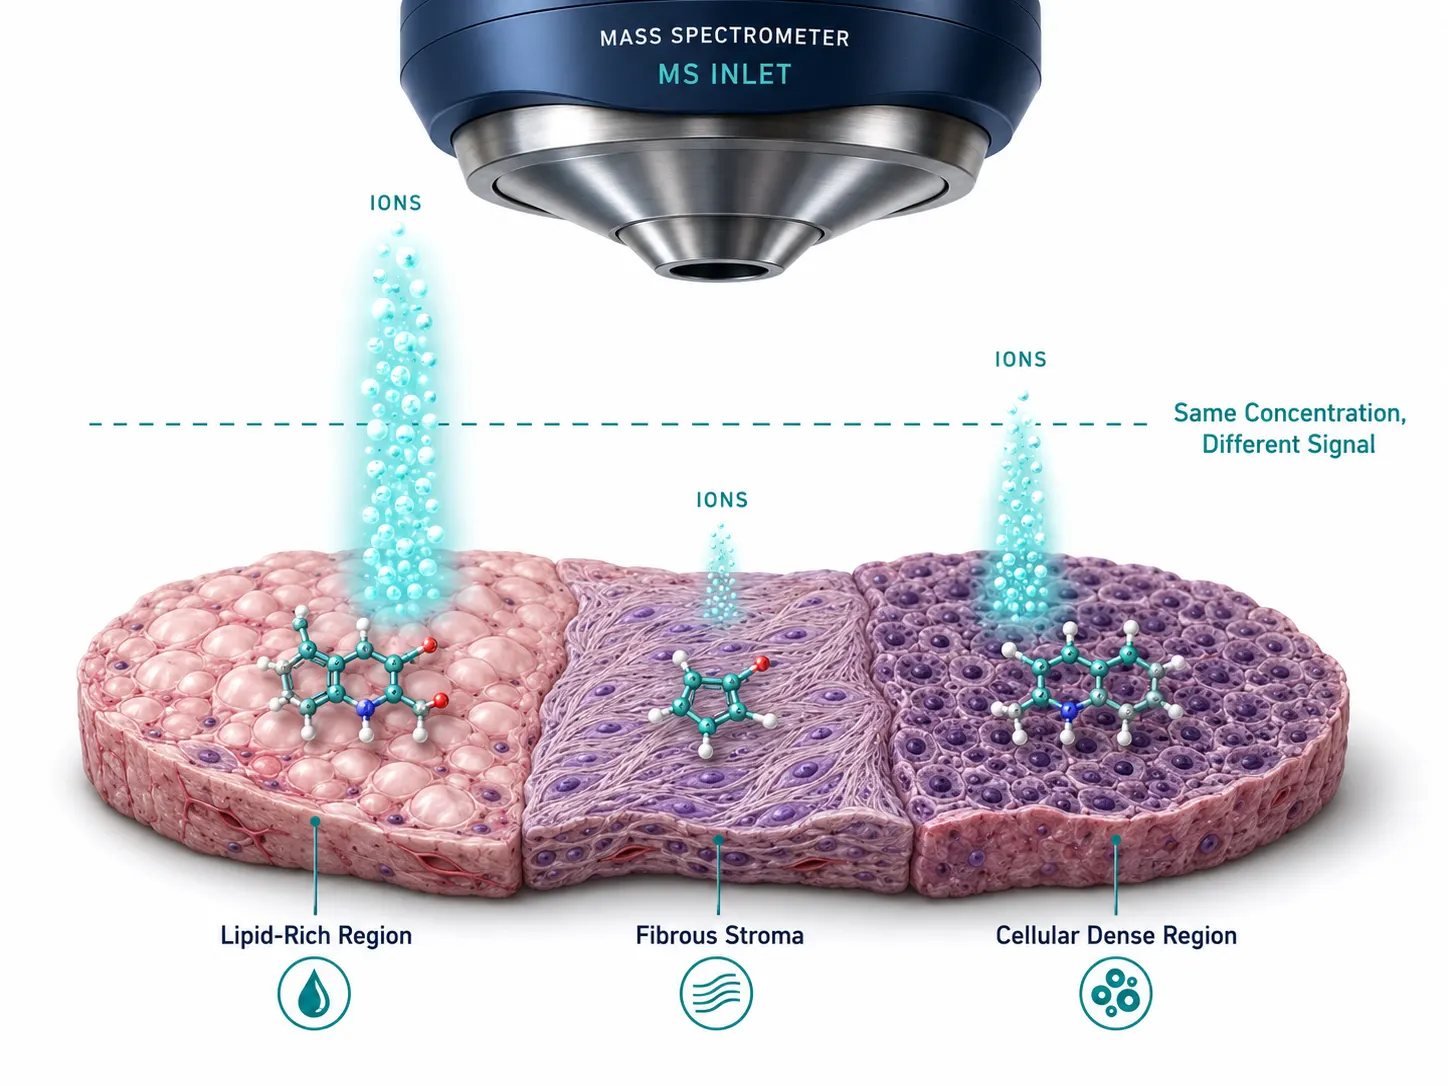 Figure 1: The QMSI Challenge — Ion Suppression Heterogeneity Across Tissue Compartments. A conceptual cross-section of heterogeneous tissue showing how identical analyte concentrations in different microenvironments (lipid-rich vs. protein-rich vs. aqueous) produce different ion intensities due to variable ionization efficiency and matrix effects. The same color scale applied to raw ion images can misrepresent true concentration by an order of magnitude between adjacent pixels, motivating the calibration strategies detailed in Sections 2-5.
The jump from relative to absolute is nontrivial. It requires building a calibration function that relates MSI ion intensity to analyte concentration — and this calibration function must account for the fact that every pixel in an MSI image represents a chemically distinct micro-environment with its own extraction efficiency, ionization efficiency, and ion suppression characteristics.
Use Cases Demanding Absolute Quantification
Absolute quantification in MSI is not an academic exercise — specific applications cannot proceed without it. Pharmaceutical tissue distribution studies require drug concentrations in μg/g tissue to compare with plasma pharmacokinetic data and establish tissue-to-plasma ratios. Clinical biomarker studies need quantitative thresholds (e.g., "above X pmol/mg indicates tumor-positive margin") to translate MSI into diagnostic decision support. Cross-study and cross-laboratory comparability — the foundation of reproducible science — is impossible without calibrated concentration values. Regulatory submissions to agencies such as the FDA increasingly expect quantitative mass spectrometry data, including from imaging experiments.
The Quantification Challenge in MSI: Why Harder Than LC-MS/MS
In conventional LC-MS/MS quantification, a homogeneous liquid sample is introduced into the ion source under constant conditions; matrix effects are managed through chromatographic separation and stable isotope-labeled (SIL) internal standards co-eluting with the analyte — the same principle underlying validated targeted metabolomics assays. Every sample in the batch experiences the same ionization environment.
In MSI, the "sample" is a tissue section with spatially heterogeneous composition. A pixel in the lipid-rich white matter of brain tissue ionizes very differently from a pixel in the metabolite-rich gray matter. The matrix — in this context, the endogenous tissue components that compete for charge during ionization — varies pixel by pixel. Extraction efficiency depends on local tissue density, lipid content, and hydration. Ion suppression can differ by an order of magnitude between adjacent pixels.
The internal standard problem compounds these challenges. In LC-MS/MS, a SIL analog of the target analyte can be spiked into every sample at known concentration. In MSI, applying an internal standard homogeneously across a tissue section is physically difficult — spraying, spotting, or subliming the standard onto the surface introduces its own spatial variability. Furthermore, SIL standards exist for only a small fraction of the hundreds of metabolites and lipids detected in an untargeted MSI experiment — a limitation shared with MALDI-imaging lipidomics workflows, where the diversity of lipid species far exceeds the availability of labeled standards.
Three Dominant Calibration Strategies — Head-to-Head
Strategy 1: Off-Tissue Spotting
Off-tissue spotting is the simplest calibration approach: a dilution series of the target analyte is deposited as discrete droplets onto an empty region of the same microscope slide (adjacent to but not on the tissue), and these spots are analyzed alongside the tissue. A calibration curve is constructed from the spotted standards, and tissue pixel intensities are converted to concentrations by interpolation.
Advantages include simplicity, minimal tissue consumption, and the ability to prepare the calibration series independently of the tissue. The primary disadvantage is that the calibration spots experience a fundamentally different matrix environment than the tissue — there is no tissue background to cause ion suppression, so the calibration curve systematically underestimates the degree of suppression in real tissue pixels. Off-tissue calibration is best suited for applications where only approximate (±2-3 fold) quantification is required and where a SIL internal standard can be applied homogeneously to both spots and tissue to partially correct for matrix differences.
Strategy 2: On-Tissue Serial Dilution
On-tissue calibration deposits the dilution series directly onto a control tissue section (or a tissue region adjacent to the region of interest). This ensures the standards experience the same tissue matrix as the sample, providing a more realistic calibration function.
The trade-off is complexity. Finding a suitable "blank" tissue region that is histologically matched to the sample region is often impossible — a control tissue section from a different animal or a contralateral region introduces its own biological variability. The standard deposition itself can cause analyte delocalization if the solvent volume is too large, and the standards may not penetrate the tissue to the same depth as endogenous analytes. On-tissue calibration is the method of choice when high accuracy (±20-50%) is required and a matched tissue substrate is available.
Strategy 3: Mimetic Tissue Homogenates
Mimetic tissue models — also called tissue-mimicking calibrants — are prepared by homogenizing control tissue, spiking the homogenate with known concentrations of the target analyte(s), and then sectioning the frozen homogenate block to produce calibration standards with matrix composition nearly identical to the sample tissue.
This approach provides the best matrix matching of any calibration strategy because the calibrant is made from the same tissue type. The homogenization step ensures uniform analyte distribution, and the resulting calibration sections can be mounted on the same slide as the sample for true same-slide calibration. The limitations are practical: preparing a homogenate calibration series is labor-intensive (requiring tissue pooling, spiking, freezing, cryosectioning), consumes substantial amounts of tissue, and must be repeated for each tissue type studied. Mimetic tissue calibration is the gold standard for demanding applications such as regulatory drug distribution studies where quantification accuracy within ±15% is expected.
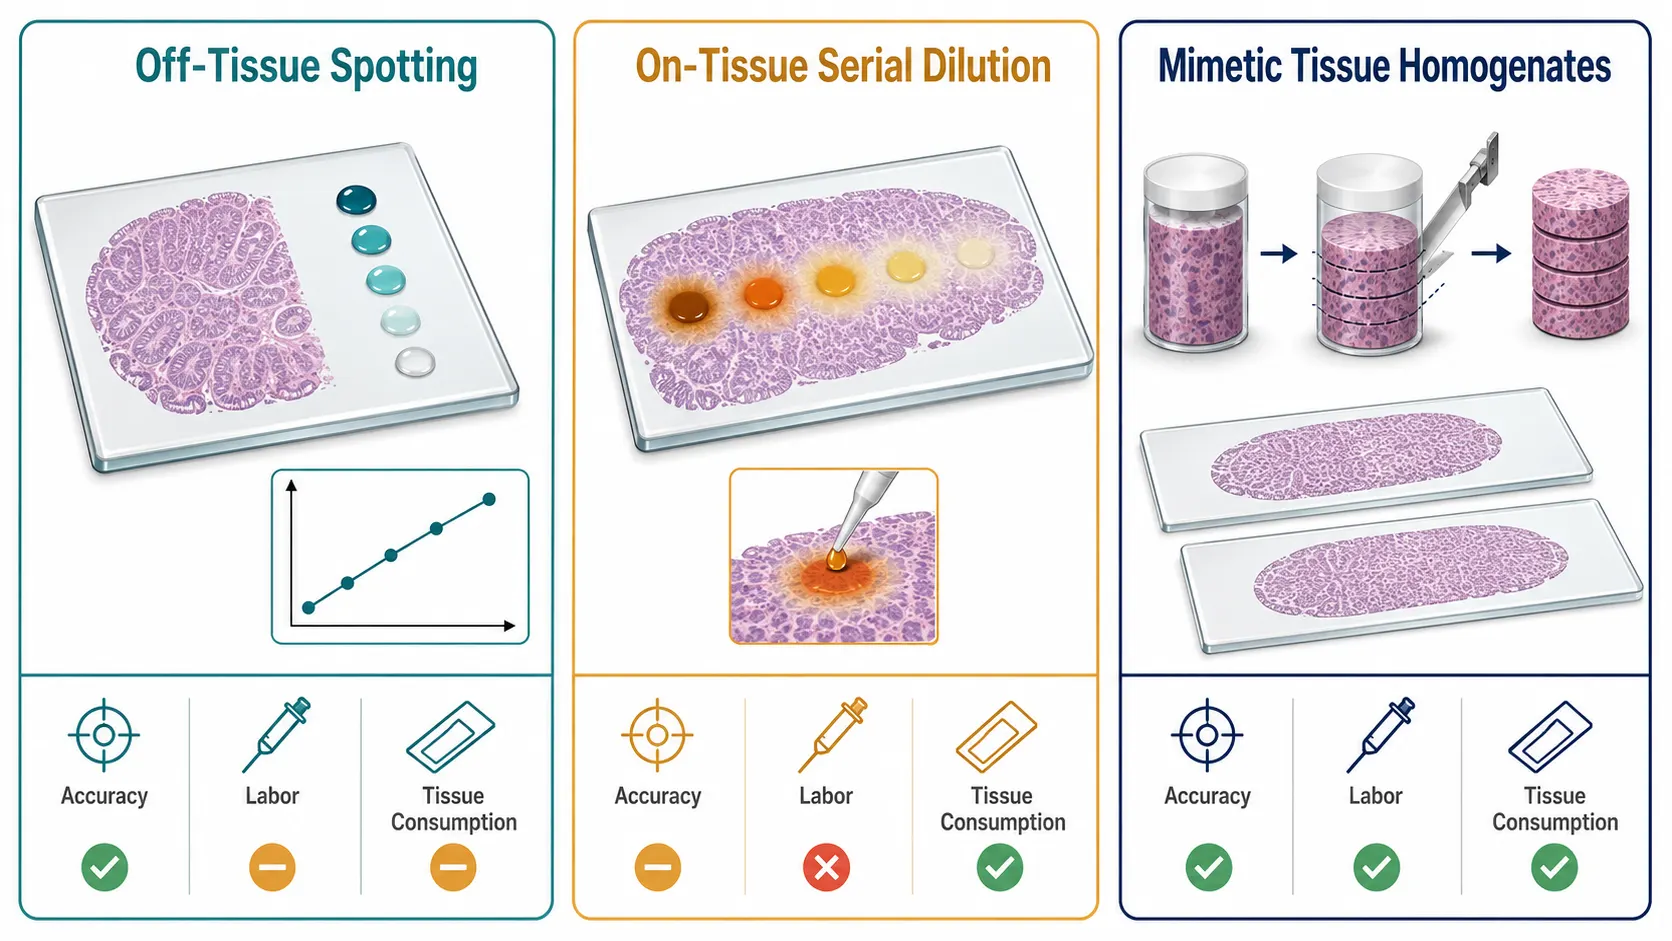 Figure 2: Three QMSI Calibration Strategies — Side-by-Side Comparison. Side-by-side 3D illustrations of the three dominant QMSI calibration approaches: (A) off-tissue spotting — a dilution series deposited adjacent to tissue on the same slide; (B) on-tissue serial dilution — standards deposited directly onto a control tissue section; (C) mimetic tissue homogenate — a spiked homogenate block sectioned into calibration standards with near-identical matrix composition to the sample. Each panel shows the deposition method, the resulting calibration curve, and the trade-off between accuracy and labor intensity.
Decision Framework
| Criterion | Off-Tissue Spotting | On-Tissue Dilution | Mimetic Tissue |
|---|---|---|---|
| Accuracy needed | Low (±2-3 fold) | Medium (±20-50%) | High (±15%) |
| Tissue consumption | None | Control section | Homogenate block |
| Labor intensity | Low | Medium | High |
| Matrix matching | Poor | Good | Excellent |
| Best for | Screening, relative trends | Biomarker thresholds | Regulatory PK studies |
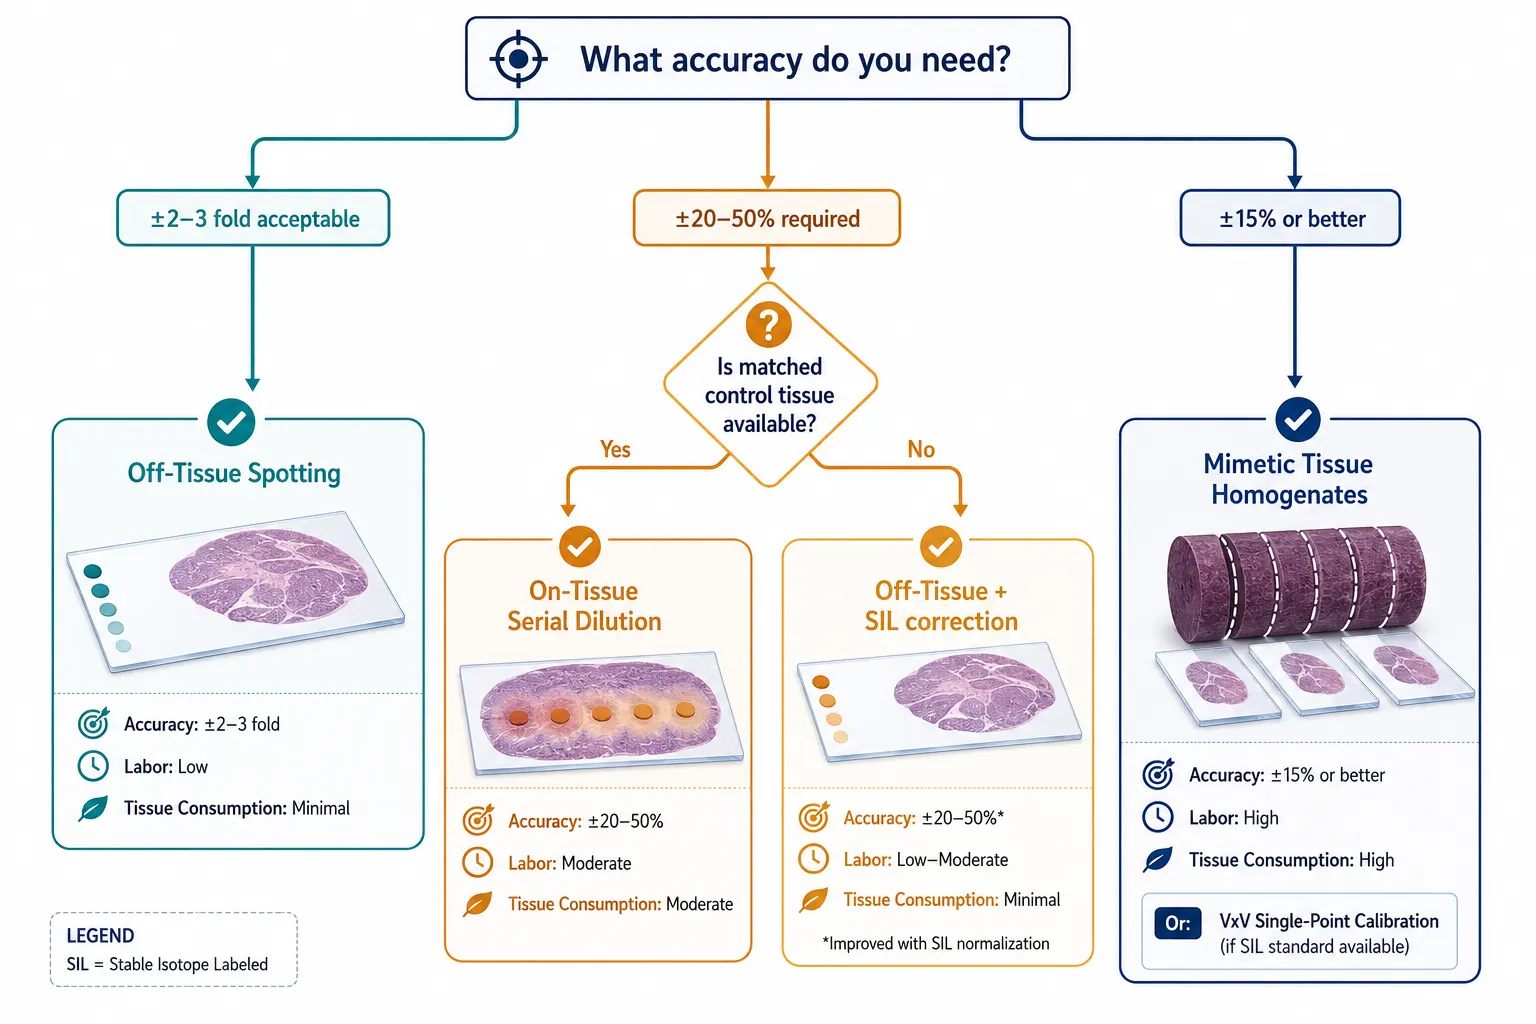 Figure 3: Calibration Strategy Decision Flowchart. A branching decision tree that guides selection among off-tissue, on-tissue, and mimetic tissue calibration based on four criteria: required accuracy (±15% to ±2-3 fold), tissue availability, labor budget, and regulatory requirements. Terminal nodes recommend the appropriate strategy with a brief rationale, cross-referencing the comparison table in Section 2.
Next-Generation QMSI Methods (2025-2026)
Voxel-by-Voxel Single-Point Calibration
Bruce, Kibbe, and Muddiman (2025) introduced a paradigm shift in QMSI calibration: instead of building a multi-point calibration curve across tissue regions, apply a single known amount of SIL internal standard uniformly beneath the tissue section so that every pixel has its own internal standard reference point. Called voxel-by-voxel (V × V) single-point calibration, the method sprays SIL-glutathione homogeneously onto a microscope slide, places the tissue section on top, and then images both endogenous glutathione and the SIL-GSH signal simultaneously using IR-MALDESI with parallel reaction monitoring (PRM).
The result is a per-pixel concentration map where each voxel is individually calibrated against the SIL signal in that same voxel — inherently accounting for pixel-to-pixel matrix variation without the need for a multi-point calibration curve. The method demonstrated high precision across a wide concentration range in mouse liver, and the MSiReader Pro software now includes a dedicated V × V quantification tool for automated per-voxel concentration output. The current limitation is that spray deposition of SIL standard beneath the tissue introduces systematic bias from unknown spray exhaust volume; improving sprayer calibration is an active area of development.
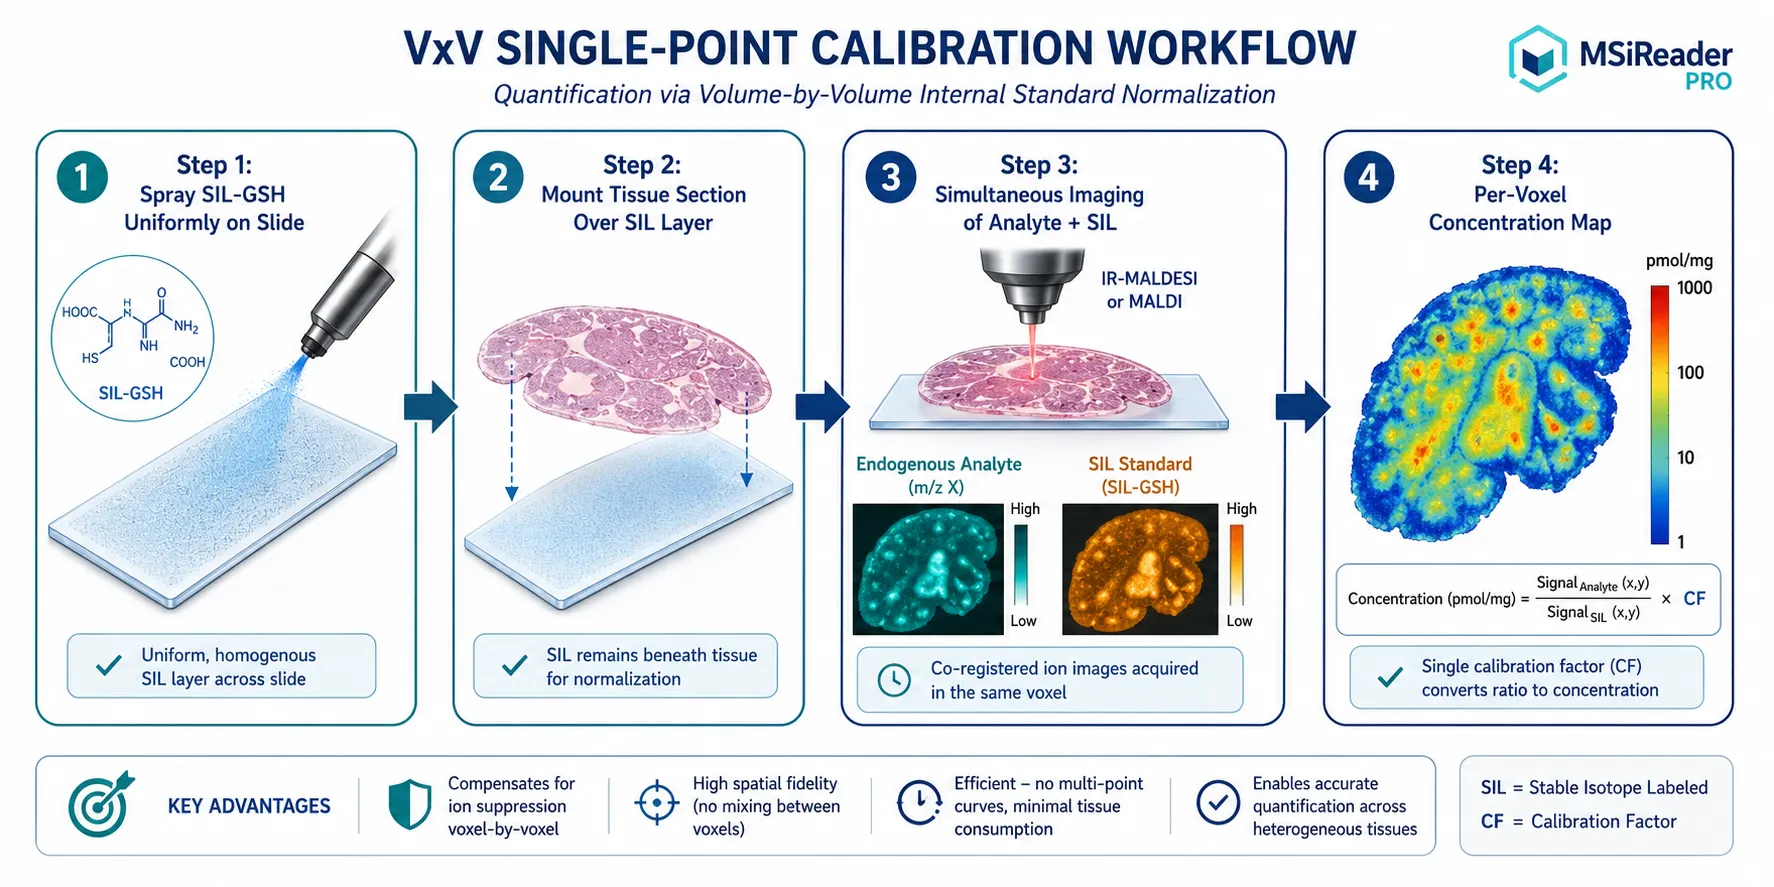 Figure 4: Voxel-by-Voxel Single-Point Calibration Workflow. Horizontal workflow diagram illustrating the Bruce, Kibbe & Muddiman (2025) V×V method: (1) uniform spray deposition of SIL internal standard beneath the tissue section on a microscope slide, (2) tissue mounting atop the SIL layer, (3) IR-MALDESI imaging with parallel reaction monitoring (PRM) simultaneously capturing endogenous and SIL signal per pixel, and (4) per-voxel concentration calculation using the SIL signal as an internal reference for each pixel, inherently correcting for spatial matrix heterogeneity.
Tissue Extinction Coefficient (TEC) Normalization
TEC normalization addresses ion suppression heterogeneity by measuring the ratio of analyte signal on tissue versus off tissue. A TEC value below 1.0 indicates ion suppression in that tissue region; above 1.0 indicates enhancement. By segmenting tissue into anatomical regions (via clustering algorithms or histological annotation) and applying region-specific TEC correction factors, the apparent concentration bias introduced by differential suppression can be substantially reduced.
TEC has been validated for both MALDI mass spectrometry imaging and DESI mass spectrometry imaging, with the technique applicable to any ionization modality where off-tissue reference regions can be defined. In a head-to-head comparison on mouse brain sections coated with olanzapine, DESI showed systematically less ion suppression than MALDI, and regional TEC normalization outperformed conventional total-ion-current (TIC) normalization for both techniques. A 2025 Nature Communications study applying TEC to AFADESI-MSI glucose imaging across multiple mouse organs demonstrated that labeled glucose fractions after TEC correction were identical to unnormalized values — suggesting that isotopically labeled tracers may inherently self-correct for matrix effects, an intriguing observation with implications for tracer-based metabolic imaging studies.
AI and Machine Learning for QMSI
The most transformative QMSI advance of 2025-2026 is the application of convolutional neural networks (CNNs) to predict absolute analyte concentration directly from ion images — effectively replacing physical calibration curves with learned calibration functions.
Kibbe, Hector, and Muddiman (2026) demonstrated a CNN + transfer learning pipeline for glutathione quantification. A base CNN was pre-trained on approximately 80,000 augmented ion images from the METASPACE database (liver tissue), learning general features of MSI ion distributions. Transfer learning was then applied by freezing the convolutional layers and retraining only the regression head on a small set of SIL-GSH calibration images. The model achieved nRMSE of 0.0269 on unseen test data with a regression line of y = 0.9777x (R2 = 0.9925) — performance approaching the precision of physically calibrated QMSI while requiring dramatically fewer calibration samples.
The significance of this approach extends beyond accuracy. A pre-trained CNN model for a given analyte/tissue combination can be shared between laboratories via simple file transfer, enabling "calibrate once, quantify everywhere" workflows that reduce inter-lab variability without requiring each lab to perform its own full calibration. The reduced calibration burden — from dozens of spotted standards to a handful of images for transfer learning — makes quantitative MSI feasible for studies where extensive calibration was previously prohibitive. Looking forward, the prospect of community-maintained pre-trained models for common analyte/tissue pairs (glutathione/liver, dopamine/brain, various lipids/kidney) could standardize QMSI quantification across the field in much the same way that shared spectral libraries standardized metabolite identification.
The complementary approach by Golpelichi and Parastar (2023) used multivariate curve resolution (MCR-ALS) to generate pixel-level concentration labels for CNN training, achieving R2 values of 0.93-0.96 for chlordecone quantification in mouse liver — outperforming both SVM and PLS regression baselines.
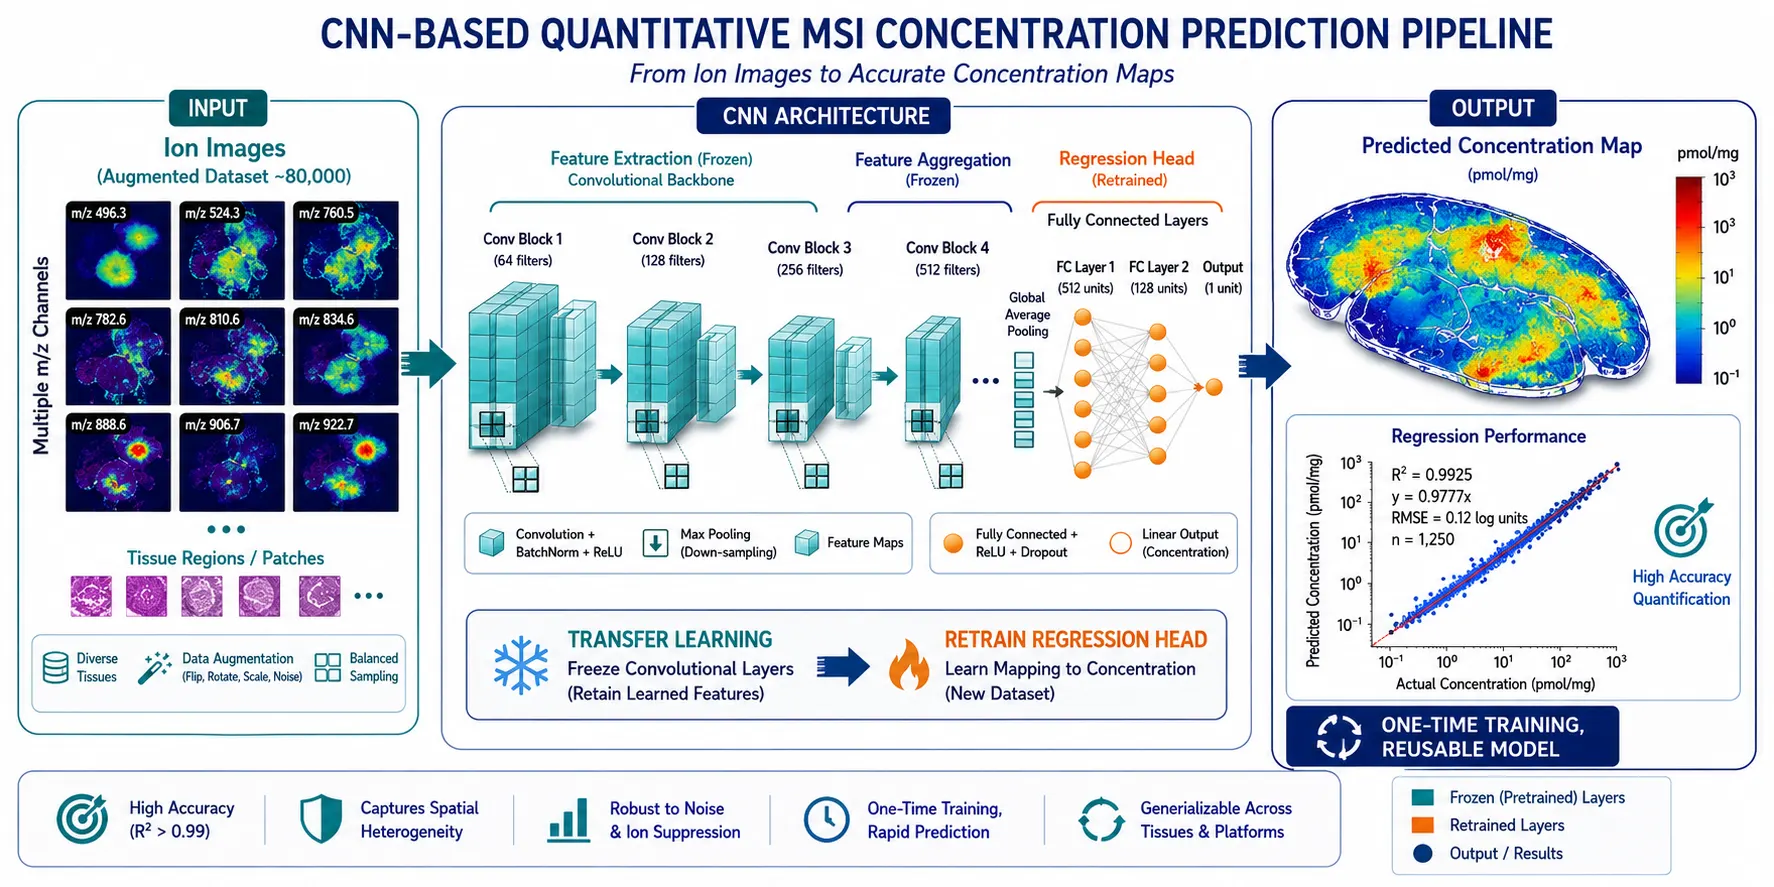 Figure 5: CNN-Based QMSI Prediction Pipeline. Architecture diagram of the Kibbe, Hector & Muddiman (2026) CNN + transfer learning pipeline for glutathione quantification: a base CNN pre-trained on ~80,000 augmented ion images from METASPACE (liver tissue) learns general MSI features; transfer learning freezes convolutional layers and retrains only the regression head on a small set of SIL-GSH calibration images; the output is a per-pixel concentration map with nRMSE of 0.0269 (R² = 0.9925). Arrows indicate data flow from raw ion images through pre-trained feature extraction to calibrated concentration output.
Practical Best Practices for QMSI Studies
System Suitability Testing: The SLICE-MSI Platform
The SLICE-MSI platform (Supervised Learning for Instrument Classification and Evaluation for MSI), developed by the Muddiman laboratory and published in 2025 as a two-part methodology, provides the first standardized quality control framework for MSI platforms. For laboratories requiring custom data processing beyond SLICE-MSI's built-in tools, Bioinformatics for Metabolomics services offer tailored pipeline development and multi-omic integration support. Part A describes a commercially available QC analyte panel (three unlabeled + three SIL analyte pairs) and sampling protocol that can be executed before, during, or after an imaging experiment to assess instrument performance. Part B provides a Python-based machine learning interface that classifies instrument condition as "suitable" or "compromised" based on QC panel data, lowering the barrier to routine system suitability testing.
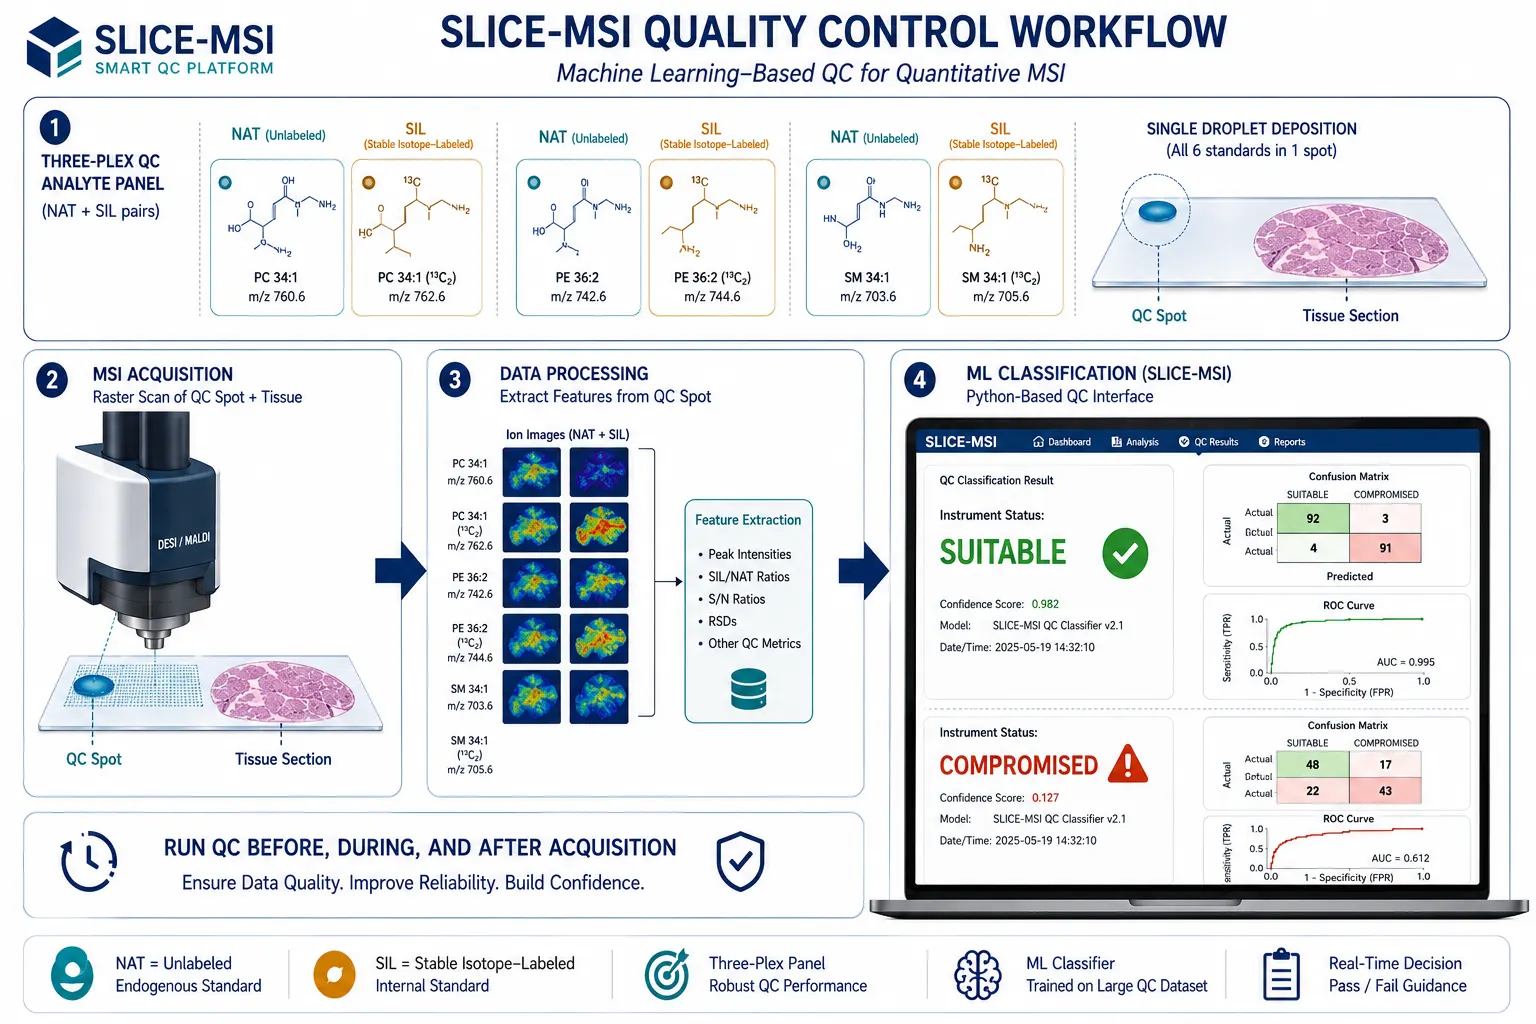 Figure 6: SLICE-MSI QC Workflow for Quantitative MSI. Schematic of the Muddiman laboratory SLICE-MSI quality control platform: a commercially available QC analyte panel (three unlabeled + three SIL analyte pairs) is sampled before, during, or after imaging; Part A defines the sampling protocol and acceptance criteria; Part B applies a Python-based ML classifier that categorizes instrument condition as "suitable" or "compromised," providing a standardized pass/fail gate for QMSI system suitability testing.
Common Pitfalls in QMSI
The most frequent error in QMSI is conflating ion intensity with concentration — a particularly dangerous assumption in heterogeneous tissues where ion suppression varies spatially. A second common pitfall is inadequate calibration range: the calibration curve must bracket the full concentration range present in the tissue, and extrapolation beyond the calibrated range produces unreliable results. A third pitfall is normalizing to TIC without verifying that TIC itself is not confounded by the experimental variable (e.g., TIC may differ systematically between tumor and normal tissue due to global metabolic reprogramming). A fourth is neglecting to report the limit of quantification (LOQ) on a per-pixel basis — the LOQ in MSI is pixel-size-dependent (a larger pixel integrates more ions and has a lower LOQ), and the pixel dimensions used for quantification must be explicitly stated. A fifth pitfall is failing to account for endogenous background: if the "blank" tissue used for calibration contains trace levels of the target analyte, the calibration intercept will be biased.
Applications Requiring Quantification
Drug tissue concentration mapping is the most commercially mature QMSI application. Pharmaceutical development programs routinely use quantitative MALDI or DESI imaging to measure drug concentrations in target tissues, often complementing LC-MS/MS untargeted metabolomics data from tissue extracts (tumor, brain, liver, kidney), establish tissue-to-plasma concentration ratios, and verify that therapeutic exposures are achieved at the site of action — all without radiolabeling. Clinical biomarker studies increasingly require quantitative MSI to establish diagnostic thresholds: if a lipid marker at a surgical margin exceeds X pmol/mg, the margin is classified as tumor-positive.
Cross-study comparability — reproducing a quantitative MSI result in a different laboratory on a different instrument — remains the field's most stringent test and its most important unmet need. Rigorous Statistical Analysis Services are essential for establishing inter-laboratory reproducibility metrics. Without standardized calibration, a concentration of 50 pmol/mg reported by one lab may correspond to 30 or 80 pmol/mg when measured by another. Standardized calibration protocols, shared reference materials (such as the commercially available MSI QC Kit from Cambridge Isotope Laboratories), and CNN-based transferable calibration models are converging to make cross-study QMSI reproducibility an achievable near-term goal.
All quantitative MSI metabolomics services described in this article are provided for Research Use Only (RUO). These workflows are not intended for diagnostic, therapeutic, or clinical decision-making purposes.
FAQ
Q: Can MSI provide truly absolute quantification like LC-MS/MS?
A: With careful calibration using mimetic tissue models or voxel-by-voxel internal standard normalization, QMSI can approach LC-MS/MS accuracy for selected analytes. However, the per-pixel precision is inherently lower due to the smaller sample volume per pixel, and the calibration burden is substantially higher.
Q: Which calibration strategy should I use for a first QMSI experiment?
A: Start with off-tissue spotting if your accuracy requirements are modest (2-3 fold). If your application demands better accuracy, invest in on-tissue serial dilution. Reserve mimetic tissue models for regulatory or publication-quality absolute quantification where ±15% accuracy is required.
Q: How many calibration points do I need?
A: For a linear calibration, a minimum of 5-6 concentration levels spanning the expected tissue range is recommended. Nonlinear responses (common at low concentrations due to adsorption losses or at high concentrations due to detector saturation) require additional points.
Q: Does the CNN-based approach work for any analyte?
A: Currently demonstrated for glutathione and chlordecone — both small molecules with well-characterized MSI behavior. Generalization to lipids and larger metabolites requires further validation, but the transfer learning framework is designed to be analyte-agnostic and should extend to any analyte with a stable SIL internal standard.
Q: What is the typical limit of detection for QMSI compared to LC-MS/MS?
A: QMSI limits of detection are generally 10- to 100-fold higher (worse) than optimized LC-MS/MS methods for the same analyte, because each pixel samples only picoliter-to-nanoliter volumes of tissue rather than the microliter injection volumes typical of LC-MS. This is offset by QMSI's ability to preserve spatial context — a trade-off between sensitivity and spatial information.
Q: Can I quantify without a SIL internal standard?
A: Relative quantification (comparing the same analyte across regions within one experiment) is possible without SIL standards. Absolute quantification without SIL standards is unreliable because there is no way to correct for pixel-to-pixel variation in ionization efficiency. The TEC method provides partial correction but is less accurate than SIL-based approaches.
References:
- Korber A, Anthony IGM, Heeren RMA. Mass Spectrometry Imaging. Anal Chem. 2025;97(29):15517-15549. doi:10.1021/acs.analchem.4c05249
- Kibbe RR, Hector EC, Muddiman DC. A Convolutional Neural Network and Transfer Learning Approach for Accelerated Quantitative Mass Spectrometry Imaging. J Mass Spectrom. 2026;61(6):e70067. doi:10.1002/jms.70067
- Bruce ER, Kibbe RR, Opperman LJ, Muddiman DC. Demonstrating Voxel-by-Voxel (V x V) Single-Point Calibration in Liver Tissue by IR-MALDESI Quantitative MSI. Anal Bioanal Chem. 2025;417:6463-6473. doi:10.1007/s00216-025-06138-x
- Mills Q, Kibbe RR, Sohn AL, Percy AJ, Backiel K, Muddiman DC. Part A: Implementing an Analyte Panel and Sampling Protocol for Quality Control in Mass Spectrometry Imaging. Rapid Commun Mass Spectrom. 2025;39(8):e9993. doi:10.1002/rcm.9993
- Kibbe RR, Mills Q, Sohn AL, Muddiman DC. Part B: SLICE-MSI — A Machine Learning Interface for System Suitability Testing of Mass Spectrometry Imaging Platforms. Rapid Commun Mass Spectrom. 2025;39(8):e9990. doi:10.1002/rcm.9990
- Taylor AJ, Dexter A, Bunch J. Exploring Ion Suppression in Mass Spectrometry Imaging of a Heterogeneous Tissue. Anal Chem. 2018;90(9):5637-5645. doi:10.1021/acs.analchem.7b05005
- Golpelichi F, Parastar H. Quantitative Mass Spectrometry Imaging Using Multivariate Curve Resolution and Deep Learning: A Case Study. J Am Soc Mass Spectrom. 2023;34(2):236-244. doi:10.1021/jasms.2c00268
- Anandakumar H, Gao Y, Ye DH. Integrating Model-Based Reconstruction and Deep Learning for Accelerating Mass Spectrometry Imaging. Anal Chem. 2025;97(33):19748-19756. doi:10.1021/acs.analchem.5c04075














