Plasma Protein Binding MS — Accurate fu Determination by RED & LC-MS/MS
Reliable fraction unbound data for PK-PD modeling, DDI risk assessment, and clinical dose projection.
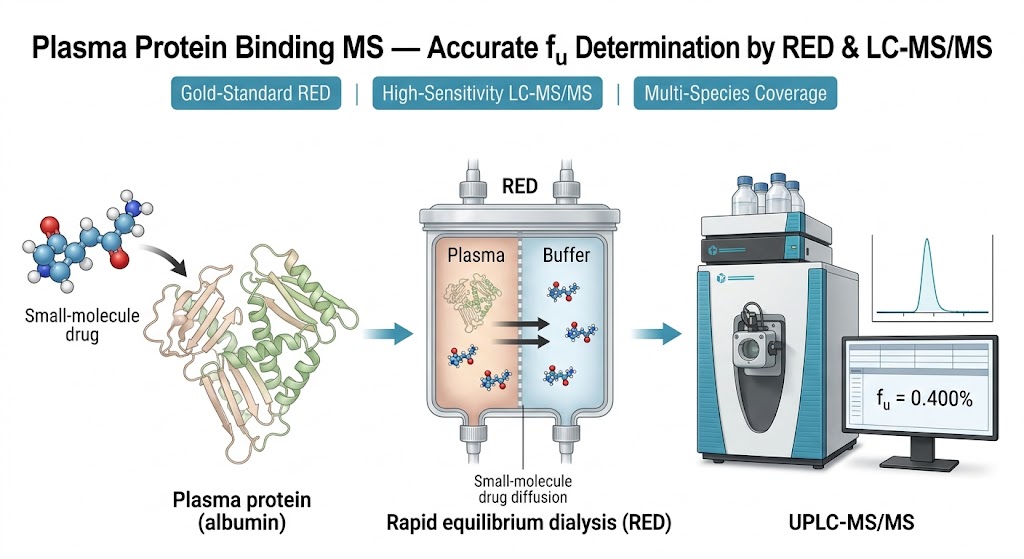
Plasma protein binding (PPB) describes the reversible association between a drug and plasma proteins like albumin and α₁-acid glycoprotein (AAG). Only the free (unbound) fraction can cross membranes, bind its target, and get cleared. That makes accurate fraction unbound (fu) data essential for PK-PD modeling, DDI risk assessment, and clinical dose projections.
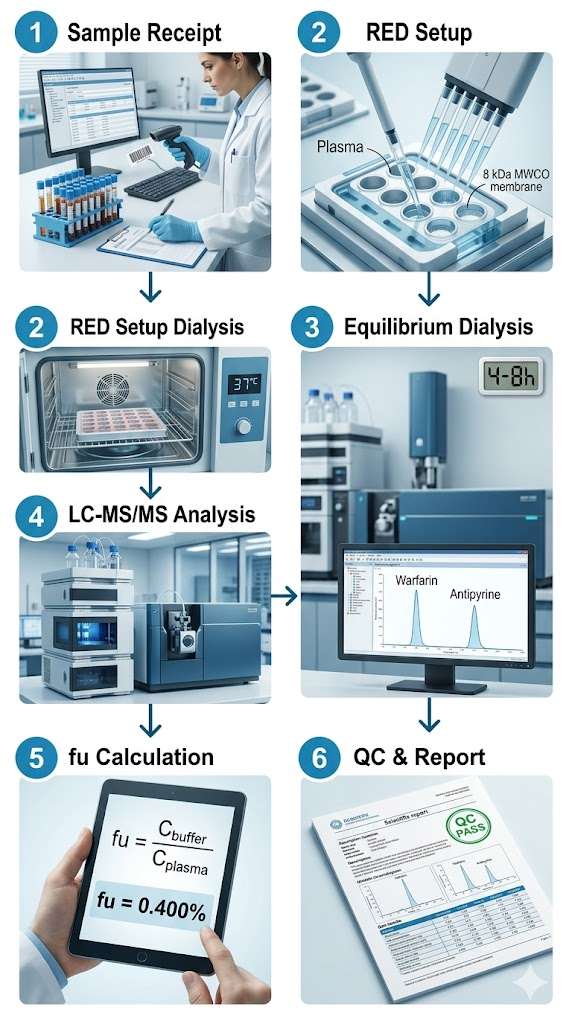
Our plasma protein binding MS service uses gold-standard rapid equilibrium dialysis (RED) paired with high-sensitivity LC-MS/MS to deliver fu measurements you can trust across multiple species — including for compounds where fu drops below 0.5%. It's part of our broader ADME/DMPK/PK-PD Research Platforms, designed to support your pipeline from early screening through IND-enabling work.
Key Advantages:
- Gold-standard RED methodology with optimized incubation per compound class.
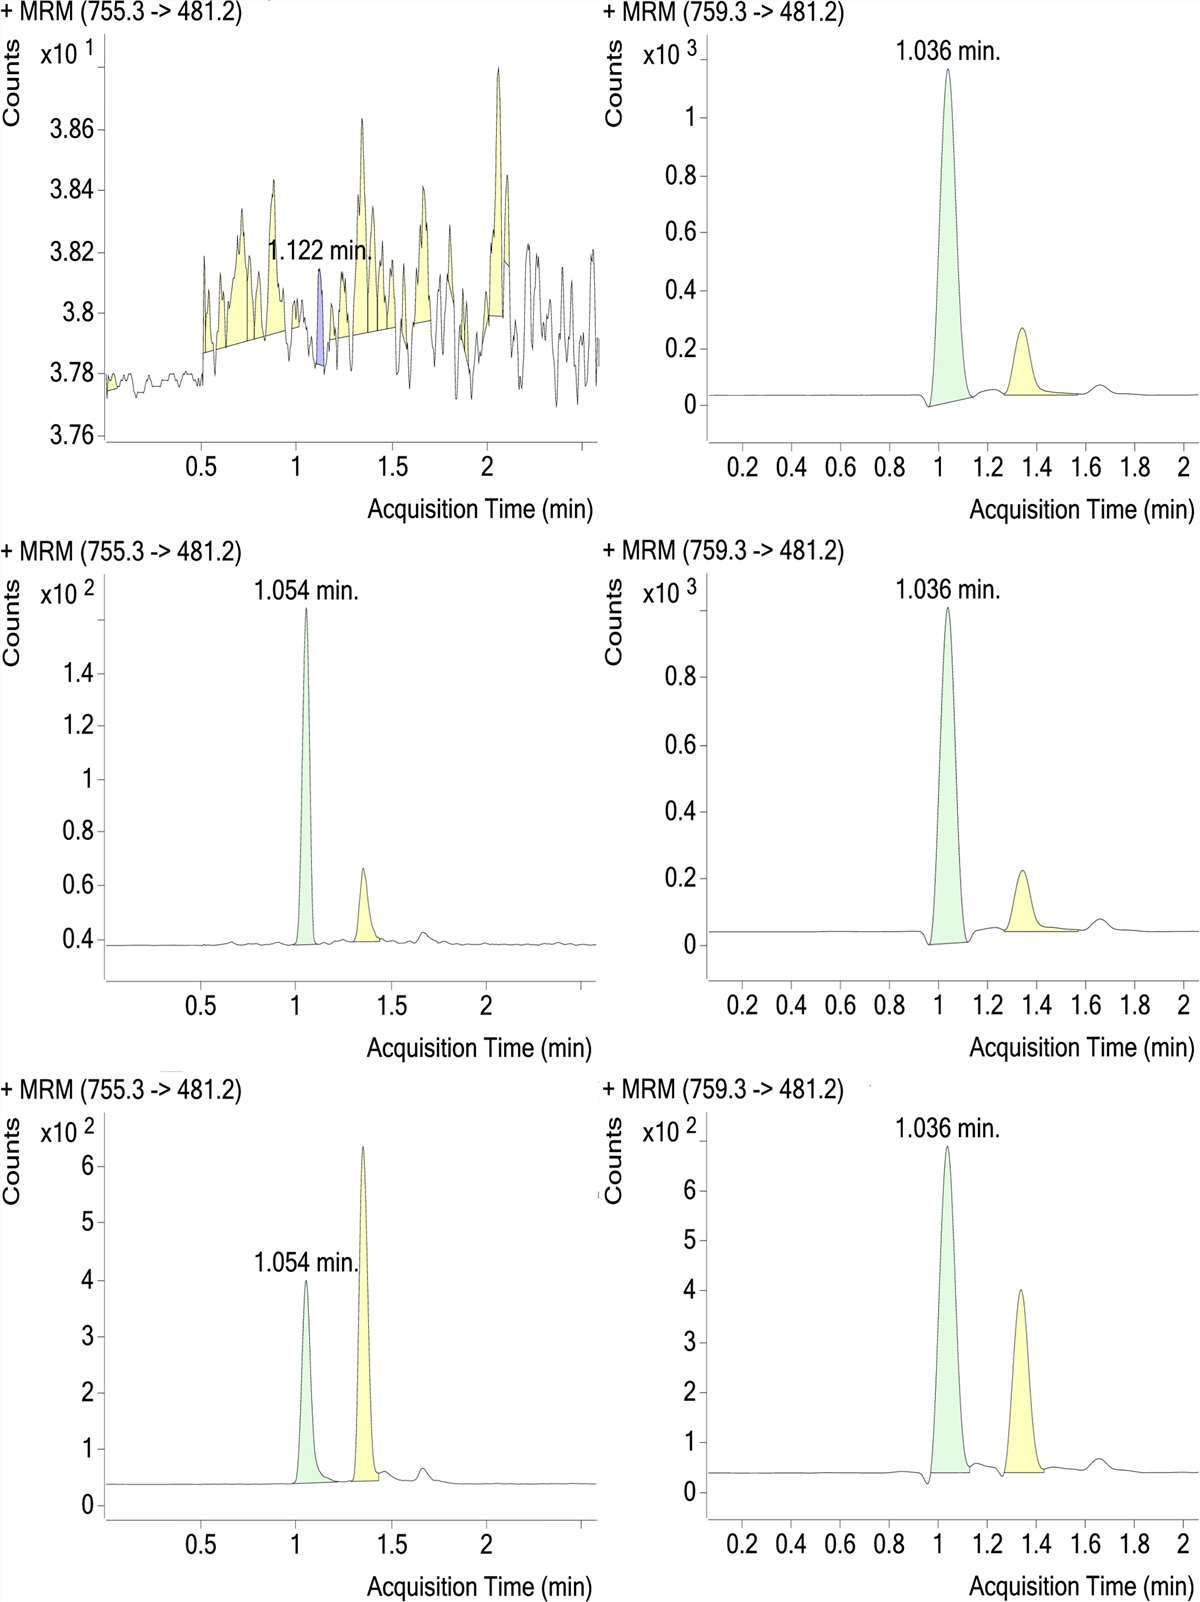
- High-sensitivity UPLC-MS/MS (Waters TQD, Agilent 6495) for fu < 0.5%.
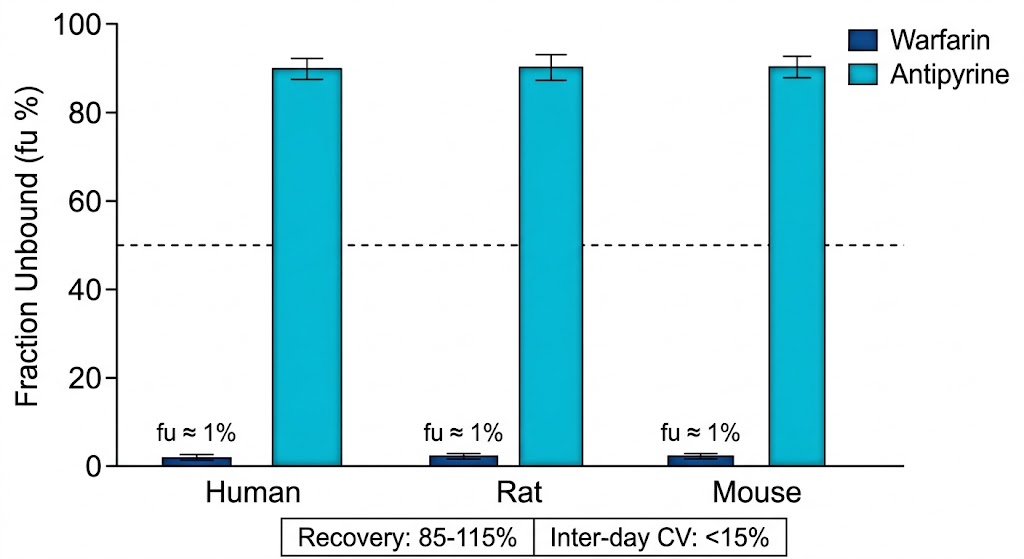
- Multi-species coverage: mouse, rat, dog, monkey, human.
- Systematic NSB assessment and correction.
- Flexible method selection — RED, ultrafiltration, or ultracentrifugation.
- Integrated ADME platform — combine with metabolic stability, CYP, and PK bioanalysis.