miniTurbo Protein Interaction Mapping Service for Drug Discovery

Some interactions don't wait around. Capture them in minutes, not hours.

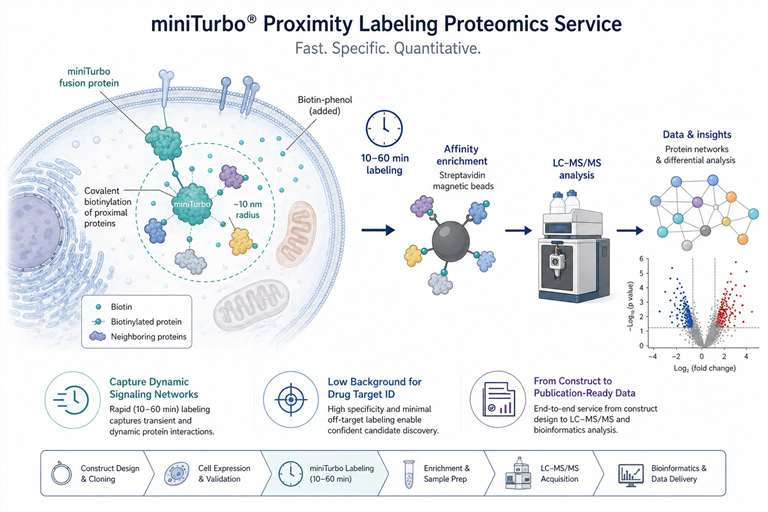
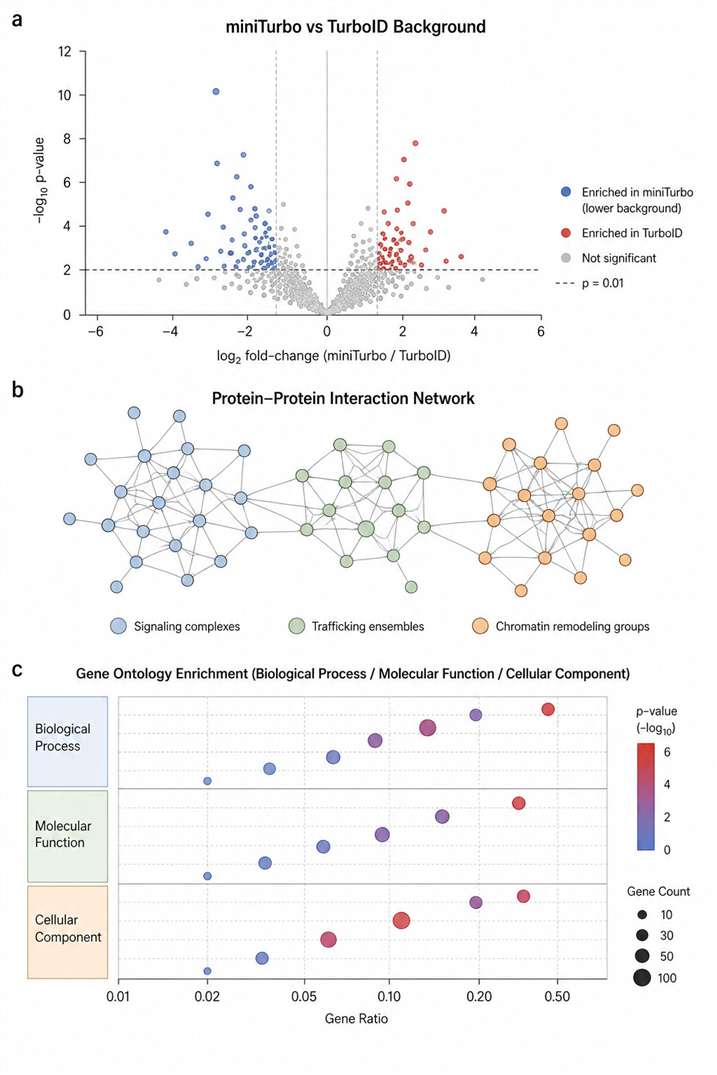
Our miniTurbo proximity labeling proteomics service delivers fast, low-background interactome maps for dynamic signaling networks and PROTAC targets.

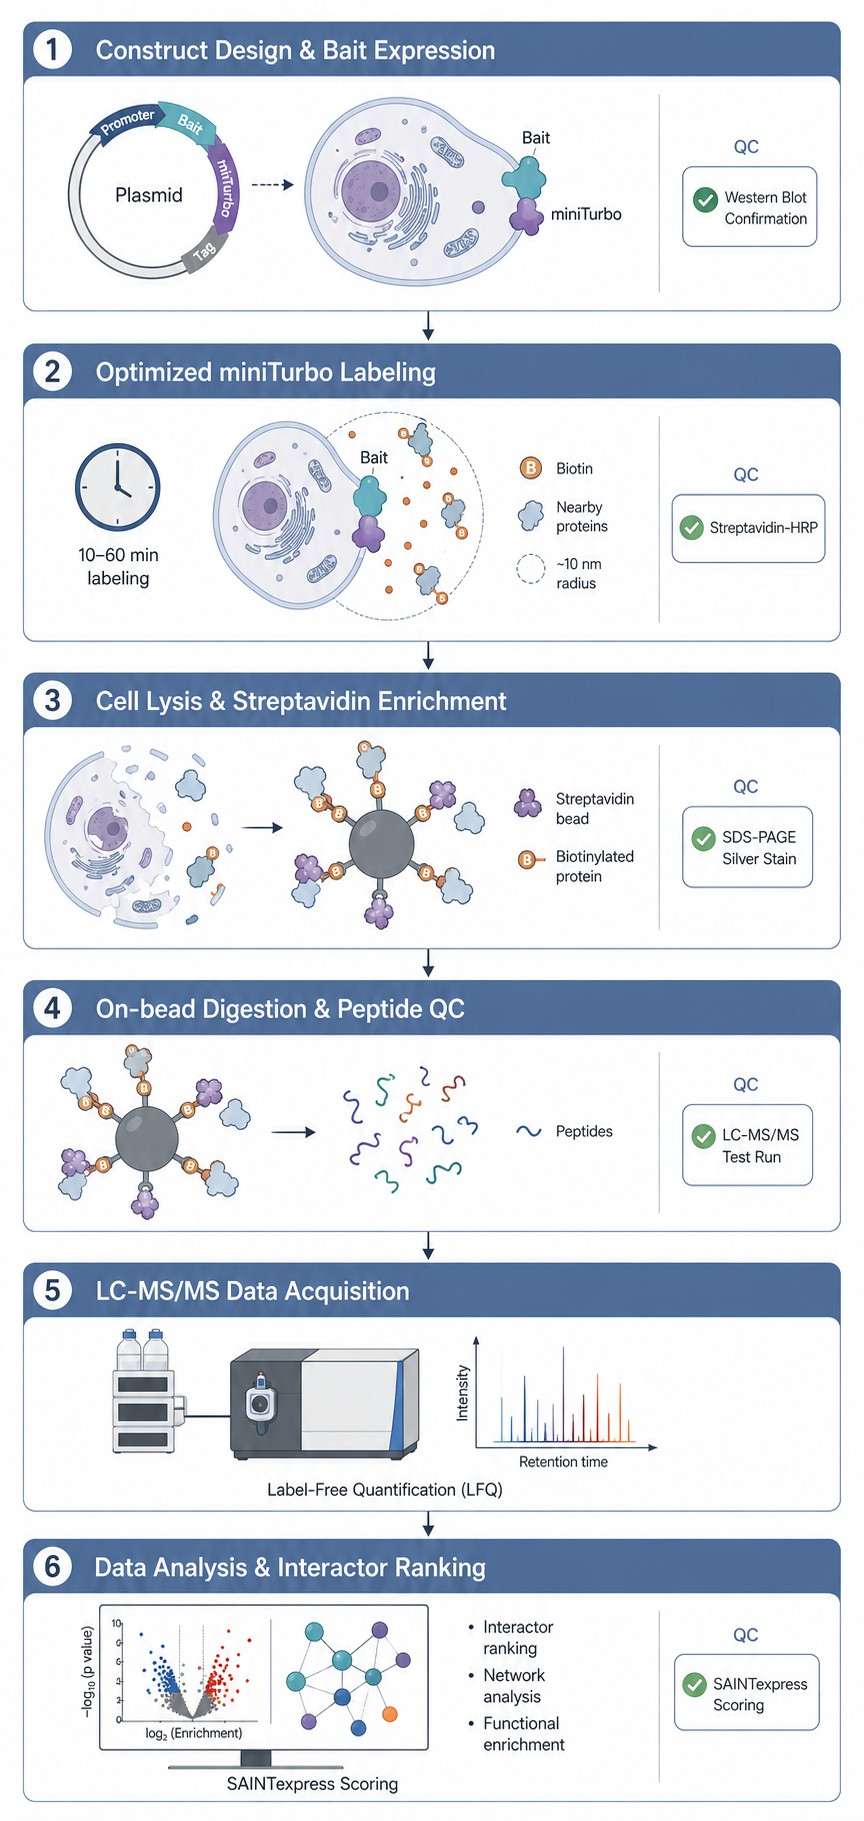
From construct design to publication-ready data, we help you map the interactions that matter—with clear QC at every step.

Some interactions don't wait around. A kinase touches its substrate for seconds. A PROTAC brings two proteins together just long enough to tag one for degradation. If your labeling window is 18 hours, you miss it.

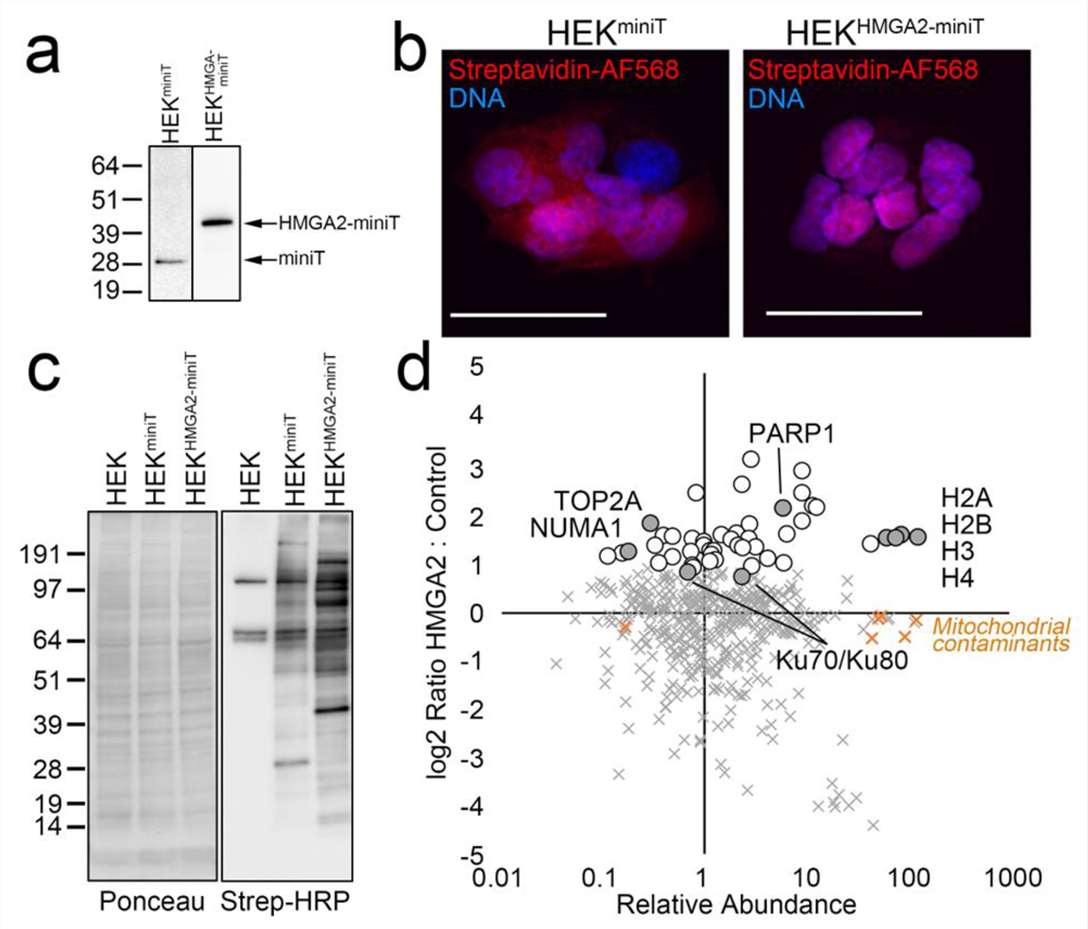
That's where miniTurbo changes the equation. It's the fastest, lowest-background proximity labeling enzyme we work with, and we've built a full service around it. From your construct to a publication-ready interaction network, the result isn't just a list of proteins. It's a snapshot of what was actually happening in your cells during that narrow, biologically relevant window—the one your drug was designed to perturb.

Key Advantages:

  • 10–60 min labeling captures dynamic interactors
  • Low background, high-confidence hits
  • Optimized for low-input, complex samples
  • End-to-end service, raw data delivered
miniTurbo rapid labeling protein interaction service for drug discovery
What Is miniTurbo Service Advantage Workflow & QC Demo Results Sample Requirements Bioinformatics Strategy Comparison FAQ Case Study

What Is miniTurbo and Why It Accelerates Drug Discovery

miniTurbo is a smaller, optimized version of TurboID. It tags neighboring proteins with biotin in as little as 10 minutes—fast enough to catch signaling events that slower enzymes miss. And because its background labeling is lower than TurboID's, you get a cleaner candidate list with fewer false positives to chase down.

Fuse it to your protein of interest, express it in your model, add biotin. The enzyme covalently tags everything within about 10 nanometers. We pull down those tagged proteins on streptavidin beads and identify them by mass spectrometry. Simple principle. Powerful output.

Why this matters for your work. Profiling a kinase's dynamic substrates after acute growth factor stimulation? miniTurbo captures them. Hunting transient ternary complexes that a PROTAC or molecular glue recruits? It catches those too. Mapping organelle contact sites that remodel in minutes? This is your enzyme.

Our miniTurbo Service Advantage: Speed, Sensitivity, and Low Background

We didn't just add miniTurbo to a menu. We optimized the protocol around it—biotin concentration, pulse time, quenching conditions. You get the full pipeline, not a generic workflow with a different enzyme name.

  • A protocol tuned for miniTurbo, not borrowed from TurboID. We've tested labeling windows from 10 to 60 minutes across multiple cell lines. You don't guess the right biotin pulse—we've done that work. The concentration, the timing, the quench: it's dialed in.
  • Lower background you can verify. miniTurbo's background is lower than TurboID's by design, but it still needs the right controls. Every project includes a matched negative control—BirA*-dead enzyme, empty vector, or non-targeting bait. We show you the enrichment difference before committing samples to deep MS runs. If the signal-to-noise isn't there, we troubleshoot before you spend more.
  • QC before the expensive step. We confirm bait expression by western blot. Biotinylation by streptavidin-HRP. Enrichment quality by SDS-PAGE. Then, and only then, we proceed to mass spec. You see these QC results—they're part of your final data package.
  • Your data doesn't end at delivery. When you receive your interactor list, we walk you through it. Which hits have the highest confidence scores? Which ones map to pathways relevant to your question? We don't drop a spreadsheet in your inbox and disappear. The same scientist who ran your project helps you plan the next validation experiment—whether that's co-IP, PLA, or a functional assay.
  • One scientist, end to end. From experimental design to final interpretation, you talk to the same PhD-level scientist. No triage desk. No handoffs.

miniTurbo Experimental Workflow & QC Checkpoints

Here's how your project moves through our lab, and where we stop to verify quality.

1

Construct design and bait expression

If you don't already have a miniTurbo fusion construct, we design and clone it. Once expressed in your cell model, we confirm by western blot. Signal weak? We troubleshoot before labeling begins.

2

Optimized miniTurbo labeling

We add biotin at an optimized concentration and pulse for the window that fits your biology—typically 10 to 60 minutes. The short pulse captures the dynamic state you care about. We quench the reaction to stop labeling exactly when you need it stopped.

3

Cell lysis and streptavidin enrichment

Cells are lysed under conditions suited to your bait. Biotinylated proteins are captured on streptavidin beads and washed stringently. An aliquot on SDS-PAGE with streptavidin-HRP tells us whether the enrichment pattern clearly differs from the negative control. It needs to, or we don't proceed.

4

On-bead digestion and peptide QC

Proteins are reduced, alkylated, and digested directly on the beads. A quick LC-MS/MS check confirms sample complexity and chromatographic quality. Anything off? We fix it here, before the deeper run.

5

LC-MS/MS data acquisition

Peptides are separated on a nano-flow UPLC system coupled to a high-resolution mass spectrometer in data-dependent acquisition mode. Label-free quantification compares enrichment across your conditions.

6

Data analysis and interactor ranking

Raw files are searched against the appropriate database. Significantly enriched proteins are called by comparing bait to the negative control using SAINTexpress or equivalent scoring. You receive a ranked list of high-confidence proximity interactors.

miniTurbo proximity labeling workflow diagram

Representative miniTurbo Proteomics Results

Here's what you'll receive. This example compares a miniTurbo bait to a negative control, but the formats stay the same regardless of your experimental design.

miniTurbo proteomics demo results volcano plot network and enrichment

Differential enrichment volcano plot, interaction network, and GO enrichment

1. Differential enrichment volcano plot. Each protein is a point—log₂ fold-change on the x-axis, −log₁₀ p-value on the y-axis. Pass your thresholds, and the point lights up in color. Proteins in the upper right or upper left corners are your strongest candidates. The plot lets you see, in seconds, whether your experiment worked and which hits are worth picking up for validation.

2. Protein–protein interaction network. High-confidence interactors become nodes, connected by edges showing known or predicted associations. Clusters often resolve into clear functional modules—a signaling complex, a trafficking ensemble, a chromatin remodeling group. That modular structure helps you prioritize: a hit embedded in a cluster of functionally related proteins is more compelling than an isolated node.

3. GO enrichment and pathway analysis. Biological process, molecular function, cellular component—displayed as bar or bubble charts. It answers the obvious question: "What processes are over-represented among my hits?" If your bait is uncharacterized, this gives you a compass for functional follow-up. If your bait is well-studied, it confirms you're pulling down the right biology.

Sample Submission Requirements

Most miniTurbo projects start with a cell model you've already built. Here's what we need for the common cases.

Sample TypeRecommended InputContainerShipping ConditionsQC CheckpointsNotes
Adherent or suspension cells (live)≥1×10⁷ cellsT-25 flask or cell pellet, snap-frozenDry ice (−80°C)Viability ≥90%; Mycoplasma‑freeInclude empty vector or parental control
Pulse-labeled cells (adherent)≥5×10⁶ cellsSnap-frozen pellet, +Biotin/+DMSO controlDry ice (−80°C)Streptavidin‑HRP QC advisedInclude biotin‑free control sample
Transfected cells (transient)≥1×10⁷ cellsSnap-frozen pelletDry ice (−80°C)Confirm expression by western blotProvide plasmid map and sequence
Cell lysate≥500 µg total protein1.5 mL tube, snap-frozenDry ice (−80°C)Pre‑test biotinylation by streptavidin‑HRPProvide lysis buffer composition
Tissue (mouse, rat)20–50 mg wet weightSnap-frozen, wrapped in foilDry ice (−80°C)Perfusion recommendedContact us before large submissions

Got primary cells, organoids, or low-input samples? Send us a note. We'll confirm the prep in a quick feasibility check.

Bioinformatics Analysis & Data Deliverables

Every project includes core deliverables. Add-ons are there when you need them.

Included with every project:

  • Raw MS files (.raw and .mzML formats), downloadable from your secure portal
  • Protein identification and label-free quantification matrix (.csv or .xlsx)
  • List of significantly enriched proteins, with fold-change, p-value, and confidence score
  • QC summary: biotinylation blot, enrichment gel, chromatographic quality metrics

Available as add-ons:

  • Cytoscape-ready interaction network files and publication-quality figures
  • GO, KEGG, and Reactome pathway enrichment with downloadable result tables
  • Custom volcano plots, heatmaps, and Venn diagrams
  • Extended statistical analysis, including SAINTexpress scoring and permutation-based FDR
  • A written methods section ready to drop into your manuscript

All files delivered through a secure portal. Raw data archived for at least 12 months after project close. If you plan to validate interactors structurally, our cross-linking MS service can provide complementary distance constraints on the complexes you've identified.

Choosing the Right Proximity Labeling Enzyme for Your Project

Not every enzyme fits every experiment. Here's the comparison—and our take on choosing.

FeatureBioIDBioID2TurboIDminiTurboAPEX
Labeling time18–24 hours6–24 hours10–60 minutes10–60 minutes≤1 minute
Molecular weight~35 kDa~27 kDa~35 kDa~28 kDa~28 kDa (monomer)
Background levelLowLowModerateLowLow
Biotin requirementRequired (µM)Required (µM)Required (µM)Required (µM)Not required (biotin‑phenol probe)
Key advantageProven in many modelsCompact; good in vivoFast labelingFast + low backgroundSub‑organelle EM
Best forGeneral proximity mappingIn vivo, low toxicityCell lines, acute stimuliDynamic signaling, PROTAC targets, low-background needsSub‑minute events, synaptic labeling

Our honest take on choosing:

  • Dynamic signaling? PROTAC-dependent interactions? Low background non-negotiable? miniTurbo. You get the speed without the noise. Most kinase signaling and targeted protein degradation groups we work with end up here.
  • In vivo with toxicity concerns? Explore our BioID2 service for long‑term in vivo models. Smaller enzyme, lower biotin demand, gentler on the mouse.
  • Sub-minute resolution? EM compatibility? APEX. Harsh but precise.
  • Still unsure? Describe your model in the inquiry form. We'll help you match the enzyme to your question.

Frequently Asked Questions

Q: How is miniTurbo different from TurboID and BioID?

miniTurbo is a trimmed-down TurboID: smaller, with lower background, but keeps the same rapid 10–60 minute kinetics. BioID and BioID2 need hours. If you want both speed and a clean signal, miniTurbo is the pick.

Q: What negative controls do you recommend?

The gold standard: a BirA*-dead miniTurbo enzyme fused to the same targeting sequence. No dead enzyme? An empty vector or unrelated bait targeted to the same compartment works. We nail down the best control during experimental design—and generate the plasmid if needed.

Q: Can miniTurbo capture interactions from acute drug treatment?

Exactly the scenario it was built for. Treat your cells, add biotin, and the 10–60 minute pulse captures the interactome that exists during that specific pharmacological window.

Q: What biotin labeling time and concentration should I use?

We optimize both during every project—typically testing pulses between 10 and 60 minutes. Biotin concentration is titrated in pilot experiments. You don't figure this out alone.

Q: Can I use miniTurbo with low cell numbers or primary cells?

Yes. Primary neurons, hematopoietic cells, low-input samples—we handle these routinely. For challenging models, a small feasibility pilot confirms the labeling works before we commit to the full project.

Case Study: miniTurbo Maps Nuclear HMGA2 Interactome for Cancer Drug Monitoring

Gaudreau-Lapierre, A., et al. (2023) Int. J. Mol. Sci. 24(4), 4246

Background

High Mobility Group A2 (HMGA2) is a chromatin architectural protein overexpressed in aggressive cancers, driving proliferation, epithelial‑mesenchymal transition, and therapy resistance. But the protein network through which HMGA2 does all this—especially in the nucleus—remained poorly defined. The core problem: HMGA2 has no enzymatic activity and functions through transient interactions that conventional immunoprecipitation can't catch.

Methods

Gaudreau-Lapierre et al. (2023, Int. J. Mol. Sci.) fused miniTurbo to the N-terminus of HMGA2 and expressed it in HeLa cells. After a short biotin pulse, biotinylated proteins were enriched on streptavidin beads and identified by LC‑MS/MS. A BioID2‑HMGA2 fusion was run in parallel for comparison. High-confidence interactors were filtered using SAINTexpress and validated by proximity ligation assay (PLA). The team then examined how the interactome shifted upon treatment with the anti-cancer drug TRAIL.

Results

miniTurbo identified 42 high-confidence nuclear HMGA2 interactors, including known partners like histones H1.2 and H1.4 (see Figure 3 of the original paper). GO enrichment revealed strong representation of chromatin remodeling, DNA repair, and negative regulation of the intrinsic apoptotic pathway. The real insight came with TRAIL treatment: the interactome shifted away from survival partners, giving a mechanistic view of how cancer cells rewire their nuclear networks during drug-induced apoptosis. The short miniTurbo pulse caught this shift with lower background than parallel BioID2 experiments.

Conclusion

This study is a blueprint for what miniTurbo can do when paired with a pharmacologically relevant perturbation. It resolves dynamic nuclear interaction networks that slower or noisier enzymes miss—a complete path from hypothesis-driven bait design to drug-context-specific target deconvolution. For your drug discovery program, the takeaway is practical: if your target's interactome changes in response to a compound, miniTurbo can capture that shift with a clarity that older enzymes cannot match. That means cleaner validation data, fewer dead ends, and a faster path from hit to mechanism. It's the caliber of insight our miniTurbo service is built to deliver, project after project.

miniTurbo HMGA2 interactome comparison and gene ontology enrichment

Figure 3. miniTurbo maps the nuclear HMGA2 interactome and enables drug treatment monitoring. (Adapted from Gaudreau-Lapierre et al., 2023, Int. J. Mol. Sci., CC BY 4.0)

References

  1. Branon, T. C., et al. (2018). Efficient proximity labeling in living cells and organisms with TurboID. Nat Biotechnol, 36, 880–887. Nature
  2. Gaudreau-Lapierre, A., et al. (2023). Nuclear High Mobility Group A2 (HMGA2) Interactome Revealed by Biotin Proximity Labeling. Int. J. Mol. Sci., 24(4), 4246. MDPI
  3. Roux, K. J., Kim, D. I., & Burke, B. (2013). BioID: a screen for protein-protein interactions. Curr Protoc Protein Sci, 74, 19.23.1‑19.23.14. PubMed

Disclaimer: Creative Proteomics services are for research use only. They are not intended for clinical diagnostic or therapeutic purposes.

Online Inquiry

Please submit a detailed description of your project. We will provide you with a customized project plan to meet your research requests. You can also send emails directly to for inquiries.

* Email
Phone
* Service & Products of Interest
Services Required and Project Description