Collision Cross-Section (CCS) Binding Analysis Services

Accelerate your drug discovery with our Collision Cross-Section (CCS) binding analysis. By pairing Native Mass Spectrometry with Ion Mobility, we accurately measure conformational shifts, capture transient ligand-target interactions, and resolve complex isomers—delivering robust structural evidence when traditional methods fall short.

  • Label-free dynamic conformation tracking
  • Suitable for fragile non-covalent complexes
  • Microgram-level sample requirements
Collision Cross-Section (CCS) Binding Analysis Services
What Is CCSService OverviewTechnology ComparisonWorkflowDemo ResultsSample RequirementsCase StudyBioinformaticsFAQ

What Is CCS Binding Analysis? (Decoding Conformational Dynamics)

Understanding how a protein changes shape when a drug binds is crucial for successful drug design. However, many targets are too flexible, transient, or unstable for traditional structural biology tools. Collision Cross-Section (CCS) binding analysis solves this by measuring the physical size and shape of a molecule in the gas phase.

At Creative Proteomics, we utilize advanced Ion Mobility MS (IM-MS / TIMS-MS) platforms to separate protein-ligand complexes based on their three-dimensional volume. As your target travels through a drift tube filled with inert gas (typically nitrogen or helium), it collides with the gas molecules. The number of collisions a protein experiences depends entirely on its rotationally averaged surface area. Larger, more extended conformations undergo more collisions and travel more slowly, whereas compact, folded conformations navigate the gas more quickly.

The transit time, known as the drift time, directly correlates to the folded state of the protein complex. By precisely measuring this drift time, we can calculate the absolute Collision Cross-Section (CCS) value in square angstroms (Ų). This allows us to detect subtle conformational dynamics induced by small molecules or peptides, giving you direct, label-free evidence of target engagement and the underlying mechanism of action.

Service Overview & Capabilities (Our Boundaries & Suitable Projects)

We know that modern drug pipelines often focus on targets that do not behave well in standard biochemical assays. Our CCS binding analysis is specifically designed to handle challenging, highly dynamic projects where you need more than just a simple "yes/no" macroscopic binding signal. We provide a platform-level evidence chain that bridges the critical gap between early hit identification and deep structural understanding, ensuring your compounds are acting through the correct conformational pathways.

Projects We Excel At:

MODE 1

Allosteric Modulator Screening

Unlike orthosteric inhibitors that block an active site directly, allosteric modulators bind elsewhere and alter the protein's overall shape. CCS analysis is uniquely capable of capturing the subtle structural compaction or expansion induced by these allosteric binders, verifying their mechanism of action even when the active site remains unoccupied.

MODE 2

Molecular Glue & PROTAC Characterization

Targeted protein degradation relies on the formation of stable ternary complexes (e.g., Target-PROTAC-Ligase). We validate the formation, stoichiometry, and conformational cooperativity of these ternary complexes, ensuring the "glue" is inducing the necessary structural proximity for ubiquitination.

MODE 3

Intrinsically Disordered Proteins (IDPs)

Many critical oncology and neurobiology targets lack a fixed 3D structure, existing instead as a dynamic ensemble of conformations. Because they cannot be crystallized, traditional methods fail. IM-MS can profile the entire dynamic structural ensemble of an IDP in solution, tracking how specific ligands stabilize distinct folded states.

MODE 4

Isomer and Multimer Resolution

We excel at separating mixtures of co-eluting complexes that share identical mass-to-charge (m/z) ratios but possess different physical shapes. Whether distinguishing between different multimeric assembly states or isolating structural isomers, CCS provides an orthogonal dimension of separation.

If you have already identified initial hits using our Affinity Selection–MS (AS-MS) platform, CCS analysis serves as the perfect orthogonal validation step. It confirms not just that your hits bind, but precisely how those hits alter your target's global architecture.

Technology Comparison: Why Choose IM-MS (CCS) Over Traditional Methods?

Selecting the right analytical tool is critical for keeping your drug discovery project moving efficiently. While conventional methods are undoubtedly powerful, they often struggle with dynamic mixtures, require the protein to be artificially tethered to a surface, or demand massive amounts of highly purified, highly stable protein.

FeatureIM-MS (CCS Binding Analysis)Surface Plasmon Resonance (SPR)Cryo-Electron Microscopy (Cryo-EM)
Measurement FocusDynamic conformational shifts & stoichiometryReal-time on/off kinetic rates (macroscopic)Ultimate high-resolution atomic coordinates
Sample ConsumptionMicrogram scale (highly efficient)Microgram to milligram scaleMilligram scale (requires high concentration)
Conformational ResolutionExcellent for tracking dynamic intermediate statesPoor (provides bulk average binding signal only)Excellent for stable, static structures
Mixture CompatibilityHigh (resolves heterogeneous states simultaneously)Low (bulk average signal; susceptible to false positives)Moderate (can classify distinct stable particles, but complex)
Immobilization RequiredNo (Label-free & native solution phase)Yes (Target must be tethered to a sensor chip)No (Grid freezing required, which can alter dynamics)

Our Solution Selection Strategy:

  • Choose SPR if your primary goal is to determine basic, real-time on/off binding kinetics (Kd, Kon, Koff) for a well-behaved, stable protein that can tolerate sensor chip immobilization without losing activity.
  • Choose Cryo-EM if your project has advanced to the point where you need the absolute highest atomic-level coordinates of a highly stable protein complex to guide rational, atom-by-atom drug design.
  • Choose CCS Binding Analysis if you are operating in the early-to-mid discovery phase and need to rapidly track dynamic conformational shifts, resolve heterogeneous binding mixtures, evaluate allosteric effects, and validate fragile non-covalent interactions using minimal sample volumes without any chemical labeling or surface immobilization.

End-to-End Workflow & QC Checkpoints

We have designed a streamlined workflow that takes your samples from careful preparation to final data delivery. Our focus is on maintaining the delicate non-covalent interactions of your complex throughout the entire process.

1

Project Initiation & Sample Receipt

We log your samples into our tracking system and store them at optimal conditions (typically -80°C) until processing.

2

Gentle Buffer Exchange

Physiological buffers often contain non-volatile salts that suppress MS signals. We carefully exchange your sample into a volatile buffer (like ammonium acetate) optimized for Native ESI-MS for noncovalent complexes, ensuring the protein remains folded.

3

QC Checkpoint 1 (Integrity Check)

A preliminary mass spectrometry scan verifies target purity, intact mass, and confirms that the non-covalent structure survived the buffer exchange.

4

IM-MS Data Acquisition

We introduce the sample via nano-ESI, preserving its native state. The instrument is rigorously calibrated using standard calibrants to ensure precise collision cross-section measurements.

5

QC Checkpoint 2 (Calibration & Stability)

We verify system resolution and CCS calibration accuracy against known reference standards before recording the final sample data.

6

Bioinformatics & Data Delivery

Raw drift times are converted into absolute CCS values (in Ų). We generate a comprehensive report mapping these values to specific conformational states.

Workflow Infographic showing Native ESI buffer exchange leading into an IM-MS drift tube

Demo Results: Visualizing Complex Interactions

We do not just hand you a spreadsheet of raw mass-to-charge ratios and drift times. Our bioinformatics team processes the multidimensional IM-MS data into intuitive, visual formats that directly answer your core structural biology and pharmacology questions.

Arrival Time Distribution (ATD) overlay charts demonstrating target compaction or expansion upon ligand binding

Conformational Shift (ATD Overlay)

You will receive clear Arrival Time Distribution (ATD) overlay charts. These line graphs elegantly demonstrate how your target compacts or expands upon ligand binding. For example, if an allosteric agonist induces a tighter protein fold, the ATD peak will shift to a shorter drift time (smaller CCS). This proves definitively that a structural change has occurred as a direct result of ligand binding.

Data plots visually separating co-eluting complexes and resolving structural isomers

Isomer and State Separation

Our data plots can visually separate co-eluting complexes. If your sample contains multiple conformations with the exact same mass (such as an equilibrium between an open and closed state), the IM-MS drift time plot will resolve them into distinct peaks. This allows us to characterize heterogeneous populations that appear as a single confusing blur in standard MS or SPR.

Bar charts calculating the relative ratio of different conformational states present in equilibrium

Relative Abundance Quantification

Alongside the visual separation, we provide bar charts and integration tables calculating the relative ratio of different conformational states present in equilibrium. By titrating your ligand, we can plot how the abundance of a specific active conformation increases, helping you understand the dominant mechanisms and dose-dependent structural responses at play.

Sample Requirements & Preparation Guidelines

Proper sample preparation is the absolute foundation of high-quality Native MS and CCS data. Because we are analyzing intact, non-covalent complexes, the sample environment must be carefully controlled. Based on our comprehensive proteomics guidelines, please follow these parameters to ensure maximum success:

Sample TypeRecommended Amount / ConcentrationBuffer & Matrix RequirementsShipping Conditions
Purified Protein / Complex>10 µM (Minimum volume: 50 µL)Strictly avoid non-volatile salts (NaCl, PBS, HEPES), detergents (SDS, Triton), and glycerol.Ship overnight on dry ice.
Small Molecule Ligands>1 mM stock solutionSolubilized in DMSO or pure HPLC-grade water.Ship on dry ice or cold packs.

Note: We understand that maintaining your protein in an MS-friendly buffer natively is difficult. If your protein is currently in a standard physiological, non-volatile buffer, simply ship it as-is. Our Native MS team will perform the necessary gentle buffer exchange into MS-compatible ammonium acetate immediately prior to analysis, ensuring structural integrity is preserved.

Case Study: Structural Investigation via CCS Measurement

Zheng, X., et al. "Collision Cross Section (CCS) Measurement and Prediction Methods in Omics." (2023) https://pmc.ncbi.nlm.nih.gov/articles/PMC10530098/

Background

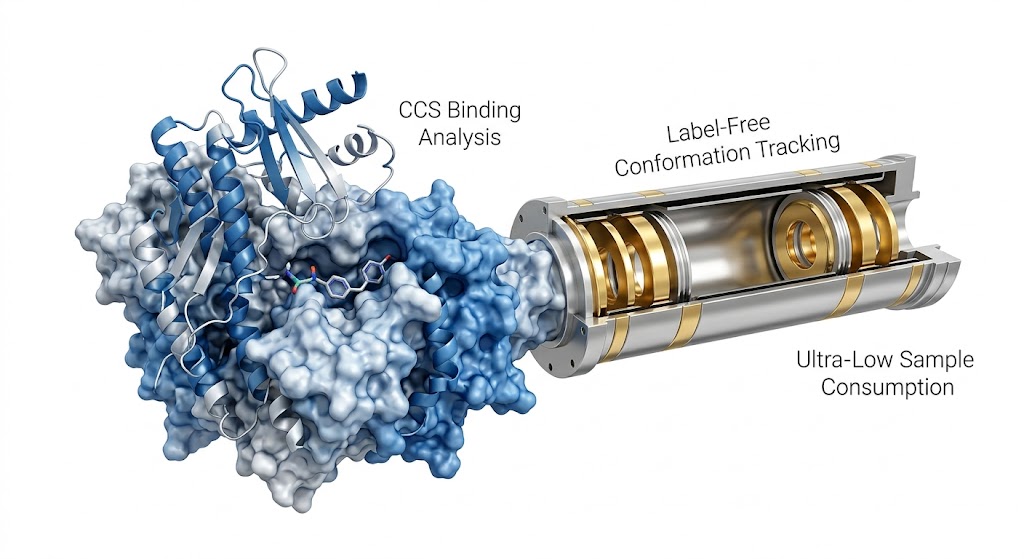
Understanding the extreme structural diversity of biomolecules is often limited by the resolving power of traditional analytical techniques. In modern omics and drug discovery, researchers frequently encounter highly complex isomeric mixtures or large, non-covalent multi-protein assemblies. Because these different structural states often share identical mass-to-charge (m/z) ratios, standard mass spectrometry cannot distinguish between them, leaving critical structural dynamics hidden.

Methods

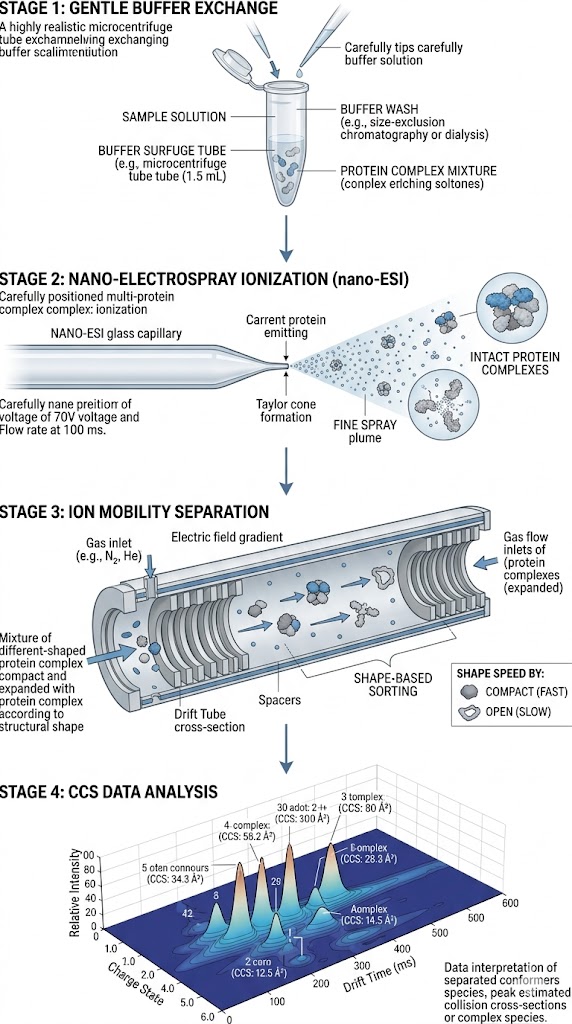
To overcome this fundamental limitation, researchers utilized Ion Mobility-Mass Spectrometry (IM-MS) combined with predictive modeling. This multidimensional approach separates ions not just by their mass, but by their physical size, shape, and charge distribution (their collision cross-section) as they travel through a gas-filled drift region. By doing so, the team could simultaneously acquire mass spectra and ion mobility drift times, allowing for a highly detailed mapping of the conformational landscape.

Results

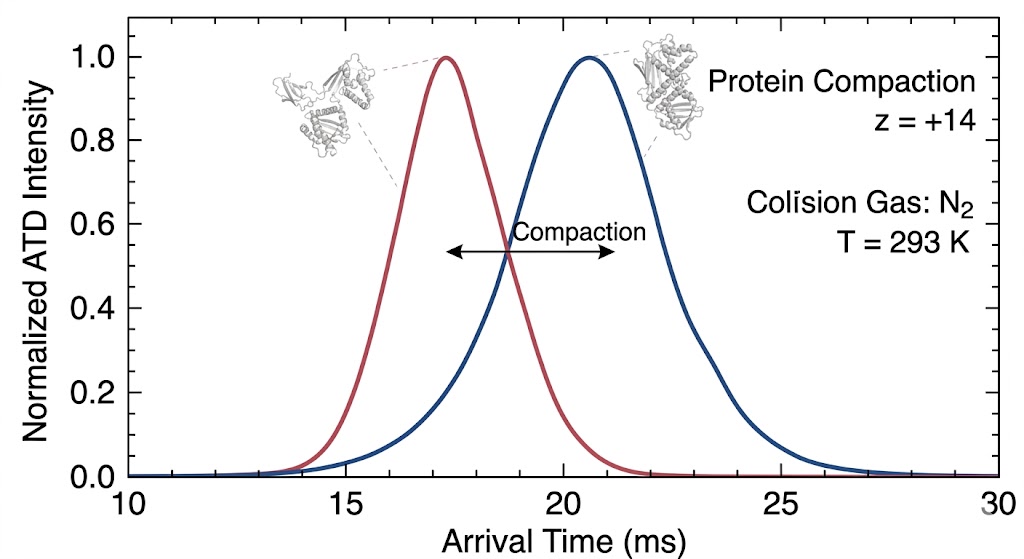
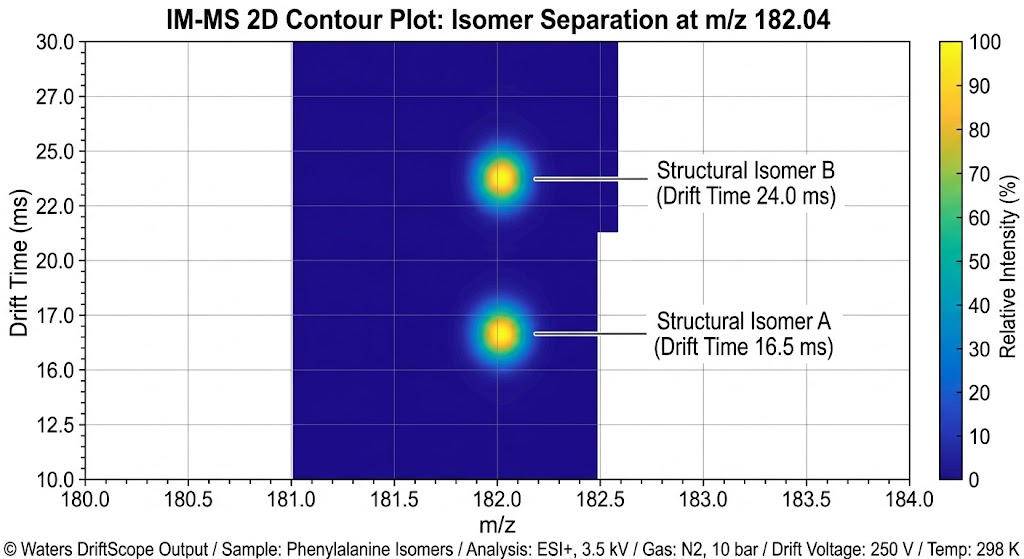
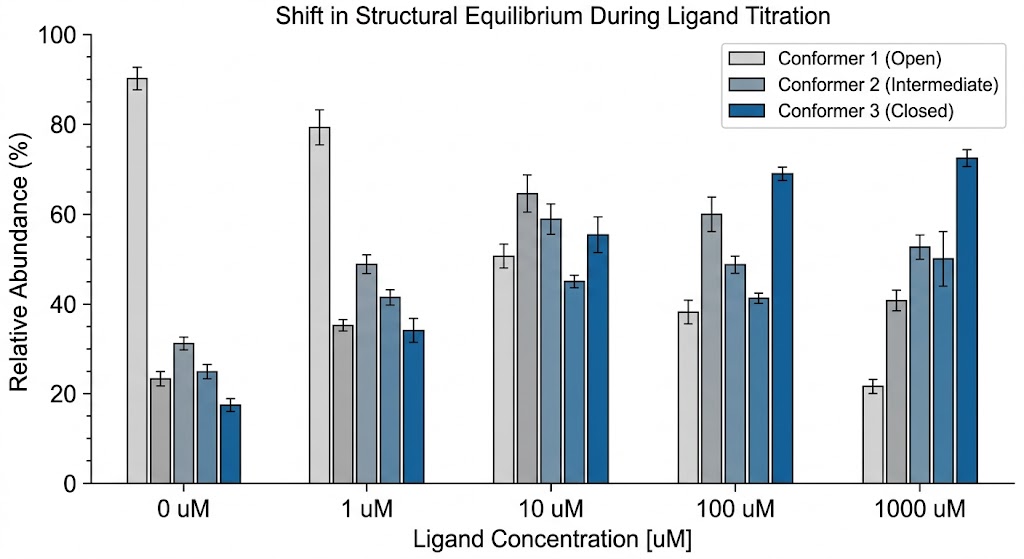
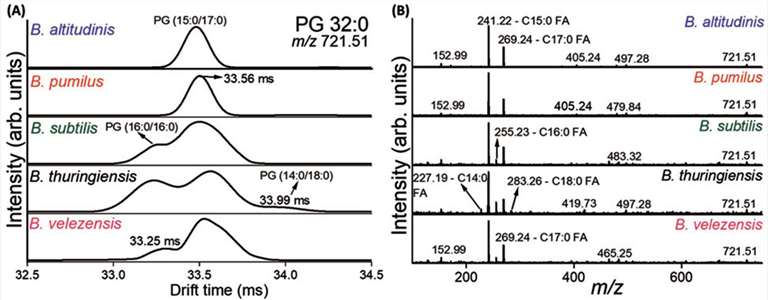
As detailed in Figure 2 of the published study, the IM-MS data clearly illustrates the successful separation of structural conformers that could not be resolved by standard MS alone. The resulting Arrival Time Distribution (ATD) profiles generated distinct, measurable peaks for different folding states. This provided unique, quantifiable CCS signatures for the distinct binding states and molecular architectures present in the complex mixture.

Conclusions

Accurate CCS measurement serves as a highly robust orthogonal descriptor in structural biology. It validates dynamic conformational changes, resolves heterogeneous mixtures, and significantly enhances confidence in molecular target interactions during early-stage discovery, proving invaluable for characterizing targets that evade traditional structural biology tools.

Gas-phase CCS values correlating with structural binding states

Representational chart based on PMC10530098 showing gas-phase separation and unique CCS signatures.

Bioinformatics & Data Deliverables

Our data analysis pipeline is designed to transform complex, multidimensional IM-MS data arrays (incorporating m/z, drift time, and ion intensity) into actionable, easily interpretable biological insights. We ensure that every piece of data is rigorously calibrated and statistically validated.

Minimum Deliverables:

  • Extracted Ion Chromatograms & Mass Spectra: High-resolution intact mass spectra with clear annotations of all detected charge states, apo-proteins, and ligand-bound complexes.
  • Arrival Time Distribution (ATD) Plots: Detailed overlay plots comparing the drift times of bound versus unbound states, visually highlighting conformational shifts.
  • Calibrated CCS Values: Absolute Collision Cross-Section values (measured in Ų) for all detected conformers. We calculate these values using rigorous calibration curves established with standardized reference molecules (e.g., polyalanine or tuning mixes), ensuring high reproducibility and accuracy across different experimental days.
  • Comprehensive Project Report: A detailed document outlining all experimental methods, quality control results, instrument parameters, and clear biological interpretations of the structural data.

Optional Add-ons:

For researchers seeking a complete, high-resolution 3D structural picture, we offer advanced multi-omics integration. We can mathematically and visually integrate your CCS conformational data with orthogonal structural MS techniques, such as HDX-MS or chemical cross-linking. This combined approach allows us to not only detect that a conformational change occurred (via CCS) but to map that shift directly to specific peptide regions and amino acid residues (via HDX), providing a localized structural model of the binding event.

FAQ

Frequently Asked Questions

Q: Can gas-phase CCS accurately reflect solution-phase protein conformations?

Yes. By utilizing extremely gentle Native Electrospray Ionization (ESI) techniques and meticulously optimizing instrumental parameters (such as capillary voltage and source temperature), we effectively "freeze" the non-covalent interactions as the molecule transitions from the solution phase into the gas phase. Extensive literature and internal validations demonstrate strong, reliable correlations between gas-phase CCS values and the physiological, solution-phase architectures of protein complexes.

Q: What is the mass range limit for your IM-MS platform?

Our high-resolution ion mobility platforms are specifically optimized to handle a very wide range of molecular weights. We can successfully analyze everything from small peptide therapeutics up to massive, intact non-covalent protein complexes exceeding several hundred kilodaltons (kDa), including intact antibodies and multi-subunit membrane protein complexes.

Q: Do I need to perform the buffer exchange into ammonium acetate myself?

No. While you are welcome to provide samples already suspended in volatile buffers, we recognize that this can lead to protein precipitation if not handled correctly. Our laboratory routine includes a specialized, highly gentle buffer exchange process (often utilizing micro-SEC columns or specialized ultrafiltration) designed specifically to preserve fragile protein complexes immediately prior to IM-MS injection.

References

  1. Collision Cross Section (CCS) Measurement and Prediction Methods in Omics
  2. Preanalytical Strategies for Native Mass Spectrometry Analysis
  3. Drug discovery from natural products using affinity selection-mass spectrometry

Disclaimer: All services and products provided by Creative Proteomics are for Research Use Only (RUO) and are not intended for use in diagnostic procedures or clinical treatments.

Plan a CCS Binding Analysis campaign with the MassTarget™ team

Share your target details and our scientists will design a tailored IM-MS strategy for your structural biology program.

Online Inquiry

Please submit a detailed description of your project. We will provide you with a customized project plan to meet your research requests. You can also send emails directly to for inquiries.

* Email
Phone
* Service & Products of Interest
Services Required and Project Description