Choosing the right screening method depends on your target, throughput needs, and what kind of data you need. Here's how HTS-MS stacks up against the alternatives.
| Method | Principle | Throughput | Label Required | Native-State | False Positive Rate | Cost per Data Point |
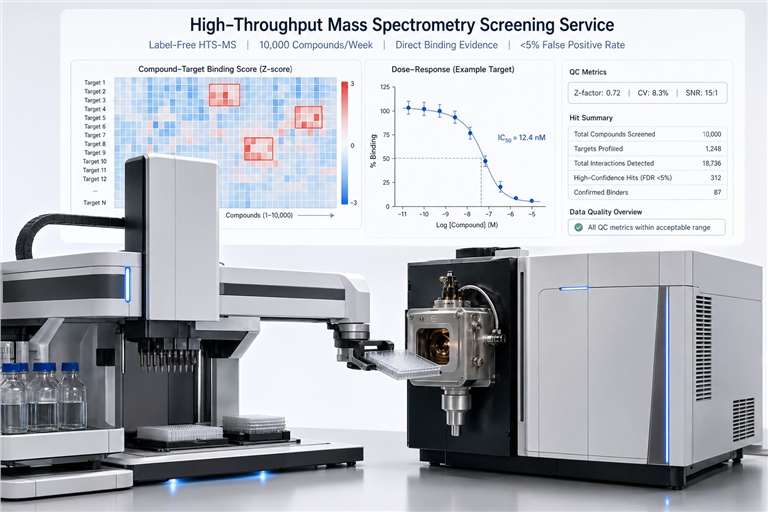
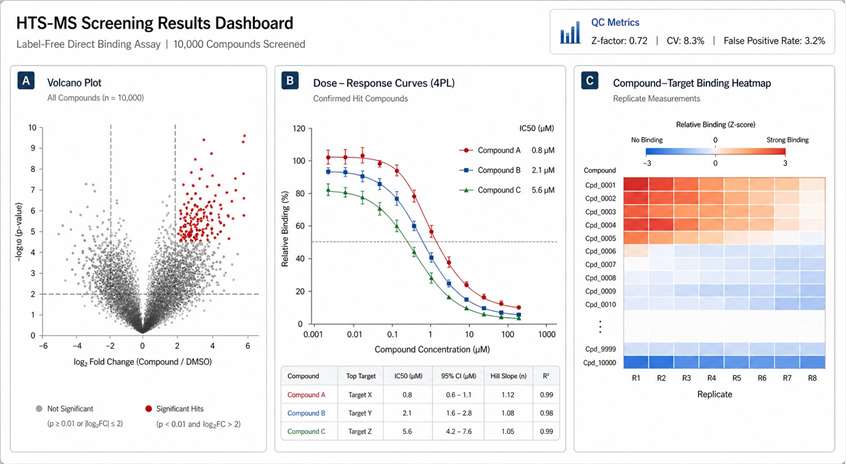
| HTS-MS (this service) | Mass detection of complexes | High (10K/week) | No | Yes | Low (<5%) | $$ |
| Fluorescence HTS | Fluorescent tag/reporter | Very high (100K/week) | Yes | Limited | Moderate (5-15%) | $ |
| SPR/BLI | Surface plasmon resonance | Medium (1K/week) | No | Yes | Low (<5%) | $$$$ |
| ITC | Isothermal titration calorimetry | Low (10/week) | No | Yes | Very low (<1%) | $$$$$ |
| DSF | Thermal stability shift | Medium (5K/week) | Dye only | Limited | Moderate (10-20%) | $$ |
| Cryo-EM | Electron microscopy | Very low | No | Yes | Very low | $$$$$$ |
| NMR | Nuclear magnetic resonance | Very low | No | Yes | Very low | $$$$$$ |
HTS-MS vs Traditional Fluorescence HTS: Advantages include no labeling artifacts, works with difficult targets, provides direct binding evidence. Disadvantages include lower throughput, higher instrumentation cost, requires MS expertise. Best for targets incompatible with labeling, fragment screening, and orthogonal validation.
HTS-MS vs SPR/BLI: Advantages include higher throughput, lower sample consumption, multiplexed detection. Disadvantages include less precise affinity measurement, more complex data analysis. Best for primary screening, large library assessment, and rapid triaging.
HTS-MS vs ITC/DSF: Advantages include much higher throughput, simultaneous multiparameter readout. Disadvantages include less thermodynamic information, indirect binding measurement. Best for screening phase, hit identification, and library prioritization.
HTS-MS vs Cryo-EM/NMR: Advantages include practical throughput for drug discovery, established workflows. Disadvantages include no structural information, indirect binding detection. Best for functional screening, compound library assessment, and drug discovery pipelines.
Method selection guidance: Primary screening of large libraries: fluorescence HTS (if compatible) or HTS-MS (if labeling problematic). Fragment screening: HTS-MS or SPR. Membrane protein targets: HTS-MS or SPR with appropriate stabilization. Orthogonal validation: ITC for thermodynamics, SPR for kinetics, HTS-MS for reproducibility. Structural characterization: Cryo-EM or NMR after hit identification.
For complementary ultra-high-throughput screening, explore our RapidFire MS for ultra-high-throughput screening technology. For advanced instrumentation options, consider Acoustic ejection MS technology for nanoliter dispensing.