Small-Molecule/Protein Complex Native MS Service

Direct, label-free detection of small-molecule binding to protein targets via native mass spectrometry.

Understanding how small molecules interact with their protein targets is the foundation of drug discovery. Whether you are validating hits from a high-throughput screen, confirming fragment binding in an FBDD campaign, or characterizing the mechanism of action of a lead compound, you need direct evidence of binding — not an inference from an indirect assay.

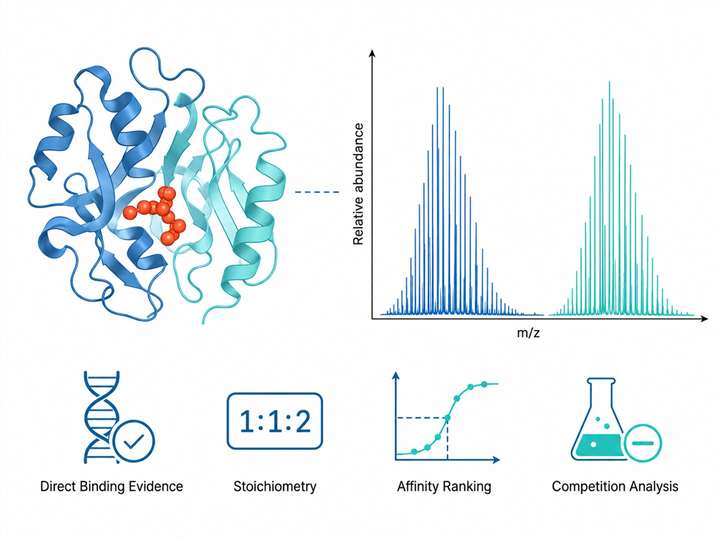
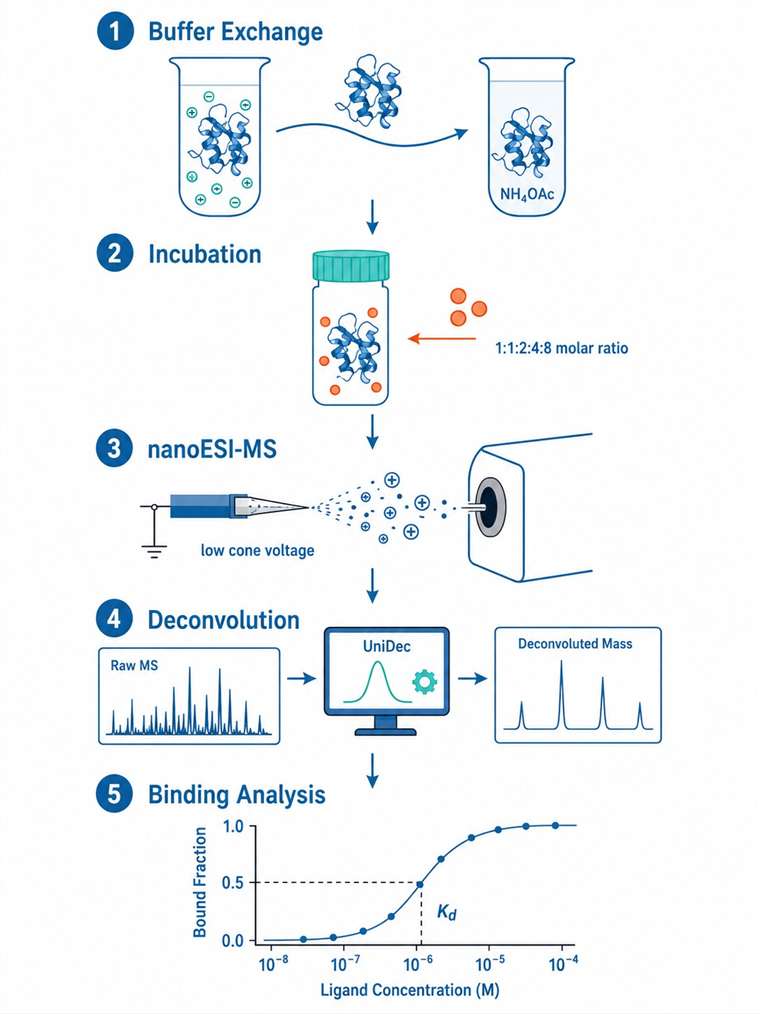
Our Small-Molecule/Protein Complex Native MS Service provides that direct evidence. Using electrospray ionization under carefully controlled native conditions, we preserve non-covalent protein-ligand complexes intact through the mass spectrometry analysis. The result is unambiguous mass-based confirmation of complex formation, binding stoichiometry, and relative binding affinity — all from picomoles of protein, in minutes per sample.

Why researchers choose this service:

  • Direct mass evidence of complex formation — no labels, no immobilization, no inference
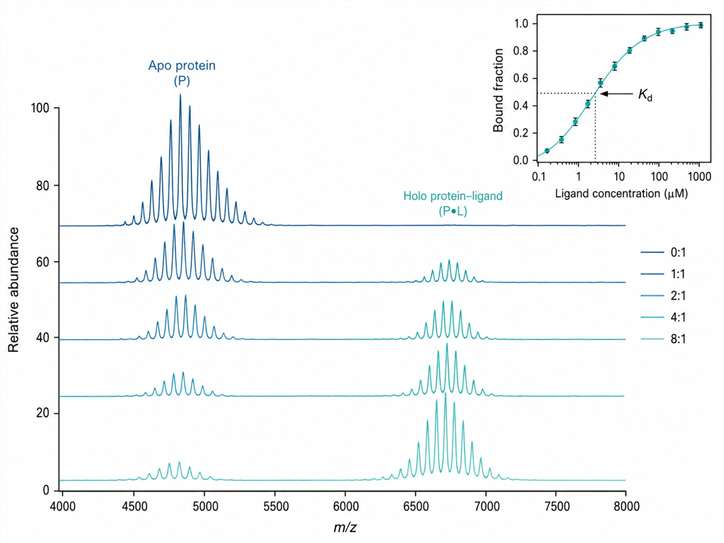
  • Binding stoichiometry from a single experiment — 1:1, 2:1, or higher-order complexes
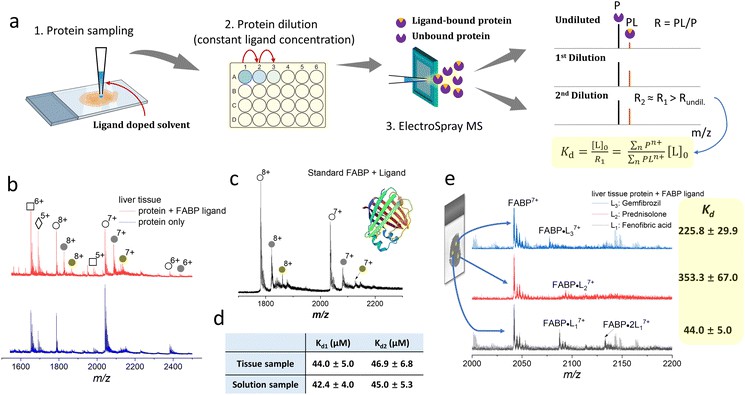
  • Relative affinity ranking and Kd estimation from titration series
  • Competition binding analysis for multi-ligand studies
Small-molecule/protein complex native MS service overview showing direct detection of non-covalent protein-ligand complexes, binding stoichiometry determination, and four key advantages.
Service Overview Key Advantages When to Use Workflow Tech Comparison Sample Demo Case Study FAQ

Why Native MS for Small-Molecule Binding Confirmation?

Drug discovery teams face a recurring bottleneck: confirming that a compound truly binds to its target. Indirect assays — fluorescence polarization, SPR, or enzymatic activity readouts — can produce false positives from aggregation, assay interference, or nonspecific effects. When a hit list arrives from HTS or a fragment screen, the question is always the same: did it really bind?

Native MS answers that question directly. By analyzing protein-ligand complexes in their folded, native state under physiological-compatible conditions, it produces a mass spectrum where the bound complex appears as a distinct species — shifted to a higher m/z than the unbound protein. The mass difference tells you not only that binding occurred, but exactly how many ligands are bound and at what relative affinity.

This is fundamentally different from ligand-observed MS methods (such as Ligand-Observed ESI-MS Binding Assays), which infer binding from free ligand depletion. Protein-observed native MS gives you a direct view of the complex itself — no labels, no immobilization, no inference.

Key Advantages

Direct Binding Evidence

Mass spectra show the protein-ligand complex as a distinct species — no ambiguity about whether binding occurred.

Stoichiometry Determination

The mass shift between apo and holo protein tells you exactly how many ligand molecules are bound.

Relative Affinity Ranking

Titration series produce binding curves that rank-order compounds by affinity, without developing a biochemical assay.

Low Sample Consumption

Typical experiments require 10–50 µM protein in 50 µL — picomole-level consumption.

Fast Turnaround

Data acquisition takes minutes per condition; a full titration series can be completed in hours.

Competition Binding Analysis

Co-incubation experiments reveal whether two ligands bind the same site or different sites.

When to Use This Service

Native MS is most impactful when researchers need unambiguous binding confirmation that indirect assays cannot provide. Below are representative scenarios where this service delivers a clear advantage.

Hit Validation After High-Throughput Screening

After an HTS campaign, confirming that hits bind directly to the target — rather than through aggregation, assay interference, or nonspecific effects — is critical. Native MS provides the most direct confirmation available.

Fragment Binding Confirmation in FBDD

Fragments bind with low affinity (µM to mM Kd), making them difficult to detect by many biophysical methods. Native MS is uniquely sensitive to weak binders and can confirm fragment hits identified by NMR, SPR, or other primary screens. Our Native MS Fragment Screening service offers a dedicated workflow for this application.

Lead Optimization SAR

As you progress from hit to lead, understanding how structural modifications affect binding is essential. Native MS titration series provide relative affinity data that guides SAR decisions.

Mechanism-of-Action Studies

Determine whether a compound binds to the active site, an allosteric site, or induces conformational changes that affect oligomerization. The stoichiometry and competition data from native MS provide mechanistic insight.

Competition and Collaborative Binding Analysis

When developing combination therapies or studying multi-ligand systems, native MS can distinguish competitive from non-competitive binding in a single experiment.

Our Workflow

The technical process consists of five essential stages:

1

Sample Preparation and Buffer Exchange

Your protein is buffer-exchanged into a native MS-compatible buffer (typically 100–200 mM ammonium acetate) using centrifugal filtration or dialysis. The ligand is prepared as a stock solution in DMSO or compatible solvent.

2

Protein-Ligand Incubation

The protein and ligand are mixed at defined molar ratios and incubated briefly to reach equilibrium. For titration experiments, we prepare a series of 6–8 ligand concentrations spanning the expected Kd range.

3

Native ESI-MS Acquisition

Samples are infused into a high-resolution Q-TOF or Orbitrap mass spectrometer via nano-electrospray ionization under optimized source conditions (low cone voltage, elevated source pressure, controlled temperature) that preserve non-covalent interactions.

4

Data Processing and Deconvolution

Raw mass spectra are processed using specialized software (UniDec, MassLynx, or custom pipelines) to deconvolute charge state distributions and determine the masses of the apo protein, the protein-ligand complex, and any additional binding events.

5

Binding Analysis and Reporting

Binding curves are constructed from titration data, and relative Kd values are estimated using established native MS binding models. For competition experiments, the displacement of one ligand by another is quantified.

Five-step native MS workflow for small-molecule/protein complex analysis: buffer exchange, incubation, nanoESI-MS acquisition, data deconvolution, and binding analysis.

Technology Comparison: Native MS vs. Alternative Binding Techniques

DimensionNative MS (Our Service)SPRITCNMRFluorescence Polarization
ThroughputHigh (minutes per condition)MediumLow (hours per titration)Low (hours per sample)High (plate-based)
Sample ConsumptionLow (picomoles)Medium (immobilization required)High (nanomoles)High (nanomoles)Low (picomoles)
Label-FreeYesYes (but requires immobilization)YesYesNo (fluorescent label required)
Stoichiometry InformationDirect from mass shiftIndirect (response level)Indirect (binding stoichiometry n)Indirect (chemical shift changes)Not available
Affinity RangemM to nM (weak binders well-detected)mM to pMmM to nMmM to nMmM to nM
Immobilization RequiredNoYesNoNoNo
Buffer RestrictionsVolatile buffers onlyWide rangeWide rangeWide rangeWide range

Sample Requirements

ParameterRecommendedAcceptableNotes
Protein Molecular Weight5–150 kDaUp to 300 kDaLarger proteins may require charge detection MS (CD-MS)
Purity≥ 90%≥ 80%Lower purity may complicate spectral deconvolution
Buffer100–200 mM ammonium acetate, pH 6.8–8.0Volatile buffers (ammonium bicarbonate, ammonium formate)Non-volatile buffers (PBS, Tris, NaCl) must be removed via buffer exchange
Protein Concentration10–50 µM2–100 µMLower concentrations may require signal averaging
Minimum Volume50 µL per condition20 µLMultiple conditions (titration) require proportionally more volume

Deliverables

  • Raw mass spectra — Full m/z range for each experimental condition
  • Deconvoluted mass spectra — Zero-charge mass spectra showing apo and holo protein species
  • Binding stoichiometry — Number of ligand molecules bound per protein, determined from mass shift
  • Relative binding affinity — Kd estimation from titration series, with binding curves
  • Competition binding results — Displacement curves for multi-ligand experiments
  • Comprehensive report — Methods, results, interpretation, and recommendations for follow-up

For clients who require additional structural context, we can integrate Ion Mobility MS (IM-MS) to provide collision cross-section (CCS) measurements, or perform CCS Binding Analysis for deeper structural characterization of the complex.

Representative Native MS Demo Data

The representative data below illustrates the type of information our native MS service delivers. A protein of known molecular weight is analyzed in the presence of increasing concentrations of a small-molecule ligand. The resulting spectra show a clear shift in mass corresponding to ligand binding, with the bound fraction increasing as a function of ligand concentration.

Representative native MS titration data showing apo protein peak shifting as ligand concentration increases, with binding curve plot.

Example native MS titration series and binding curve

Case Study: Direct Measurement of Protein-Ligand Binding Affinities from Biological Tissue Using Native MS

Yan, B. & Bunch, J. "A straightforward method for measuring binding affinities of ligands to proteins of unknown concentration in biological tissues." Chemical Science, 2025, 16, 8673–8681. https://doi.org/10.1039/D5SC02460A

Background

Measuring the binding affinity of a drug candidate to its target protein in a native tissue environment is a significant challenge. Traditional methods require purified protein, known protein concentration, and often involve labeling or immobilization. Bin Yan and Josephine Bunch at the National Physical Laboratory (UK) developed a dilution-based native MS method that overcomes these limitations, enabling Kd measurement directly from tissue samples without knowing the protein concentration.

Methods

The team used liquid extraction surface analysis (LESA) to sample proteins directly from mouse liver tissue sections. The extracted protein-ligand mixture was subjected to a series of dilutions while maintaining a constant ligand concentration. At each dilution step, the sample was analyzed by native nanoESI-MS. When the bound fraction stopped changing upon further dilution — indicating the protein concentration had fallen well below the Kd — the dissociation constant could be calculated using a simplified formula that does not require the protein concentration term.

Results

The method successfully measured the binding affinity of fatty acid-binding protein (FABP) to fenofibric acid directly from mouse liver tissue, yielding a Kd of approximately 44 µM — in excellent agreement with measurements using purified protein. The approach was further validated on four model protein-ligand systems (lysozyme-NAG3, RNase A-CDP, carbonic anhydrase I-indapamide, and carbonic anhydrase I-acetazolamide), showing strong correlation with conventional solution-phase titration MS. The entire workflow — from tissue sampling to Kd determination — was completed in approximately 15–20 minutes per sample.

Conclusion

This study demonstrates that native MS can provide quantitative binding information directly from complex biological matrices, eliminating the need for protein purification and quantification. The method's speed, low sample consumption, and compatibility with tissue samples make it a powerful tool for early-stage drug discovery, particularly for assessing target engagement in physiologically relevant contexts.

Schematic of the dilution-based native MS method for measuring protein-ligand binding affinities directly from tissue samples using LESA-nanoESI-MS.

Schematic of the dilution-based native MS workflow for Kd determination from tissue samples.

FAQ

Frequently Asked Questions

Q: What types of small molecules can be analyzed by native MS?

Small molecules with molecular weight typically below 1000 Da, including drug candidates, fragments, natural products, metabolites, and covalent inhibitors. The ligand must be soluble in the native MS-compatible buffer system. For poorly soluble compounds, we can work with low DMSO concentrations (typically ≤ 1% final).

Q: How do you ensure the complex observed in the gas phase reflects solution-phase binding?

We use three validation approaches: (1) titration series to confirm saturable binding — specific binding shows a hyperbolic binding curve, while nonspecific binding does not saturate; (2) competition with known binders to confirm binding site specificity; and (3) instrument parameter optimization — we systematically reduce in-source activation to the minimum required for desolvation, ensuring that observed complexes are not artifacts of the electrospray process.

Q: Can native MS distinguish between specific and nonspecific binding?

Yes. Specific binding produces defined stoichiometry (e.g., 1:1 or 2:1) with saturable binding curves. Nonspecific binding, in contrast, produces a continuum of adducts that increase linearly with ligand concentration and do not saturate. This is one of the key advantages of native MS over ensemble methods that cannot distinguish these populations.

Q: What binding information can I get that I cannot get from SPR or ITC?

Native MS provides three unique pieces of information: (1) direct binding stoichiometry from the mass shift — you see exactly how many ligands are bound; (2) the ability to detect and characterize weak binders (µM to mM Kd) that may be missed by ITC due to high protein consumption; and (3) the ability to analyze heterogeneous samples — if your protein sample contains multiple species (e.g., different oligomeric states or post-translational modifications), native MS can determine which species bind the ligand.

Q: How much protein do you need for a full binding study?

For a typical titration experiment with 6–8 ligand concentrations, we recommend 50–100 µL of 10–50 µM protein. This is significantly less than ITC (typically 200–500 µL of 50–100 µM) or NMR (typically 300–500 µL of 100–500 µM). For preliminary feasibility testing, as little as 20 µL of 5 µM protein may be sufficient.

Q: Can you analyze membrane proteins or challenging targets?

Yes. We have experience with detergent-solubilized membrane proteins, nanodisc-embedded targets, and multi-protein complexes. The buffer system and MS conditions must be optimized for each target type. We recommend a feasibility assessment before committing to a full study. Contact us to discuss your specific target.

References

  1. Yan, B. & Bunch, J. "A straightforward method for measuring binding affinities of ligands to proteins of unknown concentration in biological tissues." Chemical Science, 2025, 16, 8673–8681. DOI: 10.1039/D5SC02460A [Open Access, CC BY-NC 3.0]
  2. Sternicki, L.M. & Poulsen, S.-A. "Fragment-based drug discovery campaigns guided by native mass spectrometry." RSC Medicinal Chemistry, 2024, 15, 2171–2187. DOI: 10.1039/d4md00273c [Open Access]
  3. Britt, H.M. & Robinson, C.V. "Traversing the drug discovery landscape using native mass spectrometry." Current Opinion in Structural Biology, 2025, 102, 102993. DOI: 10.1016/j.sbi.2025.102993

Ready to Characterize Your Protein-Ligand Interactions?

Every drug discovery program reaches a point where you need to know — with certainty — whether your compound binds to its target. Native MS gives you that answer directly, quickly, and with minimal sample consumption. Contact our team to discuss your project and receive a tailored experimental plan.

Disclaimer: All products and services provided by Creative Proteomics are for research use only (RUO). They are not intended for use in diagnostic, therapeutic, or clinical procedures.

Online Inquiry

Please submit a detailed description of your project. We will provide you with a customized project plan to meet your research requests. You can also send emails directly to for inquiries.

* Email
Phone
* Service & Products of Interest
Services Required and Project Description