Proteomics (DIA/SWATH) Drug-Response Profiling

Unbiased, deep proteome-wide quantification of drug-induced protein expression changes using DIA/SWATH mass spectrometry.

Our DIA/SWATH drug-response profiling workflow captures 5,000–10,000+ proteins per run with inter-run CVs below 15%, giving you dose-response curves for thousands of proteins from a single experiment. The data becomes a permanent digital record you can re-mine for new targets or biomarkers years later.

Key Advantages:

  • Deep, unbiased proteome coverage — DIA fragments all detectable peptides systematically, bypassing the stochastic sampling bias of DDA
  • Quantitative reproducibility across conditions — consistent CVs below 15% across triplicate runs
  • Permanent digital proteome map — re-analyze data for new targets or biomarkers years later
  • End-to-end bioinformatics — from raw DIA data to publication-ready figures
  • Dose-response curve fitting with EC50 estimation for thousands of proteins
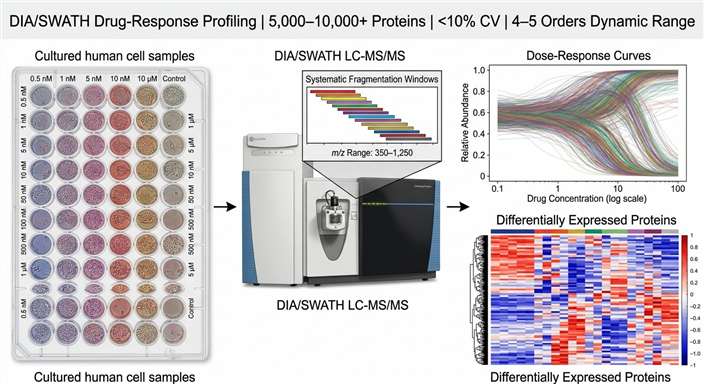
DIA/SWATH drug-response proteomics overview showing drug-treated cell samples, mass spectrometer workflow, and dose-response data visualization.
Why Proteomics Coverage & Performance Experimental Design Workflow Sample Demo Case Study FAQ

Why Proteomics? The Functional Dimension Beyond Transcriptomics

Drug discovery teams often ask whether transcriptomics is sufficient for understanding drug responses. The short answer: mRNA tells part of the story, but the functional response happens at the protein level.

Correlation between transcript and protein abundance across drug-treated conditions typically falls in the range of r ≈ 0.4–0.6 [SOURCE: Gygi et al., 2023]. That gap — more than half the drug response — is invisible to RNA-based methods. A drug that degrades its target kinase produces no mRNA change but a dramatic protein-level decrease. Drugs that alter protein secretion, stability, or post-translational modification are similarly invisible to transcriptomics.

DIA/SWATH proteomics captures the actual functional effectors — the proteins themselves. This direct readout of drug impact on cellular machinery is essential for understanding mechanism of action, identifying off-target effects, and discovering pharmacodynamic biomarkers that reflect real biological activity, not transcriptional surrogates.

For related capabilities, see our Pharmaco-proteomics and Cell-Based MS Screening services.

Proteome Coverage and Quantitative Performance

Proteome Coverage and Depth for Drug-Response Studies

DIA and SWATH overcome the fundamental limitation of DDA-based proteomics: stochastic precursor selection. In DDA, the instrument selects the most abundant precursor ions for fragmentation, systematically missing low-abundance but biologically critical proteins — kinases, transcription factors, cell-surface receptors. DIA fragments all precursor ions within defined m/z windows, regardless of abundance.

Sample TypeTypical Protein Groups QuantifiedKey Considerations
Cultured cell lines (HEK293, HCT116, K562)7,000–10,000+Highest coverage; ideal for MOA and off-target studies
Solid tissue biopsies5,000–8,000Dependent on tissue type and sample quality
Organoids and primary cells4,000–7,000Limited material requires optimization
Plasma/serum (undepleted)400–800Albumin-dominated; depletion adds depth
Plasma/serum (depleted)1,500–3,000Improved coverage for medium-abundance proteins
Biofluids (CSF, urine, BALF)500–2,500Variable by fluid type and volume

This depth ensures drug targets, off-targets, and downstream signaling components are captured in a single experiment, giving you a comprehensive view of drug-induced proteome remodeling.

Quantitative Performance: Reproducibility and Dynamic Range

Drug-response proteomics is only as valuable as your ability to reliably detect changes across treatment conditions. Here is how DIA/SWATH performs against the standard DDA alternative:

ParameterDIA/SWATH PerformanceDDA (Typical)Why It Matters
Inter-run CV (technical replicates)<10%20–30%Reliable detection of small fold changes
Missing values across replicates<5%20–40%Complete datasets for statistical analysis
Quantitative dynamic range4–5 orders of magnitude3–4 ordersDetection of both high- and low-abundance responders
Label-free quantificationYesYesNo isotopic labeling costs or complexity
Retrospective re-analysisFull (permanent digital record)Limited (stochastic sampling)Re-mine data for new hypotheses

The low missing-value rate is especially important for drug-response studies. In DDA, a protein may be quantified in one replicate but not another, creating gaps that complicate dose-response curve fitting and statistical testing. DIA's complete sampling ensures the same proteins are quantified across all samples, enabling robust comparison of drug doses and time points.

For complementary drug-response analysis methods, see our Metabolic Pathway Drug Response and Thermal Proteome Profiling (TPP) services.

Experimental Design Support for Drug-Response Profiling

Proper experimental design is the foundation of successful drug-response proteomics. Our team provides expert consultation on every aspect of study design to ensure statistically powered, publication-ready results.

DESIGN

Dose-Response Design Recommendations

ParameterRecommendationRationale
Number of concentrations5–8 (including vehicle control)Enables robust EC50 estimation and curve fitting
Dose range3–4 log units around expected active rangeCaptures full dose-response relationship
Biological replicatesn ≥ 3 per conditionMinimum for statistical significance with FDR control
Time points (kinetic studies)2–6 hours (early), 24–48 hours (adaptive)Captures both direct and indirect drug effects
Sample randomizationAcross all batchesMinimizes batch effects and systematic bias
Pooled QC injectionsEvery 5–10 runsMonitors instrument performance and normalization
SAMPLES

Sample Types We Routinely Process

  • Adherent and suspension cell lines (2D and 3D culture)
  • Primary cells and patient-derived organoids
  • Cryopreserved and FFPE tissue sections
  • Plasma, serum, CSF, urine, and other biofluids
  • Laser-capture microdissected tissue regions

For limited material (1–5 µg protein), we employ microflow and nanoflow LC-MS/MS configurations optimized for low-input DIA analysis.

For related dose-response methods, see our Dose-Response Thermal Profiling service.

Workflow: From Drug-Treated Samples to Proteome-Wide Response Data

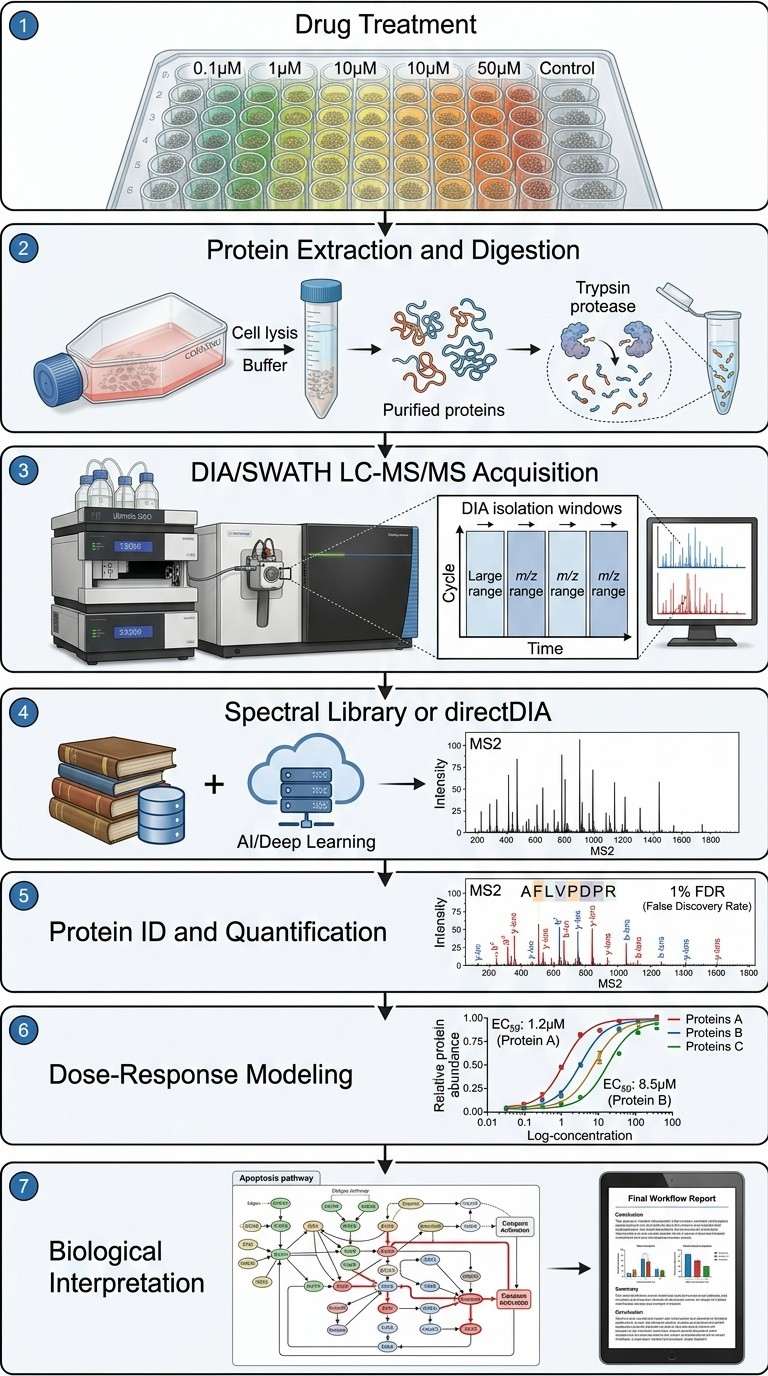
The workflow consists of seven essential stages:

1

Drug Treatment

Cells or tissue are treated with the drug at the selected concentration range and time points. Vehicle controls and positive controls are included in every experiment. Treatments use randomized plate layouts to minimize positional effects.

2

Protein Extraction and Digestion

Proteins are extracted using optimized lysis buffers, reduced, alkylated, and digested with trypsin (or alternative proteases for specific applications). Peptide cleanup uses C18 solid-phase extraction or SDB-RPS StageTips.

3

DIA/SWATH LC-MS/MS Acquisition

Digested peptides are separated by nanoLC (typically 60–120 min gradients) and analyzed on high-resolution mass spectrometers (Orbitrap Eclipse, timsTOF Pro, or ZenoTOF 7600). DIA methods use 30–100 variable-width isolation windows covering 350–1,250 m/z. Pooled QC samples are injected every 5–10 runs for performance monitoring.

4

Spectral Library Generation or Library-Free Analysis

A project-specific spectral library is generated from deep fractionation runs (optional), or library-free DIA analysis (directDIA) is performed using DIA-NN or Spectronaut with deep learning-based in silico spectral prediction.

5

Protein Identification and Quantification

Peptide and protein identification at 1% FDR. Quantification uses MS2 fragment ion-level summed intensities. Normalization corrects for technical variation.

6

Differential Expression and Dose-Response Modeling

Statistical analysis identifies significantly changing proteins across treatment conditions. Dose-response curves are fitted using four-parameter logistic models, and EC50 values are calculated for all responsive proteins.

7

Biological Interpretation and Reporting

Pathway enrichment, network analysis, and multi-omics integration are performed. A comprehensive final report with publication-ready figures is delivered.

Seven-step vertical workflow diagram for DIA/SWATH drug-response proteomics: drug treatment, protein extraction, LC-MS/MS acquisition, spectral library, quantification, dose-response modeling, and reporting.

Service Process:

Initial Consultation — We discuss your project goals, drug candidates, sample types, and experimental design. You receive a detailed study proposal and quote.

Experimental Design Review — Our scientists review your proposed dose range, time points, replicates, and controls. We provide recommendations to maximize statistical power and data quality.

Sample Receipt and QC — Samples are received, logged, and assessed for quality (protein concentration, integrity, purity). We communicate any issues immediately.

Project Execution — The agreed workflow is executed with regular progress updates. Mid-project data reviews are available for adaptive decision-making.

Data Delivery and Support — Final data packages are delivered with complete documentation. Post-delivery support includes data interpretation discussions and assistance with manuscript preparation.

Sample Requirements

Sample TypeMinimum Quantity (per sample)Recommended QuantityConcentrationFormatNotes
Adherent cell pellets1 × 10⁶ cells5 × 10⁶ cellsN/ADry pellet, snap-frozenWash with PBS before freezing
Suspension cell pellets1 × 10⁶ cells5 × 10⁶ cellsN/ADry pellet, snap-frozenRemove culture medium completely
Tissue (fresh frozen)5 mg20–50 mgN/ASnap-frozen in cryovialAvoid freeze-thaw cycles
Tissue (FFPE)2 × 10 µm sections5 × 10 µm sectionsN/AUnstained slidesDeparaffinization performed in-house
Plasma/serum10 µL50 µLN/AClear aliquot, no hemolysisHigh-abundance protein depletion optional
CSF20 µL100 µLN/AClear aliquotCentrifuge to remove debris
Protein extract10 µg50–100 µg≥0.5 µg/µLIn compatible bufferAvoid high urea or detergents

Bioinformatics Analysis

Our bioinformatics pipeline is structured into three tiers, each building on the previous:

TierAnalysis ModulesDeliverables
Tier 1 — Core QuantificationRaw data processing, protein quantification, normalization, missing value handling, PCA and sample clustering, pairwise differential expression with FDR correctionProtein quantification matrix, QC report, PCA plots, volcano plots, differentially expressed protein list
Tier 2 — Dose-Response and PathwaysDose-response curve fitting with EC50 estimation, time-series analysis, pathway enrichment (KEGG, Reactome, GO), kinase enrichment analysisDose-response curves with EC50 values, pathway enrichment maps, kinase enrichment scores
Tier 3 — Advanced Integrative AnalysisProtein-protein interaction networks, multi-omics integration (transcriptomics, metabolomics, phosphoproteomics), drug-target network mapping, biomarker candidate prioritizationNetwork visualizations, multi-omics correlation plots, prioritized biomarker candidates

Software and tools used: Spectronaut (commercial software), DIA-NN (open source), OpenSWATH / PyOpenMS, R/Bioconductor (limma, clusterProfiler, enrichR), custom Python pipelines for dose-response modeling.

For complementary conformational proteomics methods, see our LiP-MS service.

Representative DIA/SWATH Drug-Response Data

DIA/SWATH drug-response profiling produces rich, multi-dimensional data. The table below summarizes the types of results you can expect and how they are typically presented:

Result TypeDescriptionPresentation FormatBiological Insight
Protein quantification matrixAbundance values for all identified proteins across all samplesHeatmap with hierarchical clusteringGlobal view of drug-induced proteome changes
Dose-response curvesProtein abundance vs. drug concentration for individual proteinsLog-concentration response plots with EC50 annotationPotency ranking and target engagement confirmation
Volcano plotsFold change vs. statistical significance for pairwise comparisonsColored scatter plot with significance thresholdsIdentification of significantly affected proteins
Pathway enrichment mapsEnriched biological pathways and their significanceDot plot or bar chart with FDR valuesBiological processes affected by drug treatment
Time-course profilesProtein abundance changes over multiple time pointsLine plots with error bandsEarly vs. late proteomic responses
Kinase enrichment analysisPredicted upstream kinase activity changesKinase enrichment score plotIdentification of affected signaling pathways

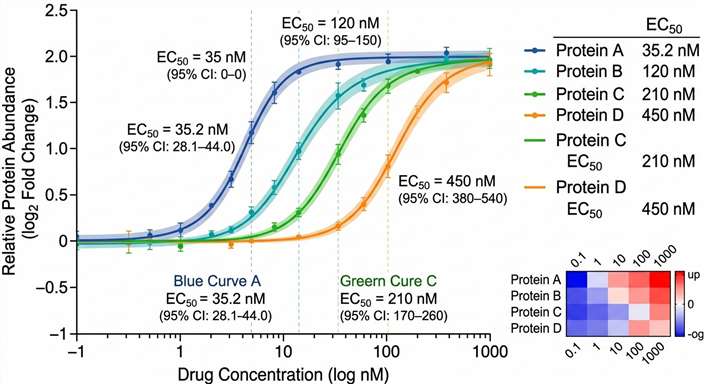
The representative image below shows example dose-response curves for proteins responding to drug treatment across a 4-log concentration range, with fitted EC50 values and 95% confidence intervals annotated for each curve.

Dose-response curves showing protein abundance changes across drug concentration range with EC50 values annotated for multiple proteins.

Example dose-response curves for drug-treated proteome profiling

Case Study: Dose-Resolved Proteome Profiling of Kinase Inhibitors

Eckert, S., Berner, N., Kramer, K. et al. "Decrypting the molecular basis of cellular drug phenotypes by dose-resolved expression proteomics." Nature Biotechnology, 2024. https://doi.org/10.1038/s41587-024-02218-y

Background

Single-dose proteomics studies miss the dose-dependent relationships that distinguish on-target pharmacology from off-target polypharmacology. Understanding the full proteomic impact of a drug requires measuring protein expression changes across multiple concentrations.

Methods

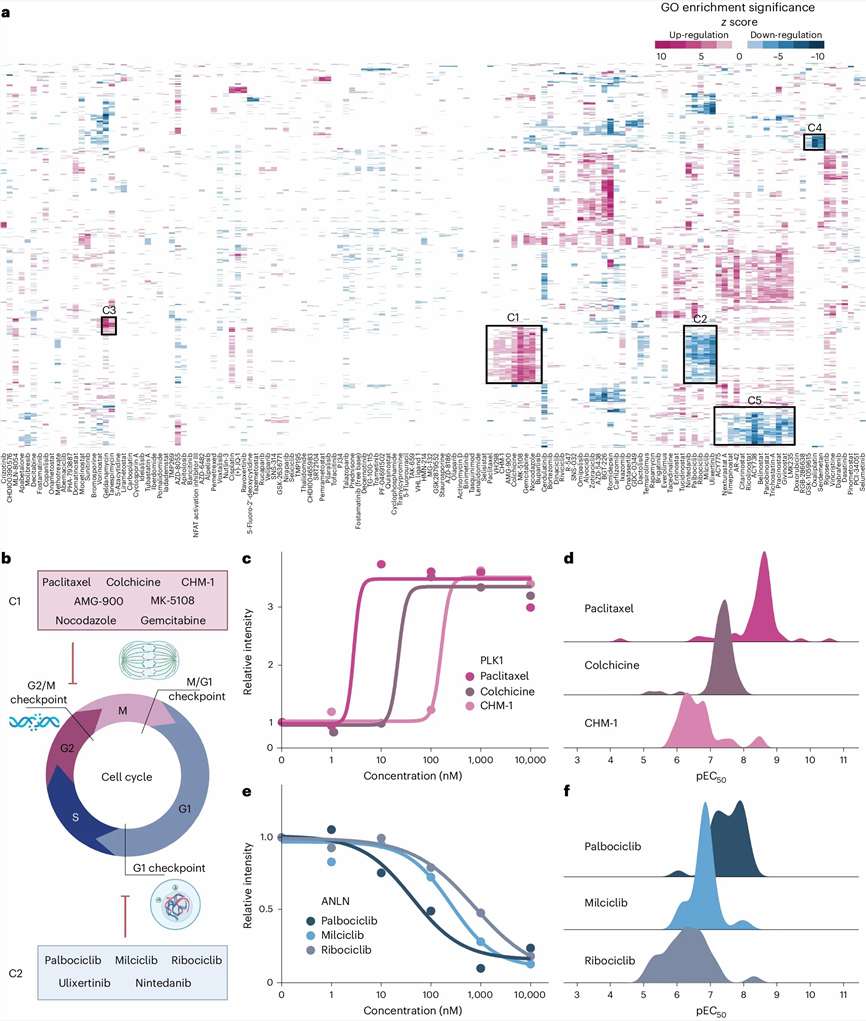
Eckert et al. (2024) developed decryptE, a DIA-based dose-resolved expression proteomics workflow, and profiled 144 clinically approved drugs across 8 concentrations (0.5 nM to 10 µM) in HCT116 colorectal carcinoma cells. The workflow combined automated sample preparation, DIA acquisition on an Orbitrap Eclipse Tribrid mass spectrometer, and a dedicated bioinformatics pipeline for dose-response curve fitting. Each drug treatment generated approximately 1,500 dose-response curves covering the quantified proteome.

Results

  • On-target mechanism confirmation: Brigatinib, a multi-kinase inhibitor, showed dose-dependent decreases in CLK1–4 proteins consistent with known target engagement. EC50 values derived from proteomic dose-response curves correlated well with binding affinities measured by biochemical assays.
  • Off-target polypharmacology discovery: Several drugs showed unexpected dose-dependent effects on proteins outside their intended target families, revealing previously unknown off-target activities relevant to both efficacy and toxicity.
  • Proteome-transcriptome discrepancies: Approximately 40% of drug-induced protein changes had no corresponding transcriptional change, confirming that direct proteomic measurement is essential for comprehensive drug characterization.

Conclusions

This study establishes DIA-based dose-resolved proteomics as a powerful approach for comprehensive drug characterization. The ability to generate thousands of dose-response curves from a single experiment enables deep mechanistic insight, off-target safety assessment, and pharmacodynamic biomarker identification.

Heatmap of differentially expressed proteins across multiple drug concentrations showing dose-dependent proteome changes in HCT116 cells.

Dose-resolved proteome profiling of 144 clinically approved drugs across 8 concentrations in HCT116 cells.

Frequently Asked Questions

What is the minimum sample amount required for DIA/SWATH drug-response profiling?

Typical input is 10–100 µg of protein extract per sample. For limited material — laser-capture microdissected tissue, rare cell populations, or precious clinical samples — we can optimize workflows down to 1–5 µg using microflow or nanoflow LC-MS/MS configurations.

How many proteins can I expect to quantify in a typical drug-response experiment?

For cell lines and tissue samples, expect 5,000–10,000+ protein groups routinely. Biofluids without depletion typically yield 500–2,000 proteins. The exact number depends on sample type, instrument platform, and gradient length — we will give you a realistic estimate after reviewing your samples.

Can DIA data be re-analyzed later for new targets or biomarkers?

Yes, and this is one of the main advantages of DIA. The acquisition creates a permanent digital record of all detectable peptides. You can apply new spectral libraries or analysis strategies retrospectively without re-running samples. This makes DIA particularly valuable for long-term biomarker discovery programs where new hypotheses emerge after the experiment is complete.

How do you handle multi-dose or time-course experimental designs?

We provide expert consultation on experimental design — dose range selection (3–6 concentrations), time point selection, replicate number (n ≥ 3), and randomization to minimize batch effects. Our bioinformatics pipeline is built for dose-response curve fitting and time-series analysis.

What data formats do you deliver?

Complete data packages including raw instrument files, processed quantification tables, statistical analysis results, dose-response curves, pathway enrichment maps, and publication-ready figures. Interactive data exploration dashboards are available on request.

Do you support regulatory submissions?

Yes. Data can be generated in compliance with ICH M10 guidelines for bioanalytical method validation. We provide detailed documentation of sample handling, instrument performance, QC metrics, and data processing protocols suitable for regulatory packages.

References

  1. Eckert, S., Berner, N., Kramer, K. et al.Decrypting the molecular basis of cellular drug phenotypes by dose-resolved expression proteomics. Nat Biotechnol, 2024. [License: CC BY 4.0]
  2. Mitchell, D.C., Kuljanin, M., Li, J. et al.A proteome-wide atlas of drug mechanism of action. Nat Biotechnol, 2023.
  3. Gotti, C., et al.Acquisition and analysis of DIA-based proteomic data: a comprehensive survey in 2023. Mol Cell Proteomics, 2024.
  4. Meissner, F., Geddes-McAlister, J., Mann, M. et al.The emerging role of mass spectrometry-based proteomics in drug discovery. Nat Rev Drug Discov, 2022.
  5. Messner, C.B., Demichev, V., Bloomfield, N. et al.Ultra-fast proteomics with Scanning SWATH. Nat Biotechnol, 2021.

Plan your DIA/SWATH drug-response profiling project with our team

Understanding the proteome-wide response to your drug candidates is essential for informed decision-making in drug discovery and development. Whether you need a pilot study with a few compounds or a large-scale screening campaign, our team has the expertise and infrastructure to deliver high-quality, publication-ready results.

Contact us to discuss your project. We will work with you to design an optimal experimental plan, provide a detailed quote, and guide you through every step of the process.

Disclaimer: All products and services provided by Creative Proteomics are for research use only (RUO). They are not intended for use in diagnostic, therapeutic, or clinical procedures.

Online Inquiry

Please submit a detailed description of your project. We will provide you with a customized project plan to meet your research requests. You can also send emails directly to for inquiries.

* Email
Phone
* Service & Products of Interest
Services Required and Project Description