Shotgun Proteomics Drug Effect Analysis Service

Analyze proteome-wide changes after compound treatment with LC-MS/MS shotgun proteomics, QC-backed data, and pathway-level interpretation.

Candidate compounds can change a biological system in many ways at once. A phenotype may show that a treatment worked, failed, or shifted a cell state, but it often does not explain which proteins, pathways, or cellular processes were involved. Our Shotgun Proteomics Drug Effect Analysis Service helps drug discovery teams profile proteome-wide changes after compound treatment and turn those changes into evidence that can be reviewed, discussed, and followed up.

We support treated vs control comparisons, dose and time response studies, compound signature analysis, pathway interpretation, and LC-MS/MS-based protein quantification. Our team helps you move beyond a simple protein list toward a clearer view of how a treatment changes the proteome.

Key advantages

  • Compare treated vs control proteomes
  • Profile dose and time responses
  • Interpret pathway-level protein changes
  • Compare compound response signatures
  • Receive QC-backed deliverables
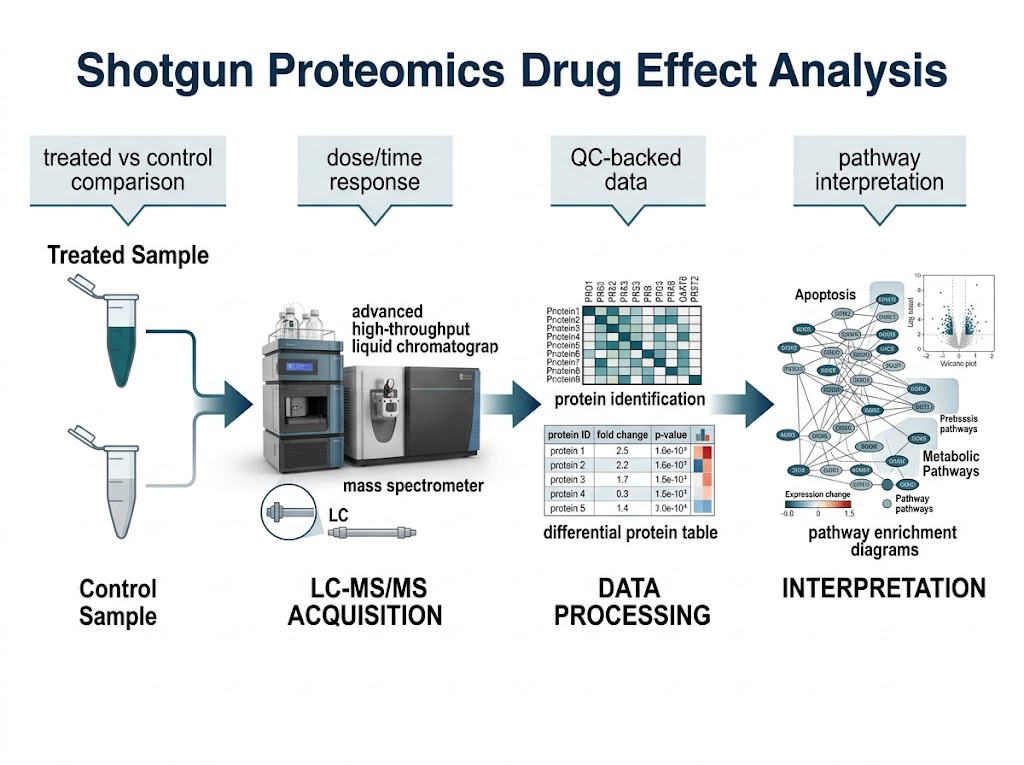
Shotgun proteomics drug effect analysis workflow showing treated samples, LC-MS/MS, protein matrix, and pathway interpretation.
Overview Methods Workflow Samples Analysis Strategy Case Study FAQ

Proteome-Wide Drug Effect Analysis for Compound-Treated Models

Shotgun proteomics drug effect analysis measures protein-level changes after compound treatment. In a typical study, we compare treated and control samples, identify and quantify proteins by LC-MS/MS, and interpret the resulting changes in the context of pathways, biological processes, and drug-response patterns.

This service is a strong fit when your team needs to answer questions such as:

  • Which proteins change after compound treatment?
  • Does the treated group separate from the control group at the proteome level?
  • Do different compounds produce similar or distinct protein response signatures?
  • Does the response change with dose or exposure time?
  • Which pathways or functional modules appear to be affected?
  • Which proteins may be worth selecting for follow-up validation?

What This Service Measures

We analyze proteome-wide protein abundance changes from drug-treated research samples. Depending on your study design, the workflow may use label-free shotgun proteomics, DIA proteomics, or multiplexed proteomics.

Typical readouts include:

  • Protein identification table
  • Protein quantification matrix
  • Differential protein abundance table
  • Treated vs control comparison
  • Dose- or time-associated protein response
  • Compound response signature comparison
  • Pathway, GO, Reactome, or KEGG enrichment
  • Protein network or functional module interpretation
  • QC summary and reviewable data package

Drug-Effect Questions It Can Support

Shotgun proteomics is useful when your team needs a broad protein-level view of treatment response. It can help connect an observed phenotype with protein abundance changes and pathway-level shifts.

  • Is the observed phenotype linked to a broad proteome response?
  • Which functional pathways are most affected by treatment?
  • Are stress-response, metabolic, cytoskeletal, translational, or protein-processing pathways involved?
  • Do different doses produce stronger or weaker protein-level effects?
  • Do candidate compounds cluster by proteome response?
  • Which protein changes should be followed by targeted validation or signaling-focused assays?

What the Results Can and Cannot Prove

Proteome-wide changes can support mechanism hypotheses, but they should not be treated as direct proof of drug binding or target engagement. A differential protein may be part of the response, a downstream effect, or a marker of cellular state.

If the central question is direct binding, occupancy, or selectivity, a target engagement or binding-focused method may be needed. If the question is how the biological system responds after treatment, shotgun proteomics gives you a broad discovery view.

When Shotgun Proteomics Helps Answer Drug-Effect Questions

Shotgun proteomics is most useful when you want to understand how a compound changes the total proteome across a treatment matrix. It is especially helpful when phenotype alone does not explain what happened.

Compare Treated and Control Proteome Responses

A treated vs control comparison can show which proteins increase or decrease after compound exposure. This gives your team a first view of the treatment-associated protein response.

We help you interpret the differential protein table together with QC metrics, replicate behavior, and pathway enrichment. The goal is to understand whether the observed protein changes form a coherent biological pattern, not just to count how many proteins changed.

Track Dose- or Time-Dependent Protein Changes

A single treatment condition may miss important trends. If your study includes dose levels or exposure times, we can evaluate whether the proteome response strengthens, weakens, reverses, or shifts across the matrix.

This can be helpful when you need to know whether a compound produces an early response, a delayed response, or a dose-associated response pattern.

Compare Compound Response Signatures

When several compounds produce similar phenotypic effects, shotgun proteomics can help compare their protein-level response signatures.

For example, two compounds may both reduce cell growth, but one may primarily affect translation and stress-response proteins while another affects metabolism, cytoskeleton, or protein degradation. This type of comparison can support candidate prioritization and follow-up planning.

Explore Pathway and Stress-Response Clues

Drug treatment may affect protein networks linked to cellular stress, metabolism, translation, cytoskeleton organization, mitochondrial function, protein folding, or degradation pathways.

We keep the interpretation grounded. These patterns can provide useful mechanism-supporting clues, but they do not replace direct target validation.

Prioritize Follow-Up Validation Targets

A broad proteomics screen can generate many candidate proteins. We help organize the results into a smaller set of interpretable outputs: differential proteins, enriched pathways, protein clusters, and follow-up candidates.

This can help your team decide whether to pursue targeted protein assays, phosphoproteomics, target engagement studies, or multi-omics integration.

Service Capabilities and Method Options

We support proteomics drug effect studies from experimental design review through data interpretation. Before analysis begins, we review your treatment matrix, sample type, comparison groups, replicate structure, and expected deliverables.

The best method depends on sample amount, number of groups, expected complexity, and the level of quantitative consistency needed.

MODE 1

Label-Free Shotgun Proteomics for Broad Response Discovery

Label-free shotgun proteomics is a flexible option for broad protein discovery. It is suitable when your team wants a proteome-wide view of treatment-associated protein changes without chemical labeling.

  • Treated vs control comparisons
  • Broad protein identification and quantification
  • Early drug-effect profiling
  • Pathway and functional enrichment analysis
  • Follow-up protein candidate selection
MODE 2

DIA Proteomics for Cross-Sample Quantitative Consistency

DIA proteomics is useful when cross-sample quantitative consistency is a major priority. It can be a strong fit for studies with multiple samples, repeated comparisons, or treatment matrices where missing values and reproducibility are key concerns.

  • Multiple treatment groups
  • Dose or time response designs
  • Larger sample sets
  • Quantitative comparison across many conditions
  • Low-input or trace sample scenarios where feasible
MODE 3

TMT or Multiplexed Proteomics for Multi-Group Designs

TMT or other multiplexed proteomics strategies can support multi-group comparison in a labeled format. This can be useful when the study structure fits multiplexing and batch design can be handled carefully.

We do not treat TMT as a universal solution for every project. Our team reviews group design, sample number, batch structure, and data goals before recommending it.

MODE 4

Low-Input or Trace Proteomics for Limited Material

Some drug-response studies involve limited material, such as small tissue regions, rare cell populations, low-input cell pellets, or special model systems. DIA-based trace proteomics may be considered when sample amount is limited and the study design supports it.

Trace workflows require careful planning because protein yield, sample loss, and handling variation can strongly affect data quality.

MODE 5

Follow-Up Options for Targeted or Signaling-Focused Questions

Shotgun proteomics can identify candidate proteins and affected pathways. If the next question becomes more focused, we can help plan follow-up strategies such as targeted protein validation, phosphoproteomics for signaling response, protein interaction evidence, target engagement studies, or matched metabolomics and lipidomics integration.

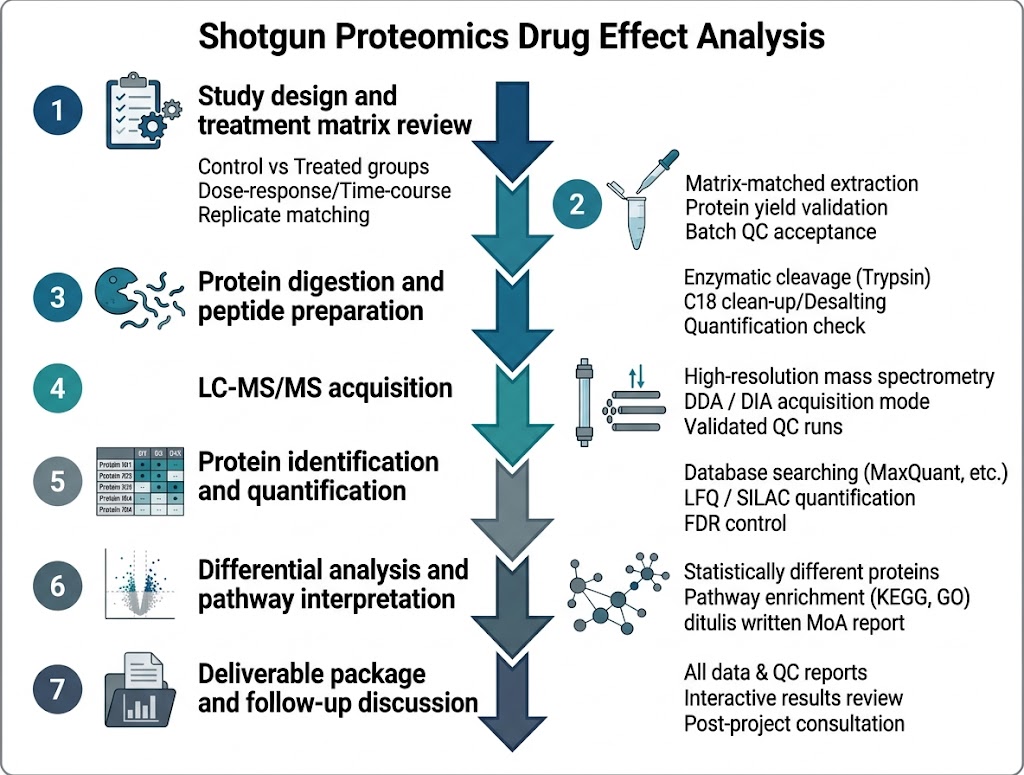
Shotgun Proteomics Drug Effect Workflow with QC Checkpoints

Our workflow combines project planning, protein extraction, enzymatic digestion, LC-MS/MS acquisition, data processing, QC review, and biological interpretation. Each step is designed to protect data quality and make the final results easier for your team to review.

1

Study Design and Treatment Matrix Review

We begin by reviewing your study design. This includes compound code, dose, exposure time, vehicle control, model type, biological replicates, sample type, collection method, and planned comparisons.

QC focus: treatment matrix clarity, control design, replicate consistency, sample metadata completeness, and comparison plan.

2

Sample Receipt and Protein Extraction QC

After samples arrive, we review labels, storage condition, shipping condition, sample type, and visible concerns. Proteins are then extracted using a workflow suited to the sample matrix.

QC focus: sample integrity, low-temperature handling, matrix consistency, protein extraction suitability, and special treatment notes.

3

Protein Digestion and Peptide Preparation

Extracted proteins are prepared for LC-MS/MS analysis. In bottom-up proteomics, proteins are digested into peptides, and peptides are cleaned up or prepared according to the selected method.

QC focus: protein amount, digestion consistency, peptide recovery, sample carryover risk, and preparation reproducibility.

4

LC-MS/MS Acquisition

Prepared peptide samples are analyzed by LC-MS/MS. Liquid chromatography separates peptides before mass spectrometry detection. The mass spectrometer then collects peptide and fragment ion information used for protein identification and quantification.

QC focus: instrument performance, retention time stability, peptide signal quality, mass accuracy, and batch consistency.

5

Protein Identification and Quantification

MS data are processed to identify peptides and infer proteins. Protein abundance values are then generated and organized into a protein quantification matrix.

QC focus: peptide-spectrum matching, protein inference, quantification stability, missing value pattern, and replicate correlation.

6

Differential Analysis and Pathway Interpretation

After QC review, we perform group comparisons according to the study design. This may include treated vs control analysis, dose response, time-course comparison, compound response clustering, and pathway enrichment.

QC focus: statistical model fit, group structure, normalization, batch effect review, and interpretation boundaries.

7

Deliverable Package and Follow-Up Discussion

The final deliverable package is prepared for your team’s review. We provide data tables, QC summaries, figures, pathway outputs, and interpretation notes.

Workflow diagram for shotgun proteomics drug effect analysis with QC checkpoints.

Sample Requirements for Drug-Treated Proteomics Studies

Good proteomics data depends on representative sampling, consistent handling, and clear treatment metadata. For drug-treated samples, please provide detailed notes on compound, dose, vehicle, exposure time, collection method, and any special treatment conditions.

Creative Proteomics’ proteomics sample guide emphasizes sample representativeness, accuracy, reproducibility, rapid processing, cryopreservation, and clear notes for drug-treated or otherwise specially treated samples. Samples should be flash-frozen, stored at -80°C, and shipped with dry ice when applicable.

Sample TypeRecommended Study ContextLabel-Free InputDIA InputTrace DIA OptionRequired Treatment MetadataStorage / ShippingQC Notes
Drug-treated cellsTreated vs control, dose/time response, compound comparison5×106 cells1×107 cells200–5000 cellsCompound code, dose, vehicle, exposure time, replicate ID, cell density-80°C / dry iceKeep cell number and harvest timing consistent
General animal tissueDisease-model drug responseHard tissue: 200 mg; soft tissue: 100 mgHard tissue: 300–500 mg; soft tissue: 200 mg30–50 mgTreatment group, tissue region, collection time-80°C / dry iceUse consistent tissue region and remove non-research tissue where possible
Plasma / serum / CSFBiofluid proteome response20 μL without depletion; 50–100 μL with depletion20 μL without depletion; 100 μL with depletion10 μL without depletion; 20 μL with depletionTreatment group, collection time, depletion plan-80°C / dry iceAvoid hemolysis and inconsistent handling
Follicular fluidBiofluid proteomics where appropriate100 μL200 μL20 μLTreatment group, collection method, collection time-80°C / dry iceKeep collection and storage consistent
Lymph, synovial fluid, puncture fluid, ascitesFluid proteomics where appropriate3 mL5 mL1 mLTreatment group, collection method, collection time-80°C / dry iceCentrifuge when needed to remove debris
Saliva / tears / milkFluid proteomics where appropriate1 mL3–5 mLSaliva/tears: 500 μLTreatment group, collection time, collection protocol-80°C / dry iceAvoid contamination and inconsistent collection timing
Culture supernatantSecreted protein response10 mL20 mL5 mLMedium, treatment, exposure time, cell status-80°C / dry iceFollow project-specific medium guidance before submission
FFPEArchived tissue where appropriate10 slices15–20 slicesConfirm before submissionTissue region, section thickness, treatment groupConfirm before submissionEach slice: 10 μm thickness, 1.5×2 cm area
IP / pull-down eluateInteraction-focused follow-upSDS-PAGE short-run gel or ~20 μL SDS loading buffer elutionProject-dependentNot standardBait, treatment, lysis method, elution bufferCold shipment or project-specificProvide buffer composition and processing details

Please include a sample information sheet with group names, sample IDs, treatment conditions, biological replicate IDs, collection time, and storage history. If the sample was exposed to drug treatment, viral infection, temperature treatment, injury, drought stress, or another special condition, please describe it clearly.

Bioinformatics Analysis and Proteome Response Interpretation

Shotgun proteomics drug effect analysis does not stop at protein identification. The value comes from turning protein tables into interpretable drug-response evidence.

We process the data through protein identification, quantification, QC review, differential analysis, visualization, enrichment analysis, and interpretation. The final analysis plan depends on your sample type, group structure, and research question.

Minimum Analysis Deliverables

  • Raw MS data where applicable
  • Protein identification table
  • Protein quantification matrix
  • Peptide and protein QC summary
  • Missing value and filtering notes
  • Differential protein table
  • PCA, clustering, heatmap, or volcano plot
  • GO, KEGG, or Reactome enrichment results
  • Functional module summary
  • Interpretation notes for drug-effect response

Pathway, GO, and Network Interpretation

Differential proteins are more useful when they are interpreted as part of biological processes and pathways. We can help summarize whether treatment affects functions such as translation, protein folding, metabolism, cytoskeleton organization, oxidative stress, mitochondrial pathways, protein degradation, or immune-related response, depending on the data.

  • GO enrichment analysis
  • KEGG or Reactome pathway analysis
  • Protein-protein interaction network review
  • Functional module grouping
  • Pathway-level summary figures
  • Follow-up candidate protein list

Dose, Time, and Compound-Response Add-Ons

  • Dose-response protein trend analysis
  • Time-course proteome response analysis
  • Compound response clustering
  • Protein signature comparison
  • Shared vs condition-specific protein changes
  • Follow-up candidate prioritization

These add-ons help your team evaluate whether the proteome response is consistent, dose-associated, time-dependent, or compound-specific.

Multi-Omics Integration When Matched Datasets Are Available

Proteomics can be integrated with metabolomics, lipidomics, transcriptomics, or phenotype data when matched samples are available.

  • Proteomics may show changes in enzymes, structural proteins, or stress-response proteins.
  • Metabolomics may show shifts in metabolic pathway outputs.
  • Lipidomics may show membrane or lipid storage remodeling.
  • Transcriptomics may show whether protein-level changes align with gene expression trends.

Together, these layers can help build a stronger mechanism hypothesis than a single dataset alone.

Representative Demo Results: What Your Drug-Proteomics Data May Show

Your final results will depend on the method, sample type, comparison matrix, and data quality. The examples below show common result formats we can prepare for drug-effect proteomics studies.

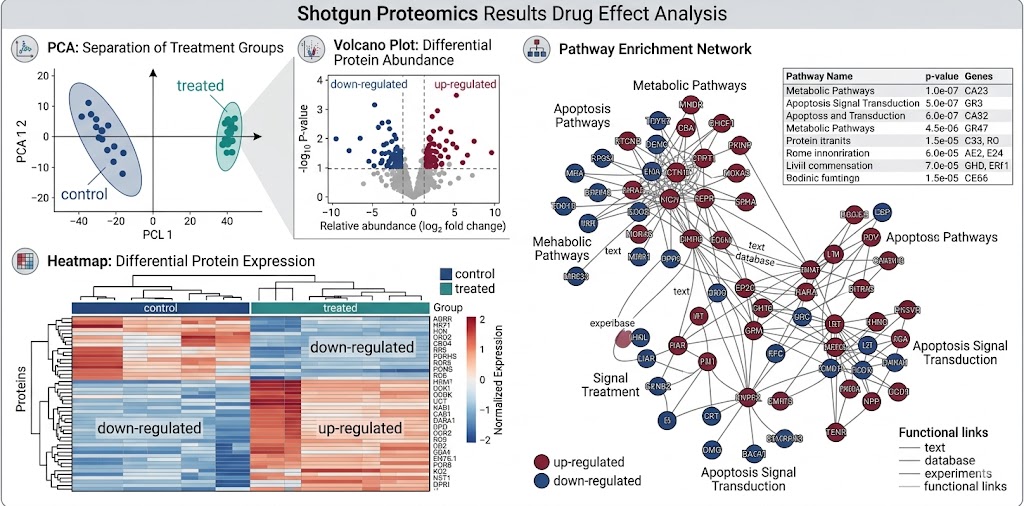
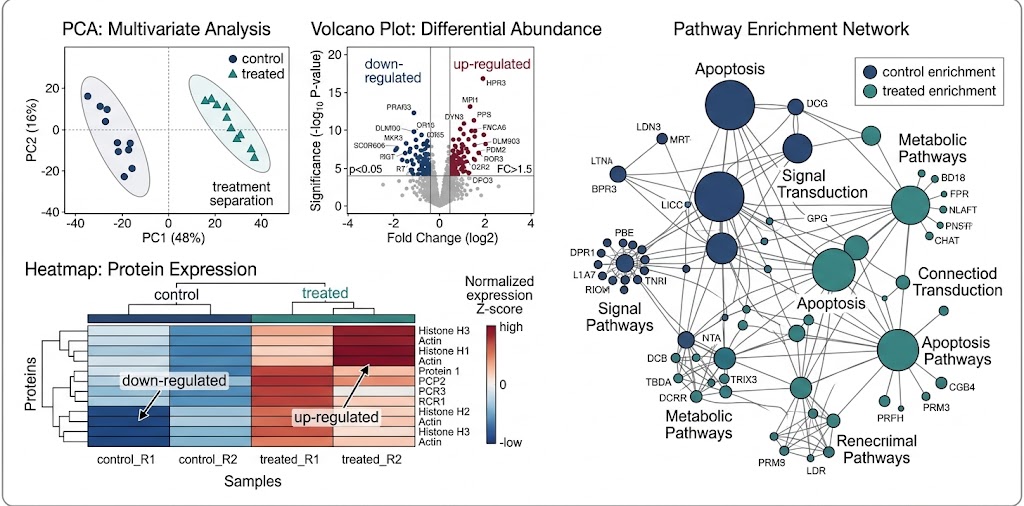
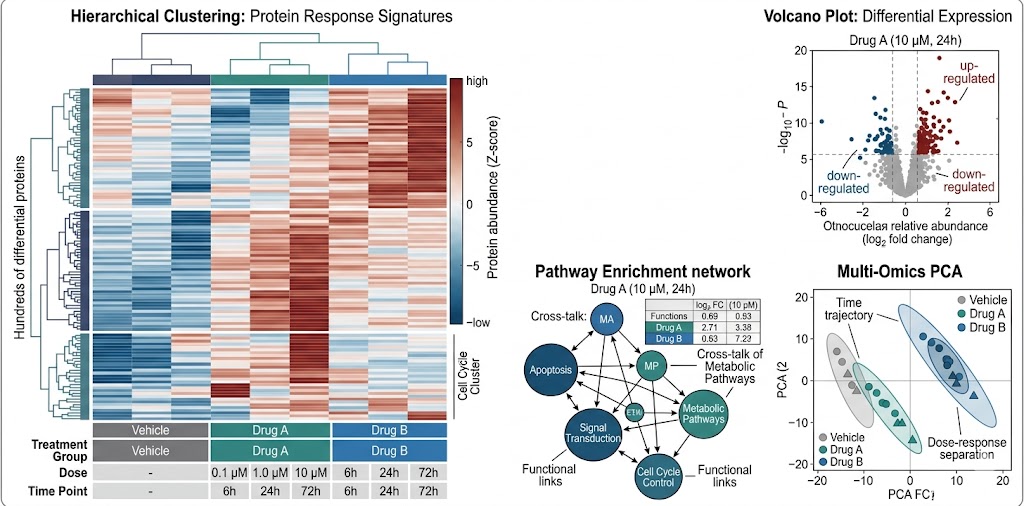
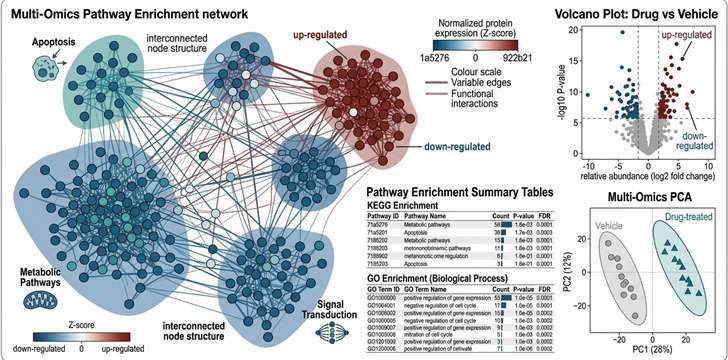
Demo shotgun proteomics drug effect results showing PCA, volcano plot, heatmap, and pathway enrichment network.

Proteome-Wide Group Separation Dashboard

A PCA or clustering plot can show whether treated groups separate from controls at the proteome level. It can also reveal whether replicates cluster well and whether dose or time groups show progressive separation.

Suggested visual: PCA plot or sample clustering dashboard.

Volcano plot and differential protein summary for shotgun proteomics drug effect analysis.

Differential Protein and Volcano Plot Summary

A volcano plot can show proteins with higher or lower abundance after treatment. This provides a quick view of both magnitude and statistical support.

Suggested visual: Volcano plot plus differential protein summary.

Hierarchical clustering heatmap showing protein response signatures across drug treatment groups.

Protein Response Signature Heatmap

A heatmap can show protein response signatures across treatment groups, compounds, doses, or time points. This helps reveal shared and distinct response patterns.

Suggested visual: Hierarchical clustering heatmap.

Pathway enrichment and protein network view for proteomics drug effect analysis.

Pathway Enrichment and Protein Network View

Pathway enrichment can organize differential proteins into biological processes, functional modules, or protein networks.

Suggested visual: GO / KEGG / Reactome enrichment bubble plot or network map.

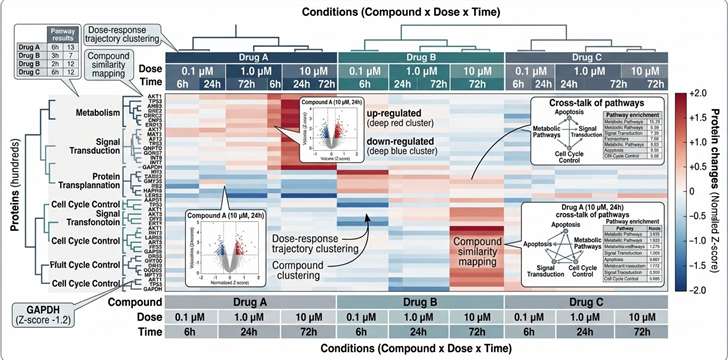
Compound response clustering map for proteomics drug effect analysis.

Compound, Dose, or Time Response Clustering

For multi-condition projects, response clustering can help compare how similar or different the proteome response is across candidates or treatment conditions.

Suggested visual: Compound response correlation map or signature clustering plot.

How to Choose the Right Proteomics Strategy

The best strategy depends on your study question, sample amount, number of groups, and whether you need broad discovery, quantitative consistency, signaling detail, or targeted validation.

StrategyBest Used WhenStrengthLimitationPractical Decision Rule
Shotgun Proteomics Drug Effect AnalysisYou need a broad protein-level view after compound treatmentStrong for total proteome response and pathway interpretationDoes not prove direct binding by itselfUse when the main question is how treatment changes the proteome
Label-Free Shotgun ProteomicsYou need broad discovery with a flexible designGood for early discovery and protein abundance profilingMissing values may increase in complex designsUse for early broad profiling and straightforward group comparisons
DIA ProteomicsYou need consistent cross-sample quantificationStrong for reproducibility across larger sample setsRequires careful method and data setupUse when comparison consistency is a priority
TMT / Multiplexed ProteomicsYou need multi-group comparison in a labeled formatUseful for multiplexed group designsBatch design and ratio compression must be consideredUse when group structure fits multiplexing
PhosphoproteomicsYou need signaling or kinase pathway responseCaptures phosphorylation-level changesDoes not replace total proteome profilingUse when signaling activity is the central question
Targeted Protein AssaysYou have selected proteins for follow-upFocused and quantitativeLimited discovery breadthUse after discovery identifies a short protein list
Metabolomics / LipidomicsThe phenotype appears metabolic or lipid-centeredCaptures biochemical or lipid pathway remodelingDoes not measure protein abundanceUse when protein data alone may not explain the phenotype
Target Engagement / Binding EvidenceYou need direct binding, occupancy, or selectivity evidenceCloser to target-level evidenceDoes not show whole-proteome responseUse when direct engagement evidence is the main question

Practical Selection Rules

Choose shotgun proteomics drug effect analysis when:

  • You want a broad view of protein changes after treatment.
  • You need treated vs control proteome comparison.
  • You need dose, time, or compound response interpretation.
  • You want pathway-level protein evidence for follow-up planning.
  • You need a reviewable data package for internal discussion.

Choose DIA when cross-sample quantitative consistency is critical, multiple treatment groups are included, or the design needs stronger comparison consistency. Choose TMT or multiplexed proteomics when your study design fits grouped labeling and batch planning can be handled carefully.

Choose phosphoproteomics when the main question is signaling response. Choose binding or target engagement methods when you need direct evidence that a compound binds a target.

For direct binding-focused screening, our Affinity Selection Mass Spectrometry service can help evaluate ligand-target interactions before or alongside proteome response studies. Depending on the biological question, orthogonal methods such as Biacore Service or Chemical Cross-Linking Mass Spectrometry Service may also support follow-up planning.

Deliverables for Reviewable Drug-Effect Decisions

We design deliverables so your team can review the data, understand the QC, and decide what to test next. The exact package depends on method and study scope, but the goal is always the same: make the results traceable, interpretable, and useful for research decisions.

Raw and Processed Data Files

  • Raw MS data where applicable
  • Peptide identification table
  • Protein identification table
  • Protein quantification matrix
  • Group comparison tables
  • Differential protein tables

QC and Filtering Summary

  • Sample-level QC notes
  • Protein and peptide identification summary
  • Missing value and filtering notes
  • Replicate consistency review
  • Batch effect review where applicable
  • Normalization summary
  • Instrument or acquisition QC summary

Statistical and Pathway Outputs

  • PCA or clustering plots
  • Heatmaps
  • Volcano plots
  • Differential protein lists
  • GO / KEGG / Reactome enrichment tables
  • Protein network or functional module figures
  • Dose/time or compound response trend outputs when designed

Interpretation Notes and Follow-Up Recommendations

  • Which protein groups changed after treatment
  • Which pathways or biological processes were enriched
  • Whether response patterns differ by compound, dose, or time
  • Which findings may support a mechanism hypothesis
  • Which proteins or pathways may be useful for follow-up validation

Case Study: Proteomics Reveals Treatment-Associated Pathway Changes

Background

Treatment studies often produce complex biological responses that are difficult to interpret from phenotype alone. In a 2025 study, García-Hernández and colleagues used quantitative proteomics to study molecular mechanisms in a non-Hodgkin lymphoma mouse model treated with incomptine A.

The paper compared treatment-associated proteome changes in lymph node samples and used pathway analysis to interpret altered protein groups. This type of study is relevant to drug-effect proteomics because it shows how protein abundance data can be connected to pathway-level interpretation.

Source: Quantitative Proteomics and Molecular Mechanisms of Non-Hodgkin Lymphoma Mice Treated with Incomptine A, Part II

Methods

The study used treatment groups including vehicle control, methotrexate, and incomptine A at 5 mg/kg and 10 mg/kg. Lymph node pools were prepared according to group and anatomical location.

For proteomics, the researchers extracted proteins, measured protein concentration, reduced and alkylated samples, digested proteins with trypsin, labeled peptides with TMT reagents, combined samples, fractionated peptides, and analyzed them by nano LC-MS/MS. The downstream analysis used KEGG, Reactome, and Gene Ontology databases to interpret protein-level changes.

Results

The study identified and quantified 2717 proteins. Differential expression was evaluated using fold-change thresholds, and the paper reported 412 differentially expressed proteins across treatment comparisons.

  • The study compared down-regulated and up-regulated proteins across multiple treatment groups, including incomptine A dose groups and methotrexate.
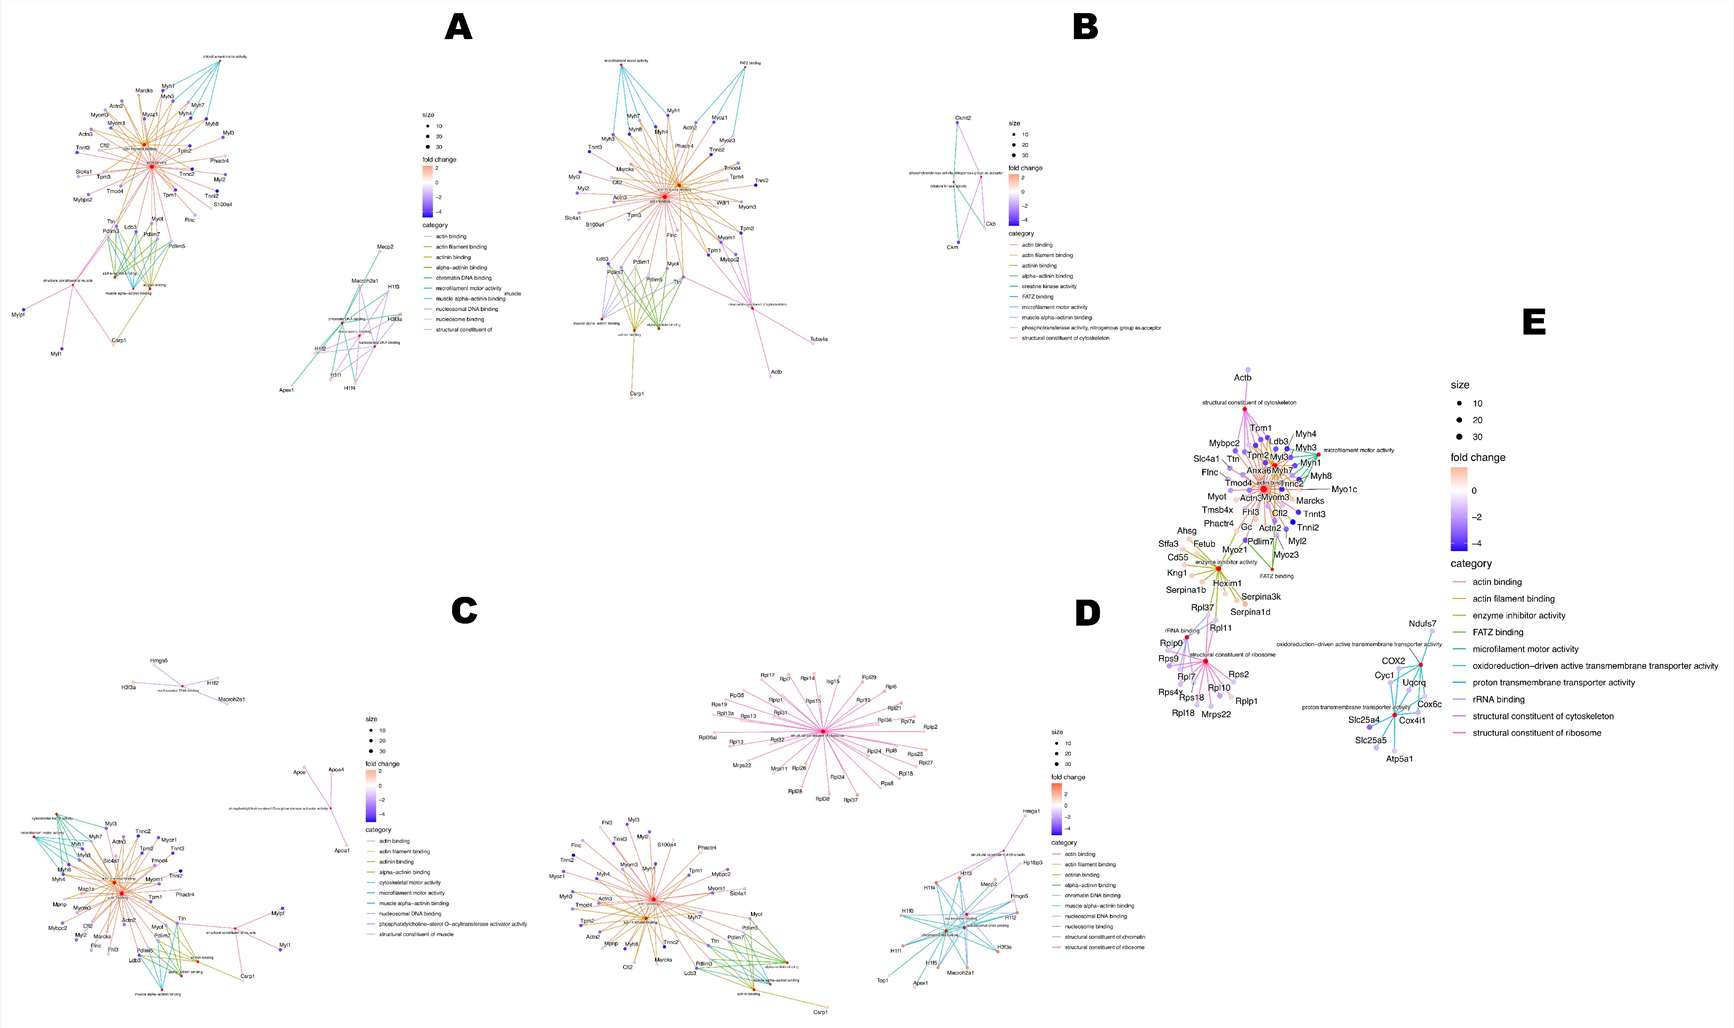
  • Figure 4 showed Gene Ontology Molecular Function network enrichment from up-regulated and down-regulated proteins across treatment comparisons.
  • In the C− versus 5LANM comparison, the authors reported 76 down-regulated and 69 up-regulated proteins, with altered proteins related to cytoskeleton organization, actin binding, microfilament activity, nucleosome binding, and chromatin DNA binding.
  • In the C− versus 5RINM comparison, the authors reported 117 down-regulated and 72 up-regulated proteins, including functional categories related to cytoskeleton structure and phosphotransferase activity.
  • In the C− versus 10RINM comparison, the authors reported 83 down-regulated and 132 up-regulated proteins, with altered proteins related to actin binding and ribosome structural components.
  • In the C− versus MTX comparison, the authors reported 111 down-regulated and 63 up-regulated proteins, with altered proteins related to proton transmembrane transporter activity and enzyme inhibitor activity.

Figure 4 is useful for this page because it shows how quantitative proteomics can move from protein abundance changes to functional network interpretation. It does not simply list proteins; it organizes altered proteins into molecular function patterns across treatment comparisons.

Conclusion

This case supports shotgun proteomics drug effect analysis because it demonstrates a full path from treatment comparison to protein-level response and pathway interpretation. For drug discovery teams, this type of workflow can help identify treatment-associated functional changes, compare response patterns, and select proteins or pathways for follow-up validation.

Figure 4 showing network enrichment analysis of differentially expressed proteins after treatment in a non-Hodgkin lymphoma mouse model.

Figure 4 from García-Hernández et al. shows Gene Ontology Molecular Function network enrichment across treatment comparisons.

The publications below provide scientific context for quantitative proteomics, drug-effect analysis, data interpretation, and LC-MS/MS proteomics workflows.

  1. Quantitative Proteomics and Molecular Mechanisms of Non-Hodgkin Lymphoma Mice Treated with Incomptine A, Part II
    Treatment-associated quantitative proteomics and Figure 4 pathway network evidence.
  2. TraianProt: A User-Friendly R Shiny Application for Wide Format Proteomics Data Downstream Analysis
    Proteomics downstream analysis context, including preprocessing, differential expression, functional analysis, and visualization.
  3. Fast Proteome Identification and Quantification from Data-Dependent Acquisition—Tandem Mass Spectrometry Using Free Software Tools
    DDA / label-free proteome identification and quantification context.
  4. Transformer-Based De Novo Peptide Sequencing for Data-Independent Acquisition Mass Spectrometry
    DIA-related computational proteomics context.
FAQ

Frequently Asked Questions

Q: What is shotgun proteomics drug effect analysis?

Shotgun proteomics drug effect analysis measures protein abundance changes after compound treatment. It helps compare treated and control samples, identify differential proteins, and interpret pathway-level proteome responses.

Q: How is this different from standard shotgun proteomics?

Standard shotgun proteomics often focuses on protein identification and quantification. This service is framed around drug-effect interpretation, including treatment comparisons, dose/time response, pathway enrichment, and follow-up planning.

Q: Can this service compare treated and control samples?

Yes. Treated vs control comparison is one of the most common study designs. We can help identify differential proteins, visualize group separation, and interpret enriched pathways.

Q: Can it compare multiple compounds, doses, or time points?

Yes. If your study includes a treatment matrix, we can compare compound-specific, dose-associated, or time-dependent proteome response patterns.

Q: Should I choose label-free, DIA, or TMT proteomics?

The choice depends on sample amount, number of groups, comparison design, and data goals. Label-free proteomics is flexible for broad discovery. DIA is useful for cross-sample quantitative consistency. TMT or multiplexed proteomics can be useful when the study design fits grouped labeling.

Q: Can shotgun proteomics support mechanism-of-action studies?

Yes. Shotgun proteomics can support mechanism hypotheses by showing which proteins, pathways, or functional modules change after treatment. It should be combined with follow-up validation when direct pathway or target confirmation is needed.

Q: Does differential protein abundance prove direct drug target binding?

No. Differential protein abundance is response evidence, not direct proof of target binding. Binding, occupancy, or selectivity questions require target engagement or binding-focused methods.

Q: What sample types can be submitted?

Common sample types include drug-treated cells, tissues, plasma, serum, cerebrospinal fluid, follicular fluid, lymph, synovial fluid, puncture fluid, ascites, saliva, tears, milk, culture supernatant, FFPE sections, and selected low-input samples when appropriate.

Q: What metadata should I provide for drug-treated samples?

Please provide sample ID, group name, compound code, vehicle, dose, exposure time, replicate ID, model type, sample type, collection method, storage condition, and any special treatment notes.

Q: What deliverables will I receive?

Typical deliverables include raw data where applicable, protein identification tables, protein quantification matrices, differential protein tables, QC summaries, statistical figures, pathway enrichment outputs, and interpretation notes.

Q: Can the results guide targeted validation or phosphoproteomics follow-up?

Yes. Discovery proteomics can help identify candidate proteins, pathways, or functional modules for targeted protein assays, phosphoproteomics, target engagement studies, or other follow-up experiments.

Q: Can proteomics data be integrated with metabolomics or lipidomics?

Yes. When matched samples are available, proteomics can be integrated with metabolomics, lipidomics, transcriptomics, or phenotype data to support broader drug-response interpretation.

Plan a Shotgun Proteomics Drug Effect Study

Share your compound, model, treatment groups, dose design, exposure time, sample type, and expected comparisons with our team. We will help you review whether label-free shotgun proteomics, DIA, TMT / multiplexed proteomics, or a follow-up strategy best fits your drug-effect question.

Disclaimer

For Research Use Only. This service is not intended for diagnostic procedures, medical decision-making, or therapeutic use.

Online Inquiry

Please submit a detailed description of your project. We will provide you with a customized project plan to meet your research requests. You can also send emails directly to for inquiries.

* Email
Phone
* Service & Products of Interest
Services Required and Project Description