Photo-Proximity Labeling Service: Spatial Proteomics with Light-Activated Precision

Some questions can only be answered in space and time. Capture them with light.

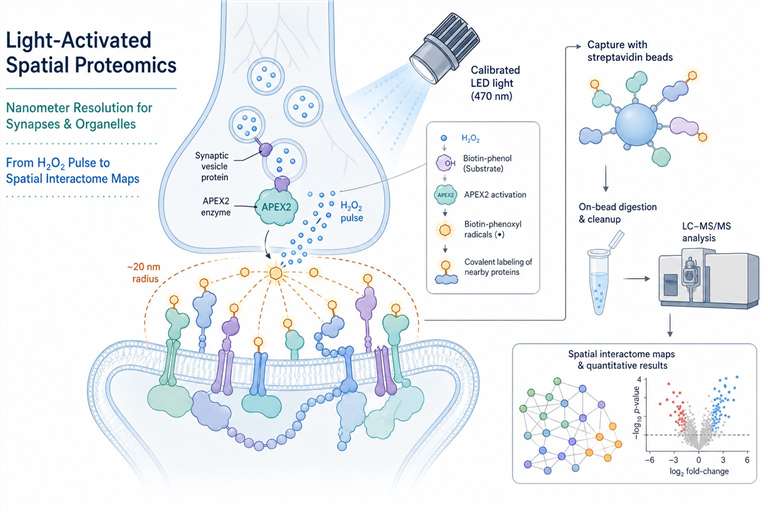
Our photo-proximity labeling service uses APEX/APEX2 enzymes for sub-second, nanometer-resolution spatial proteomics—ideal for synapses, organelle contact sites, and GPCR microdomains.

Integrated light activation, H₂O₂ pulse control, viability monitoring, and high-resolution mass spectrometry deliver publication-ready spatial interactome maps from your most precious samples.

Some questions can only be answered in space and time. Which proteins sit at the synaptic cleft when a vesicle fuses? What changes at the mitochondrial outer membrane during apoptosis? How does a GPCR rewire its neighborhood in the seconds after ligand binding?

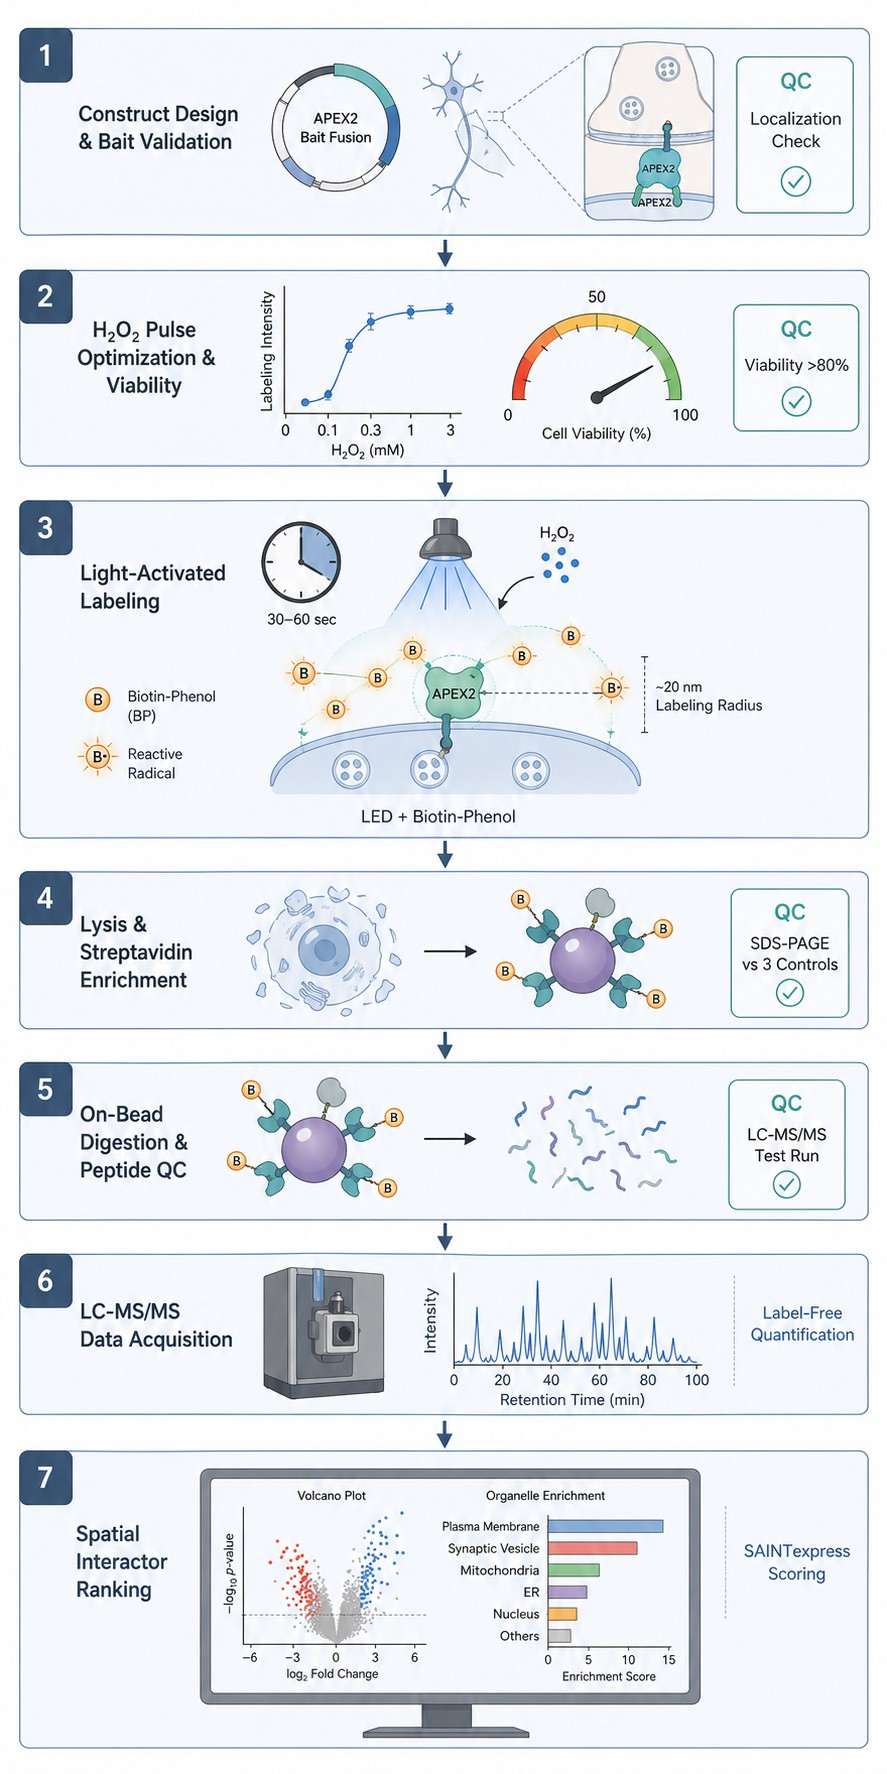
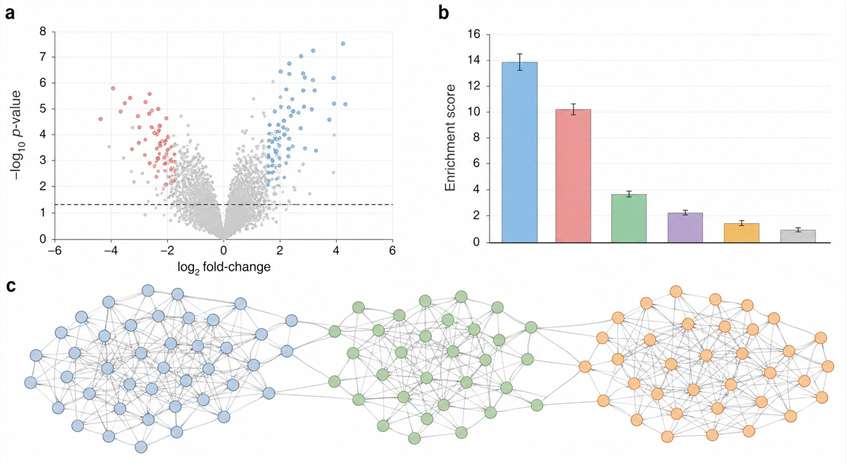
If your labeling window is hours—or even minutes—those answers blur. Photo-proximity labeling, powered by APEX and APEX2 enzymes, captures them in under a second, at nanometer resolution. We've built an integrated platform around this. Light source, H₂O₂ delivery, viability monitoring, mass spectrometry—all connected, all dialed in. What you get isn't just any list of proteins. It's a spatially resolved snapshot of your subcellular compartment, frozen at the exact moment you chose.

Key Advantages:

  • Sub-second, light-activated labeling precision
  • Nanometer spatial resolution for subcellular compartments
  • Integrated H₂O₂ pulse control and viability QC
  • Dedicated APEX/APEX2 platform and protocols
Photo-proximity labeling APEX spatial proteomics service

What Is Photo-Proximity Labeling and How It Enables Spatial Proteomics

Photo-proximity labeling uses engineered ascorbate peroxidase—APEX or its improved variant APEX2—fused to your protein of interest. You add biotin-phenol and a brief pulse of hydrogen peroxide. The enzyme instantly converts biotin-phenol into short-lived, reactive radicals that covalently tag everything within about 20 nanometers. Quench, lyse, pull down on streptavidin beads, and identify by mass spectrometry.

The difference from TurboID or BioID? Control. You decide exactly when labeling starts—by adding H₂O₂. You decide exactly when it stops—by quenching. The pulse lasts one second to one minute. Not ten minutes minimum. Not hours. That's the gap between "proteins somewhere near my bait" and "proteins that were right there when the receptor fired."

Where this matters most. Mapping the synaptic cleft proteome? APEX catches the proteins present during neurotransmission, not the ones that drifted in over the next hour. GPCR signaling microdomains? You see the interactome that assembled within seconds of agonist binding. Mitochondrial contact sites? You can tell outer membrane neighbors from inner membrane neighbors.

Our Photo-Proximity Labeling Service Advantage: Integrated Light Activation & Proven Protocols

Photo-proximity labeling takes more than a different enzyme in the same old workflow. It takes dedicated hardware and protocols. We've built and tested both.

  • An integrated workstation, not a pile of parts. Our APEX platform combines a calibrated LED source, precise H₂O₂ delivery, rapid quenching, and immediate lysis. No cobbling together equipment from different corners of the lab. Uniform activation. Every cell. Every time.
  • Viability you verify before the expensive steps. H₂O₂ is toxic. We don't pretend otherwise. Every project includes post-pulse viability monitoring. We titrate concentration and exposure time during a pilot to hit maximum labeling with minimum cell death. You see the numbers before we commit to deep MS runs.
  • Controls built for light, not borrowed from enzymes. Three matched controls come standard: no-light, no-H₂O₂, and BirA*-dead peroxidase or empty vector. Together they rule out endogenous biotinylation, H₂O₂ stress artifacts, and non-specific bead binding. No guessing what's real.
  • Precious samples? We treat them that way. Primary neurons, brain slices, in vivo tissue—routine for us. Protocols are optimized for low-input, high-value material. For tissue, we figure out H₂O₂ penetration depth during the pilot.
  • One scientist, start to finish. The same PhD-level scientist designs your experiment and interprets your data. No triage desk. No handoffs.

Photo-Proximity Labeling Experimental Workflow & Unique QC Checkpoints

Here's the path your samples take—and the moments we stop to verify quality.

1

Construct design and bait validation

No APEX fusion yet? We design and clone it. Once expressed in your cells, we confirm correct localization by microscopy or western blot. Wrong compartment? We fix it before labeling starts.

2

H₂O₂ pulse optimization and viability

We titrate H₂O₂ concentration and exposure time on your actual cell model. Labeling efficiency by streptavidin-HRP. Viability by trypan blue or MTT. We find the sweet spot—strong signal, healthy cells—and you approve it.

3

Light-activated labeling

Biotin-phenol is added. H₂O₂ is delivered under calibrated LED light for the optimized pulse—typically 30 to 60 seconds. Then quenched. Labeling happened only during that narrow window.

4

Lysis and streptavidin enrichment

Denaturing lysis. Streptavidin bead capture. Stringent washes. An aliquot on SDS-PAGE with streptavidin-HRP must show a pattern clearly distinct from all three controls. Or we don't proceed.

5

On-bead digestion and peptide QC

Reduction, alkylation, trypsin digestion directly on the beads. A quick LC-MS/MS run confirms complexity and chromatographic quality pass our thresholds. Anything off? We catch it here.

6

LC-MS/MS data acquisition

Nano-flow UPLC coupled to high-resolution MS in data-dependent acquisition. Label-free quantification across your light, no-light, and no-H₂O₂ conditions.

7

Spatial interactor ranking

Raw files searched against the appropriate database. Significantly enriched proteins called by comparing light-activated to no-light and no-H₂O₂ controls using SAINTexpress or equivalent. You get a ranked list of high-confidence, spatially restricted interactors.

Photo-proximity labeling APEX workflow diagram with H₂O₂ QC

Representative Photo-Proximity Labeling Proteomics Results

Here's what lands on your desk. This example compares an APEX2-tagged synaptic protein to the no-light control. Same formats apply regardless of your compartment.

APEX photo-proximity labeling demo results volcano plot and synaptic network

Differential enrichment volcano plot, organelle distribution, and spatial interaction network

1. Differential enrichment volcano plot. Each point is a protein. Log₂ fold-change on the x-axis, −log₁₀ p-value on the y-axis. Proteins passing your thresholds are color-coded. One glance tells you whether the compartment was cleanly labeled—and which candidates deserve validation.

2. Subcellular organelle distribution. Identified proteins are mapped to their annotated compartments—plasma membrane, synaptic vesicles, mitochondria, ER, nucleus. The bar chart confirms your enrichment is compartment-specific. Tagged a synaptic protein? Plasma membrane and synaptic vesicle bars should dominate. If nuclear proteins spike, something's off.

3. Spatial interaction network. High-confidence interactors as nodes, edges showing known or predicted associations. Clusters resolve into functional modules—neurotransmitter release, endocytic recycling, postsynaptic scaffold. That modular structure helps you prioritize hits embedded in the biology you care about.

Sample Submission Requirements for Photo-Proximity Labeling

Most projects start with a cell model you've already built. Here's what we need, with attention to the controls that photo-labeling requires.

Sample TypeRecommended InputSpecial HandlingShipping ConditionsQC CheckpointsNotes
Adherent or suspension cells (live)≥1×10⁷ cells per conditionH₂O₂-free medium for controlsDry ice (−80°C)Viability ≥90%; Mycoplasma‑freeInclude empty vector or parental control
Primary neurons (adherent)≥2×10⁶ cells per conditionH₂O₂-free medium; gentle lysisDry ice (−80°C)Viability >80% post-pulseInclude no-light and no-H₂O₂ controls
Brain slices / tissueContact usOptimize H₂O₂ penetrationDry ice (−80°C)Perfusion recommendedPilot study advised
Transfected cells (transient)≥1×10⁷ cellsConfirm expression by westernDry ice (−80°C)Biotin-phenol loading controlProvide plasmid map and sequence
Cell lysate (pre-labeled)≥500 µg total proteinInclude all controlsDry ice (−80°C)Pre‑test by streptavidin‑HRPProvide H₂O₂ pulse conditions

Got organoids? Xenograft tissue? In vivo labeled samples? Send us a note. We'll confirm feasibility in a quick consultation.

Bioinformatics Analysis & Data Deliverables

Core deliverables come standard. Add-ons are ready when your analysis pipeline needs more.

Included with every project:

  • Raw MS files (.raw and .mzML), downloadable from your secure portal
  • Protein identification and label-free quantification matrix (.csv or .xlsx)
  • List of significantly enriched proteins with fold-change, p-value, confidence score, and subcellular annotation
  • QC summary: post-H₂O₂ viability, streptavidin-HRP blot, enrichment gel, chromatographic quality metrics

Available as add-ons:

  • Cytoscape-ready spatial interaction networks and publication-quality figures
  • GO, KEGG, and Reactome pathway enrichment with downloadable tables
  • Subcellular organelle annotation (GO Cellular Component, MitoCarta)
  • Custom volcano plots, organelle maps, Venn diagrams
  • Extended statistics: SAINTexpress scoring, permutation-based FDR
  • A manuscript-ready methods section

All files through a secure portal. Raw data archived for at least 12 months. If you're validating interactors structurally, our cross-linking MS service provides complementary distance constraints.

Choosing the Right Proximity Labeling Strategy for Your Research Question

Not every enzyme fits every experiment. Here's the side-by-side—and our honest guidance.

FeatureBioIDBioID2TurboIDminiTurboAPEX/APEX2
Labeling time18–24 hours6–24 hours10–60 min10–60 min1 sec–1 min
Spatial resolution~10 nm~10 nm~10 nm~10 nm~20 nm (pulse-controlled)
Light activationNoNoNoNoYes (LED + H₂O₂)
Biotin substrateBiotinBiotinBiotinBiotinBiotin-phenol
Key advantageProven broadlyCompact; in vivoFast labelingFast + low backgroundSub-second; nanometer control
Best forGeneral mappingIn vivo, low toxicityCell lines, acute stimuliDynamic signaling, PROTACSynapses, contact sites, GPCR domains

Our honest take:

  • Sub-second, nanometer-resolution labeling for synapses or contact sites? APEX/APEX2. You control start and stop. Spatial precision unmatched for subcellular compartments.
  • Fast labeling, low background, no light gear? miniTurbo. Speed without the hardware.
  • Long-term in vivo? BioID2. Small enzyme, low biotin demand, gentle on the mouse.
  • Not sure? Describe your compartment in the inquiry form. We'll help you pick during the feasibility review.

Frequently Asked Questions

Q: How does APEX differ from TurboID or BioID?

APEX labeling is triggered by a brief H₂O₂ pulse under light—seconds, not hours. TurboID and BioID label continuously once biotin is added. APEX is the pick when you need to capture a specific moment in a specific subcellular compartment.

Q: What controls are essential?

Three: no-light (biotin-phenol present, H₂O₂ added, no light), no-H₂O₂ (light on, no H₂O₂), and bait-absent or dead enzyme. Together they distinguish real signal from endogenous biotinylation, stress artifacts, and bead background.

Q: Will H₂O₂ kill my primary neurons?

We optimize H₂O₂ concentration and exposure time during a pilot specifically for your cells. Viability is measured before and after. We find the condition that gives strong labeling while keeping viability above your threshold—typically above 80% for neurons. You approve it before we scale.

Q: What light source do you use?

A calibrated LED-based system integrated with our cell culture workstation. Uniform illumination, precise timing. Not ambient light. Not a desk lamp. Reproducibility demands control.

Q: Can you handle brain slices or in vivo tissue?

Yes, with a pilot. H₂O₂ penetration is the variable. We start small to determine optimal concentration and incubation time for your tissue type and thickness, then scale.

Case Study: APEX2 Resolves Spatiotemporally Distinct GPCR Interactome

Shchepinova, M. M., et al. (2024) bioRxiv, 10.1101/2024.06.14.599010

Background

GPCRs are the largest family of druggable targets, but their signaling defies a simple on/off model. Within seconds of agonist binding, the receptor reorganizes its protein neighborhood—recruiting G proteins, GRKs, and arrestins in a precise sequence. Capturing these transient, location-specific interactomes has been a persistent technical hurdle. Conventional methods lack either the temporal resolution to separate early from late events, or the spatial resolution to restrict analysis to the plasma membrane.

Methods

Shchepinova et al. (2024, bioRxiv) fused APEX2 to the angiotensin II type 1 receptor (AT1R) and expressed it in HEK293 cells. After agonist stimulation, a 30-second H₂O₂ pulse activated APEX2 at defined time points—0, 2, 5, 10, and 30 minutes post-agonist. This generated five temporally distinct snapshots of the AT1R proximal proteome. Biotinylated proteins were enriched on streptavidin beads and identified by quantitative mass spectrometry. No-agonist and no-H₂O₂ controls filtered background.

Results

The time-resolved screen identified over 300 high-confidence proximity interactors, with distinct clusters at each time point (see Figure 1 of the original paper). The first 2 minutes were dominated by G proteins and GRKs—the canonical mediators of early signal transduction. By 5–10 minutes, arrestins, clathrin adaptors, and endocytic machinery took over, marking the receptor's shift from signaling to internalization. At 30 minutes, a novel phosphatase appeared exclusively, hinting at a previously unappreciated dephosphorylation mechanism.

Conclusion

This study shows what APEX2 uniquely delivers: the temporal architecture of GPCR signaling, resolved with second-scale precision and nanometer spatial restriction. Slower enzymes would have averaged these dynamics into a single, uninformative snapshot. For any drug discovery program targeting receptors with complex spatiotemporal behavior, this approach reveals not just who interacts—but when and where. That's the depth of mechanistic insight our photo-proximity labeling service is built to produce.

APEX2 GPCR interactome spatiotemporal mapping plasma membrane

Figure 3. APEX2 resolves spatiotemporally distinct GPCR interactome at the plasma membrane. (Adapted from Shchepinova et al., 2024, bioRxiv, CC BY 4.0)

Disclaimer: Creative Proteomics services are for research use only. They are not intended for clinical diagnostic or therapeutic purposes.

Online Inquiry

Please submit a detailed description of your project. We will provide you with a customized project plan to meet your research requests. You can also send emails directly to for inquiries.

* Email
Phone
* Service & Products of Interest
Services Required and Project Description