AP-MS and Proximity Labeling Interactomics Service for Drug Discovery

Identify who your target protein talks to — stably, transiently, and inside living cells.

Protein–protein interactions (PPIs) govern virtually every biological pathway, and the protein complexes around a drug target define its mechanism, off-target risk, and resistance potential. Affinity purification–mass spectrometry (AP-MS) and proximity labeling proteomics are the two primary MS-based approaches for mapping these interaction networks at system scale — capturing stable complex members through AP-MS and transient or spatially proximal partners through engineered enzymes such as TurboID and APEX2.

At Creative Proteomics, our interactomics service covers the full workflow: bait design consultation, cell model selection, pull-down or proximity labeling execution, quantitative LC-MS/MS data acquisition, and statistically controlled interaction scoring via SAINT or MiST — delivering a ranked, confidence-stratified protein interaction network alongside pathway and functional annotation. Whether your question is "what does this kinase recruit when phosphorylated?", "which proteins bind this GPCR at the plasma membrane?", or "how does drug treatment remodel the interaction landscape around my target?", we translate the pull-down into interpretable biology.

  • AP-MS for stable protein complex mapping: co-IP, GFP-trap, FLAG/HA tag pull-down with quantitative label-free or TMT-based scoring.
  • Proximity labeling (TurboID / APEX2 / BioID2) for transient and spatially resolved interactome mapping in living cells.
  • Comparative interactomics: drug-treated vs control, WT vs mutant, time-resolved interaction dynamics.
  • SAINT/MiST statistical scoring with CRAPome-based background subtraction; deliverable network in Cytoscape-compatible format.
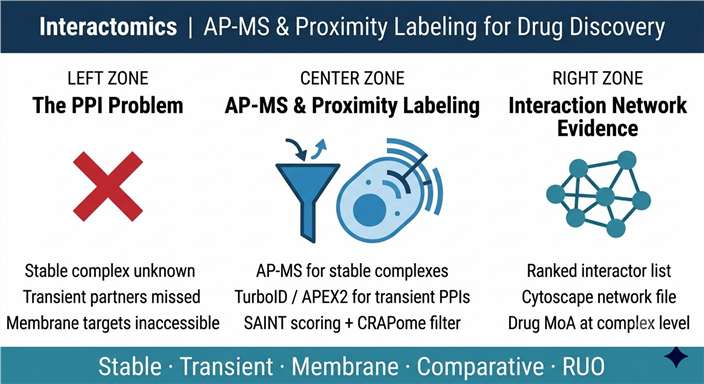
AP-MS and proximity labeling interactomics service overview: three-zone diagram showing drug target bait protein input, AP-MS pull-down plus TurboID proximity labeling, and quantitative protein interaction network output with SAINT scoring for drug discovery.
What Is Interactomics Service Overview Tech Comparison Sample Demo Case Study FAQ

What Interactomics Measures — and Why the Interaction Network Matters for Drug Discovery

The interactome is the complete set of protein–protein interactions within a biological system at a given time and condition. No protein acts alone: enzymes function within complexes, transcription factors assemble on regulatory scaffolds, receptors recruit intracellular signalling partners upon ligand binding, and almost every pathway step involves transient docking between proteins whose interaction geometry determines signal magnitude and specificity. When a drug modulates a target, it does not simply turn a protein on or off — it reshapes the protein's interaction landscape, displacing some partners, recruiting others, and propagating those changes through the network.

For drug discovery, the interaction network around a target provides several categories of actionable information. It reveals which co-complex members are required for target function — and therefore which are themselves druggable. It exposes protein–protein interaction interfaces that can be targeted by small molecules or peptide mimetics as an alternative to enzymatic active sites. It identifies potential resistance nodes: proteins that bypass the target's function when the target is inhibited. And it provides a molecular-level explanation for phenotypic observations — why does this compound cause an unexpected cellular response that a simple binding assay could not have predicted?

MS-based interactomics generates this information at the proteome scale. Rather than testing one interaction at a time, AP-MS and proximity labeling capture hundreds of potential partners simultaneously, rank them by statistical confidence, and deliver a network that can be interrogated computationally for pathway membership, disease relevance, and druggability. Combined with orthogonal structural methods such as HDX-MS epitope mapping for binding site localisation, the interactome defines not just who binds the target, but where and under what conditions.

Three Interactomics Questions We Help Drug Discovery Teams Answer

Who constitutes the endogenous protein complex around my target?

AP-MS under near-physiological lysis conditions captures stable co-complex members — the proteins that assemble with your bait in the cell's natural context. This defines the functional unit: subunit stoichiometry, required co-factors, and associated regulatory proteins that collectively determine the target's activity state.

Which transient partners does my target recruit in response to a stimulus or drug?

Many signalling interactions are too short-lived for conventional pull-down to capture. Proximity labeling biotinylates proteins within a ~10 nm radius of the bait inside living cells at a defined time point — preserving the chemical record of transient encounters that are lost during cell lysis and washing. This is the method of choice for receptor signalling complexes, kinase substrate networks, and stimulus-dependent scaffolding events.

How does drug treatment change the interaction landscape around my target?

Comparative interactomics — treated vs control, WT vs mutant bait, or compound A vs compound B — uses quantitative MS to measure differential interaction abundance across conditions. Proteins that are displaced or recruited by drug treatment reveal the molecular mechanism of action, explain functional phenotypes, and nominate resistance nodes for combination targeting. This application integrates naturally with our pharmaco-proteomics platform when whole-proteome drug response data is also needed.

Where in the cell does my target interact, and with which membrane-proximal partners?

Membrane proteins — GPCRs, ion channels, receptor tyrosine kinases — are notoriously difficult to study by classical Co-IP because detergent extraction disrupts their native interaction context. Proximity labeling applied before cell lysis captures the membrane-proximal proteome in situ, enabling interactome mapping of targets that are inaccessible to conventional pull-down approaches. For PPI interfaces at the structural level, complementary approaches such as LiP-MS can localise drug-induced accessibility changes.

Service Overview — AP-MS and Proximity Labeling Workflows

We offer four interactomics workflows, each designed around a specific type of interaction and experimental context. All workflows use quantitative MS readouts and include computational false-positive control as a standard deliverable component. For studies combining interactomics with chemical probe enrichment, our activity-based protein profiling (ABPP) and photoaffinity labeling MS platforms provide complementary covalent-capture workflows for probe-reactive protein identification alongside interaction network data.

WORKFLOW 1

AP-MS for Stable Protein Complex Mapping

Classical affinity purification coupled to quantitative LC-MS/MS. Bait proteins are immunoprecipitated via antibody, GFP-trap, or epitope-tag pull-down (FLAG, HA, His, Strep) under mild lysis conditions, with co-purifying prey proteins identified and quantified across biological replicates and matched controls.

  • Quantification options: label-free (LFQ), TMT multiplexing, or SILAC for treated vs control comparisons.
  • Statistical scoring: SAINT (Significance Analysis of INTeractome) or MiST scoring with CRAPome database-informed background subtraction.
  • Compatible with endogenously tagged cell lines and overexpression constructs; GFP-trap pull-down from fluorescently tagged cells.
  • Biological triplicates minimum; supports comparative design (e.g. drug-treated vs DMSO, WT vs phosphomutant).
WORKFLOW 2

TurboID / BioID2 Proximity Labeling Interactomics

The bait protein is fused to an engineered biotin ligase (TurboID, preferred for its fast kinetics; BioID2 for lower background in certain contexts). Biotin is supplied to living cells for a defined labeling window (TurboID: 10–60 min; BioID2: 12–24 h), after which biotinylated proximal proteins are captured with streptavidin beads and identified by LC-MS/MS.

  • Captures transient and weak interactions within ~10 nm of the bait that are lost during conventional lysis/washing.
  • Compatible with nuclear, cytoplasmic, organelle-localised, and membrane-tethered bait proteins.
  • Temporal resolution achievable with TurboID by varying labeling window.
  • Bait construct design consultation included; we provide recommended expression vector architecture and integration strategy for each cell line.
WORKFLOW 3

APEX2 Proximity Labeling for Organelle and Membrane Interactomics

APEX2 (ascorbate peroxidase 2) generates biotin-phenoxyl radicals upon H₂O₂ treatment, labeling proximal proteins within a ~20 nm radius in under 1 minute. Its speed enables subcellular-resolution snapshots of the interaction environment with minimal perturbation of cell physiology.

  • Labeling time: 1 minute — ideal for capturing stimulus-dependent interactions at precise time points.
  • Preferred for membrane receptor interactomics (including GPCRs), mitochondrial outer membrane proteomics, and ER-localised interaction mapping.
  • Compatible with H₂O₂-sensitive experimental contexts when combined with appropriate peroxide dose titration.
  • Supports cell-surface-specific labeling without detergent lysis — preserving native membrane receptor interaction geometry.
WORKFLOW 4

Comparative Interactomics for Drug MoA and Target Engagement

Either AP-MS or proximity labeling is run in a quantitative comparative design — drug-treated vs vehicle control, agonist vs antagonist, WT bait vs mutant lacking a key interface — with TMT multiplexing or SILAC to achieve precise inter-condition ratio quantification across all detected prey proteins.

  • Identifies proteins recruited or displaced by drug treatment: direct MoA evidence at the interaction level.
  • Supports dose-response interactome profiling across multiple compound concentrations.
  • Reveals how post-translational modification state of the bait (phosphorylated vs unphosphorylated, ubiquitinated vs baseline) reshapes the interaction network.
  • Data integrates with thermal proteome profiling (TPP) and cell-based engagement assays for a multi-evidence target engagement package. See also our cell-based MS drug screening platform for broader cellular drug response characterisation.

Analytical Workflow

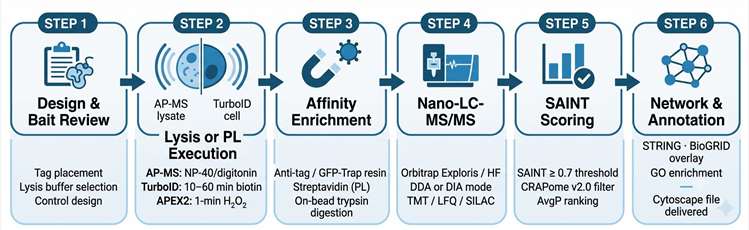
Six stages from experimental design consultation to network deliverable:

1

Experimental design and bait construct review

Before any sample processing, our team reviews the bait protein's biology, known interaction partners, cellular localisation, and expression system. We confirm tag placement (N-terminal vs C-terminal, length, linker), lysis buffer composition relative to the bait's membrane association, replicate structure, and choice of control (empty vector, cytosolic enzyme-only, parental cell line). These decisions define data quality ceiling — and are the most common source of failed interactomics experiments when skipped.

2

Cell lysate preparation or proximity labeling execution

For AP-MS: cells expressing the tagged bait are lysed under optimised ionic strength and detergent conditions (NP-40 or digitonin for membrane proteins; HEPES-based buffers for nuclear complexes). For proximity labeling: biotin or biotin-phenol is supplied at the defined concentration and labeling window; cells are then lysed under denaturing conditions (1% SDS) to ensure complete biotinylated protein recovery. Both workflows include matched negative controls processed in parallel throughout the entire protocol.

3

Affinity enrichment and on-bead digestion

Bait-interacting proteins are captured on resin (anti-GFP magnetic beads, anti-FLAG M2 resin, streptavidin beads for biotinylated proteins). After stringent washing to remove non-specific binders, proteins are digested on-bead with trypsin (LysC pre-digestion for high-molecular-weight complexes). Peptide eluates are desalted by C18 StageTips before LC injection.

4

Quantitative LC-MS/MS data acquisition

Peptides are analysed by nano-LC-MS/MS on Orbitrap-based instruments in DDA or DIA mode depending on sample complexity and quantification strategy. For TMT experiments, a combined fraction pooling strategy maximises proteome coverage across the multiplex set. Each batch includes a system suitability standard injection at defined intervals to monitor instrument performance consistency across a replicate series.

5

SAINT / MiST scoring and false-positive control

Protein spectral counts or intensities from bait pull-downs are scored against the matched controls using SAINT (Significance Analysis of INTeractome) software. Background contaminants are further filtered using the CRAPome database (Contaminant Repository for Affinity Purification), which aggregates non-specific interactors from hundreds of published AP-MS experiments to build a frequency-based exclusion prior. Interactions passing user-defined SAINT score ≥ 0.7 and AvgP thresholds are retained as high-confidence interactors.

6

Network construction and biological annotation

High-confidence interactors are mapped onto protein–protein interaction reference databases (STRING, BioGRID) and annotated with GO biological process, molecular function, and cellular component terms. Cytoscape network files are generated with node attributes (protein name, gene name, SAINT score, spectral count) and edge attributes (interaction confidence). A written interpretation report highlights pathway clusters enriched among interactors, known vs novel interactions, and drug-relevant network features.

Interactomics AP-MS and proximity labeling workflow: experimental design and bait construct review, cell lysate preparation or TurboID/APEX2 proximity labeling, affinity enrichment and on-bead digestion, quantitative LC-MS/MS acquisition, SAINT scoring and CRAPome background subtraction, protein interaction network construction and biological annotation.

Applications in Drug Discovery and Chemical Biology

Target Deconvolution via Interaction Network Context

When a compound produces a phenotype but the molecular target is unclear, the interaction network of candidate targets provides mechanistic hypotheses. If a compound's phenotype matches disruption of a known complex captured by AP-MS of the candidate bait, this constitutes target-consistent evidence without requiring direct binding measurement.

Interactomics delivers: co-complex partners of candidate targets ranked by confidence; comparison of interactomes across cell lines responsive and non-responsive to compound; network features that distinguish mechanism-relevant from bystander interactions.

PPI-Targeted Drug Discovery — Identifying the Interface

Protein–protein interfaces are increasingly recognised as druggable sites. AP-MS of the target in its complex state defines which protein surfaces are engaged — and a competition experiment, where compound displaces a known partner, confirms the interface is accessible to small molecules.

Interactomics delivers: ranked partner list with interaction abundance; displacement assay design input for competition pull-down experiments; protein interaction interface candidates for structural follow-up by chemoproteomics or HDX-MS.

GPCR and Membrane Receptor Signalling Complex Mapping

G-protein-coupled receptors recruit different intracellular partners depending on ligand identity, ligand bias, and trafficking state — differences invisible to biochemical assays but distinct at the interactome level. APEX2 proximity labeling applied before lysis maps the receptor's native membrane-proximal signalling complex.

Interactomics delivers: plasma-membrane-resolved interaction landscape of the receptor under agonist, antagonist, or biased ligand treatment; comparison of β-arrestin-biased vs G-protein-biased interaction signatures; novel co-receptor and scaffold candidate identification.

Drug Resistance Mechanism — Interaction-Level Evidence

Resistance-associated bypass often involves recruitment of alternative interactors that compensate for the inhibited target. Comparative interactomics between sensitive and resistant cells maps the interaction landscape differences that underlie the resistance phenotype, at the protein-complex level.

Interactomics delivers: proteins differentially recruited to the target's complex in resistant vs sensitive cells; bypass pathway candidates for combination targeting; interaction changes that precede functional resistance — detectable before phenotypic resistance is measurable.

E3 Ligase and Degrader Biology — Ternary Complex Characterisation

PROTAC and molecular glue degraders function by inducing or stabilising ternary complexes between a target protein and an E3 ligase. AP-MS of the target or ligase under degrader treatment maps the induced complex components, confirms ternary complex formation, and identifies neo-substrate recruitment specificity across the target's interaction space.

Interactomics delivers: ternary complex composition under degrader vs control conditions; E3 ligase substrate landscape changes; collateral ubiquitination targets identified from interaction-level data; supports combination with our reactive residue profiling for covalent degrader warhead site validation.

Oncology — Transcription Factor and Epigenetic Complex Mapping

Transcription factors and epigenetic regulators (BRD4, HDAC complexes, polycomb components) are key oncology targets that act within large chromatin-associated assemblies. AP-MS of these targets under small-molecule treatment reveals which complex members are disrupted or retained, providing mechanistic evidence for transcriptional drug effects at the complex level.

Interactomics delivers: chromatin-associated complex composition under inhibitor treatment; co-activator and co-repressor displacement profiling; comparison of PROTAC vs catalytic inhibitor effects on complex stability; integrates with multi-omics outputs from our multi-omics integration platform.

Technology Comparison: AP-MS vs Proximity Labeling vs Alternative PPI Methods

MethodInteraction Type CapturedCell Viability Required?Membrane Proteins?Quantitative?Best Application in Drug Discovery
AP-MS (this service)Stable co-complex interactions; direct and indirect binders of baitNo — works with cell lysatePartial — limited by detergent extraction✅ LFQ, TMT, SILAC; SAINT scoringStable complex composition, stoichiometry, comparative interactomics under drug treatment
TurboID Proximity Labeling (this service)Transient + stable interactions within ~10 nm; spatially proximal proteinsYes — labeling in living cells✅ Yes — membrane-proximal labeling without lysis✅ TMT or LFQ; temporal control via labeling windowTransient signalling interactions; receptor signalling complexes; organelle-resolved proteomes
APEX2 Proximity Labeling (this service)Transient + stable within ~20 nm; 1-minute labeling snapshotsYes — labeling in living cells✅ Yes — native cell-surface labeling; no lysis needed✅ LFQ or TMT across conditionsGPCR/RTK membrane interactomics; stimulus-dependent interaction snapshots; subcellular compartment proteomics
Yeast Two-Hybrid (Y2H)Direct binary PPIs only; tested in yeast nucleusYeast model required❌ Not suitable for membrane proteins❌ Qualitative onlyLarge-scale binary interaction screens; library-vs-library format; generates hypotheses requiring MS validation
Native MS (intact complex)Stable complexes in native solution state; stoichiometry + massNo — purified complex requiredPartial — requires compatible detergent or membrane-mimetic✅ Stoichiometry from charge state distributionDefined complex stoichiometry; ligand binding to intact assembly. See our native ESI-MS service for intact complex analysis.
Cross-Linking MS (XL-MS)Distance-constrained interactions; residue-level interface mappingNo — works with lysate or purified complexPartial✅ Quantitative XL-MS availableStructural restraints for protein complex modelling; PPI interface localisation; orthogonal to AP-MS network data. See our thermal stability profiling for complementary target engagement evidence.

Instrumentation and Bioinformatics

ComponentPlatformRole in Interactomics
Nano-LCUltiMate 3000 nanoUHPLC (Thermo Fisher)High-sensitivity peptide separation from low-input pull-down eluates; compatible with in-solution and on-bead digestion products
High-Resolution MSQ Exactive HF Orbitrap; Orbitrap Exploris 480Deep proteome coverage in DDA and DIA modes; accurate mass peptide identification across complex pull-down backgrounds
Database SearchMaxQuant / Proteome Discoverer / SpectronautLFQ, TMT, and SILAC quantification; protein grouping and razor peptide assignment; iBAQ for stoichiometry estimation
Interaction ScoringSAINT (saint-apms.sourceforge.io) + CRAPome v2.0Probabilistic false-positive control using spectral count or intensity across bait vs control replicates; CRAPome background prior
Network AnalysisCytoscape + STRING + BioGRID integrationProtein interaction network visualisation; GO enrichment; known vs novel interaction classification; Cytoscape session files delivered

Sample and Cell Model Requirements

WorkflowCell InputMinimum per ReplicateRequired Constructs / ReagentsCritical Notes
AP-MS (tag pull-down)Stable or transient expressing cell lines; endogenous IP via antibody≥ 5 × 10⁷ cells per replicate (for low-abundance baits: up to 2 × 10⁸)Expression construct with validated tag; anti-tag antibody or resin; matched control (empty vector or parental cell line)Bait expression level should be at or near endogenous to minimise overexpression artefacts; verify bait functional integrity before submission; lysis buffer selection discussed with our team in advance
GFP-Trap AP-MSGFP- or fluorescent protein-tagged stable cell lines≥ 2 × 10⁷ cells per replicateGFP-tagged bait cell line + matched GFP-only control cell lineGFP-only control is mandatory — do NOT substitute unrelated pull-down; tag must be accessible for GFP-Trap resin; validate localisation by fluorescence microscopy before project start
TurboID Proximity LabelingStably expressing TurboID-bait fusion cell lines≥ 1 × 10⁷ cells per replicate (streptavidin enrichment is highly efficient)Stably integrated TurboID-bait construct (Tet-inducible preferred to control expression level); biotin (500 µM working concentration); streptavidin magnetic beadsBiotin labeling performed in our facility or by customer with provided protocol; TurboID-only (no bait) control is mandatory; coordinate biotin treatment timing with our team before cell shipping
APEX2 Proximity LabelingAPEX2-bait fusion cell lines; compatible with HEK293T, HeLa, primary cells≥ 1 × 10⁷ cells per replicateAPEX2-bait stable or transient expression; biotin-phenol; H₂O₂ for 1-min activation; APEX2-only controlH₂O₂ concentration and exposure time must be precisely controlled — variability here is the primary source of APEX2 experimental failure; contact our team for the optimised protocol before performing labeling independently
Comparative Interactomics (drug treatment)Any of the above, with additional drug-treated armAs above per replicate; ≥ 3 biological replicates per conditionDrug dissolved in DMSO to appropriate concentration; matched DMSO vehicle control at same volume fractionTreat cells for the time period at which interaction change is expected based on mechanistic knowledge; confirm bait expression level is unchanged between drug and vehicle conditions before shipping; do not pool replicates

All workflows require a minimum of three biological replicates per condition for SAINT scoring to be statistically meaningful. Samples can be shipped as frozen cell pellets (snap-frozen in liquid nitrogen, stored at −80°C, shipped on dry ice) after washing 2× with ice-cold PBS — do not freeze cells in culture medium. For cell lines that cannot be frozen without affecting pull-down efficiency, live cells can be shipped in appropriate transport medium after coordination with our team.

Deliverables

  • Full protein identification table: all detected prey proteins with spectral counts, LFQ intensities, SAINT scores, AvgP, and fold-enrichment over control across all replicates
  • High-confidence interactor list: proteins passing SAINT ≥ 0.7 and AvgP thresholds, annotated with gene name, UniProt accession, GO terms, and CRAPome frequency score
  • Cytoscape network session file: nodes (proteins) and edges (interactions) with quantitative attributes; STRING and BioGRID reference edge overlay
  • GO biological process, molecular function, and cellular component enrichment: enrichment analysis of high-confidence interactors; top 10 enriched terms per category with adjusted p-values
  • For comparative experiments: volcano plot of log₂ fold-change vs −log₁₀ p-value across drug vs control conditions; list of significantly enriched or depleted interactors
  • QC report: bait protein identification confirmation, spectral count distribution across replicates, principal component analysis of replicate reproducibility, background contaminant frequency check
  • Raw data files: .raw MS files, MaxQuant/PD output tables, and SAINT input/output files
  • Written interpretation report: description of high-confidence interactor biology, pathway cluster analysis, known vs novel interaction classification, and drug-relevant network observations

Representative Results

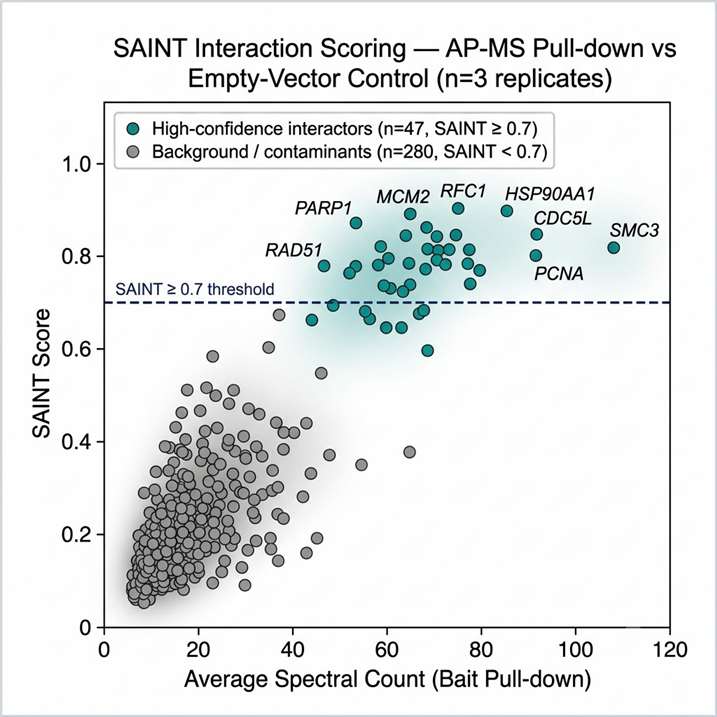
SAINT interaction scoring scatter plot from AP-MS interactomics experiment: x-axis shows average spectral count across replicates, y-axis shows SAINT score, high-confidence interactors above 0.7 threshold shown in teal, background contaminants below threshold in grey, with selected high-confidence interactors labelled by gene name.

SAINT scoring: high-confidence interaction ranking from AP-MS data

SAINT score vs average spectral count for all prey proteins detected across three biological replicates of bait pull-down vs matched empty-vector control (n=3/condition). Teal points: SAINT ≥ 0.7 (high-confidence interactors, n=47); grey: sub-threshold background. Selected interactors labelled by gene name. CRAPome-filtered contaminants removed before scoring.

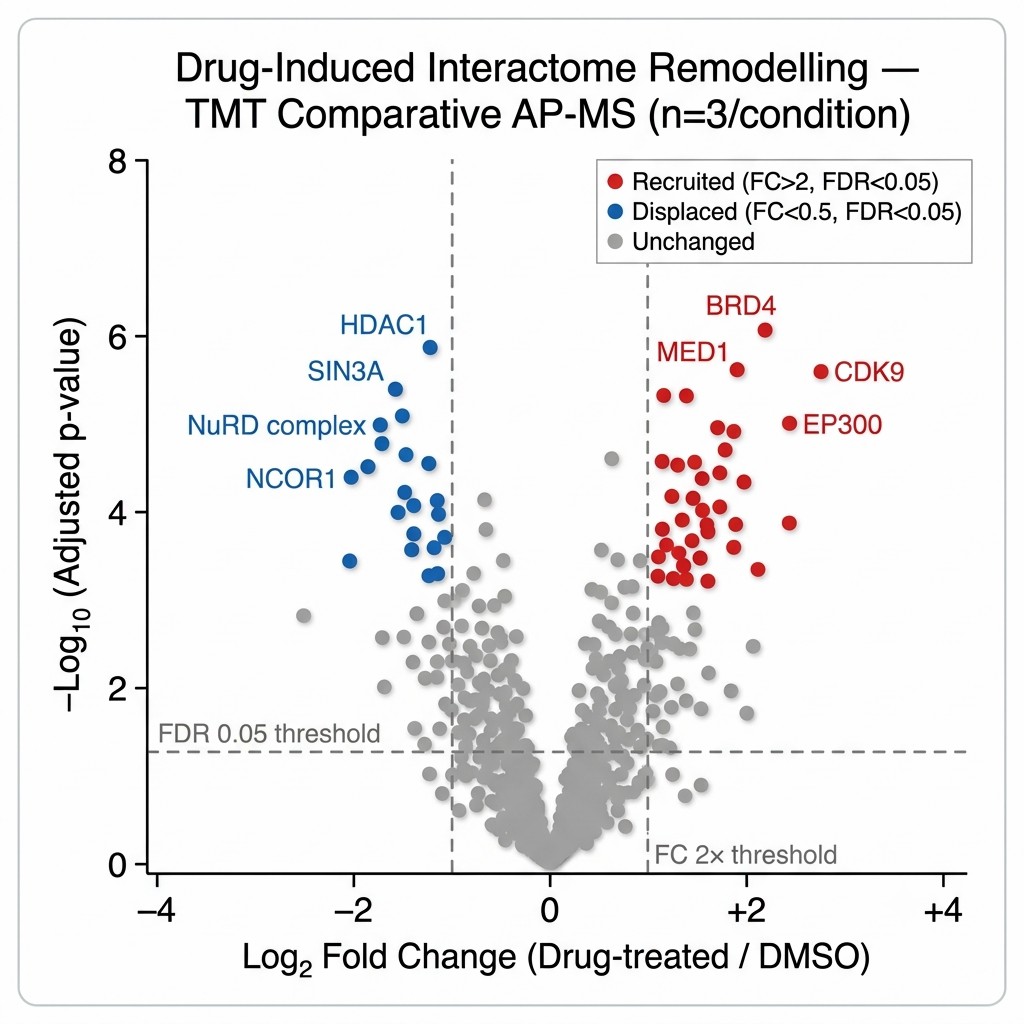
Comparative interactomics volcano plot from AP-MS drug treatment experiment: x-axis shows log2 fold-change of interactor abundance drug vs DMSO, y-axis shows minus log10 adjusted p-value, significantly enriched interactors in red, significantly depleted in blue, unchanged in grey, with annotated protein names for key interactors.

Comparative interactomics: drug-induced interaction landscape remodelling

Volcano plot of interactor fold-change (log₂, drug-treated / DMSO vehicle) vs significance (−log₁₀ adjusted p-value) across n=3 biological replicates per condition, TMT-based quantification. Red: significantly enriched interactors (FC ≥ 2, FDR < 0.05); blue: significantly depleted; grey: unchanged. Labelled proteins represent interaction changes directly relevant to compound MoA interpretation.

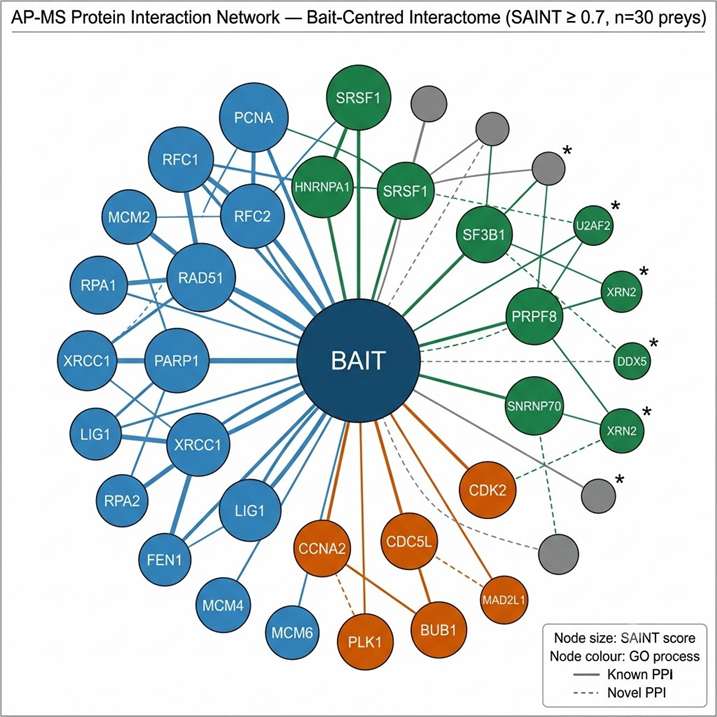
Protein interaction network from AP-MS interactomics: central node represents bait protein, surrounding nodes are high-confidence SAINT-scored interactors, node colour represents GO biological process category, edge thickness represents SAINT score confidence, network visualised in Cytoscape with STRING reference edges shown as dashed lines.

Protein interaction network: bait-centred interactome with GO pathway annotation

Cytoscape network of high-confidence AP-MS interactors (SAINT ≥ 0.7, n=47 prey proteins). Central node: bait protein. Node colour: GO biological process category (blue: DNA replication; green: RNA processing; orange: cell cycle regulation; grey: other). Edge thickness: SAINT score. Dashed edges: STRING reference interactions (combined score ≥ 0.7). Novel interactions (no STRING edge) highlighted with asterisk.

Case Study: Combined AP-MS and Proximity Labeling Achieves 4.07-Fold Specificity Improvement — Including In-Situ Mapping of GLP-1 Receptor Complexes

Luo S., Xie L., Yang L., Hu Z., Wang L., Wang Y., Li Q., Guo S., Tao S., Jiang H. "Sensitive and specific affinity purification-mass spectrometry assisted by PafA-mediated proximity labeling." Cell Reports Methods 2025;5:101166. https://doi.org/10.1016/j.crmeth.2025.101166

Scientific Challenge

AP-MS is the workhorse of protein interactomics, but two persistent limitations constrain its use in drug discovery: high non-specific binding that inflates false-positive interaction lists, and the inability to capture weak, transient, or cell-surface interactions that are lost during cell lysis and stringent washing. Membrane receptor interactomics — mapping the signalling complex around a GPCR, for example — is particularly affected because detergent extraction disrupts the native membrane context that governs receptor–effector recruitment. The researchers at Shanghai Jiao Tong University developed APPLE-MS (Affinity Purification coupled Proximity LabEling–Mass Spectrometry), combining the high specificity of Twin-Strep-tag enrichment with PafA-mediated proximity labeling, to address these limitations simultaneously.

Methods

APPLE-MS was benchmarked against standard AP-MS across three biological targets in HEK293T and INS-1E cells. Twin-Strep-tag enrichment provides the affinity purification specificity layer, while PafA-mediated covalent biotinylation of proximal proteins captures interactions within the native cellular environment. The method was applied to: (1) SARS-CoV-2 ORF9B, profiling its dynamic mitochondrial interactome during antiviral response across multiple time points; (2) endogenous PIN1, a prolyl-isomerase implicated in signalling regulation, using APPLE-MS versus standard AP-MS side-by-side; and (3) GLP-1 receptor (GLP-1R), a drug target of major therapeutic interest, enabling in situ mapping of its membrane-proximal complex without cell lysis.

Key Results

APPLE-MS achieved a 4.07-fold improvement in specificity over standard AP-MS, as measured by the ratio of true interactors (database-validated) to total identified proteins. For SARS-CoV-2 ORF9B, the method revealed a time-resolved mitochondrial interactome during poly(I:C)-induced antiviral responses, identifying dynamic interactions with metabolic regulators (including TUFM) and immune modulators (including RNF123) — providing mechanistic insight into how ORF9B reprogrammes host metabolism during infection. For endogenous PIN1, APPLE-MS uncovered novel roles in DNA replication stress responses and RNA processing, identifying associations with the MCM complex and RFC1 that extend PIN1's known function beyond canonical prolyl-isomerase activity. Critically, APPLE-MS enabled in situ mapping of GLP-1R membrane complexes in HEK293T and INS-1E cells — identifying canonical and previously uncharacterised co-receptors and signalling components — demonstrating that the method can access interaction networks at the cell surface that are invisible to conventional AP-MS.

Significance for Interactomics Drug Discovery Services

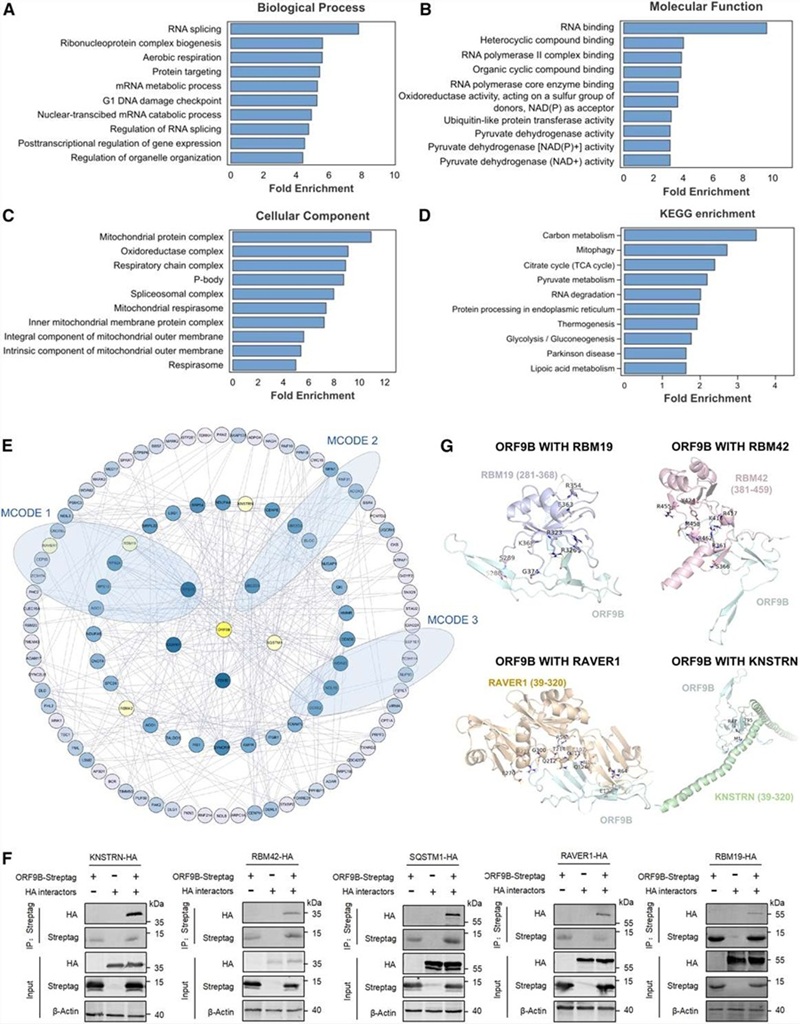
This study demonstrates three capabilities directly relevant to pharmaceutical interactomics: the specificity improvement addresses the false-positive problem that has historically limited AP-MS utility in lead optimisation; the GLP-1R application demonstrates that membrane receptor signalling complexes — a major class of drug targets — are now mappable by proximity-labeling interactomics; and the time-resolved ORF9B profiling shows that dynamic, drug-relevant interaction changes can be captured with temporal resolution. Figure 2 of the paper directly compares APPLE-MS versus standard AP-MS specificity, providing a quantitative benchmark for the method's performance advantage.

Figure 2 from Luo et al. 2025, Cell Reports Methods, showing APPLE-MS versus standard AP-MS specificity comparison with 4.07-fold improvement, and in-situ GLP-1 receptor complex mapping data from HEK293T cells.

Figure 2 from Luo et al. 2025 (Cell Reports Methods, DOI: 10.1016/j.crmeth.2025.101166, PMC12539243). Direct APPLE-MS vs AP-MS specificity comparison demonstrating 4.07-fold improvement. CC BY 4.0.

FAQ

Frequently Asked Questions

Q: What is the difference between AP-MS and proximity labeling, and how do I choose between them?

AP-MS captures proteins that co-purify with your bait under lysis conditions — it excels at stable co-complex members (proteins present in the same molecular assembly) and is technically accessible without genetic engineering beyond the tag. Proximity labeling captures proteins within spatial range of the bait inside living cells, regardless of whether they directly bind the bait, and is not limited by what survives lysis and washing — making it the method of choice for transient interactions, membrane receptor signalling partners, and interactions that require native cellular context. For most drug discovery interactomics projects, AP-MS is the starting point; proximity labeling is added when initial AP-MS data is interpreted as incomplete for the biological context (e.g. a GPCR or a kinase whose substrate interactions are transient). Many productive interactomics programmes use both in parallel for the same bait and cross-reference the combined dataset.

Q: How do you control for non-specific binding — the CRAPome problem — in AP-MS?

Non-specific binding is the defining challenge of AP-MS. Our standard approach combines three layers of control. First, every pull-down is run with a matched negative control (empty vector, cytosolic tag only, or parental cell line) processed identically in parallel — not from a different experiment or historical dataset. Second, SAINT statistical scoring uses spectral counts or intensities from these paired bait vs control replicates to compute a probabilistic true-interaction score; we apply a SAINT score ≥ 0.7 cutoff as a default threshold. Third, we cross-reference retained interactors against the CRAPome database (version 2.0), which catalogues non-specific binders appearing in more than 50–70% of published AP-MS experiments — proteins above that frequency threshold are flagged and excluded from the high-confidence interactor list unless supported by additional evidence. The combination of these three layers typically reduces the raw prey list by 60–80%, producing a high-confidence interactor set with substantially reduced false-positive rates compared to fold-change-only filtering.

Q: Can interactomics be used to study membrane protein targets — GPCRs, ion channels, RTKs?

Yes — but the choice of workflow matters critically. Classical AP-MS of membrane proteins requires detergent solubilisation, which often disrupts the native interaction context and results in incomplete complex recovery. For membrane-proximal interaction mapping, APEX2 proximity labeling applied before cell lysis is the preferred approach: the enzyme labels proteins within ~20 nm of the receptor at the plasma membrane in situ, and cells are then lysed under denaturing conditions to recover all biotinylated proteins regardless of their membrane association state. For ion channels and receptor tyrosine kinases where the cytoplasmic domain drives interaction recruitment, digitonin-based gentle lysis AP-MS combined with proximity labeling provides complementary views of the extracellular-proximal and cytoplasmic-domain interaction networks. Our team will recommend the appropriate workflow for your specific membrane target class after reviewing its topology, expression system, and interaction biology.

Q: Does proximity labeling (TurboID / APEX2) identify only proximal proteins, or actual binding partners?

Proximity labeling identifies proteins within the labeling radius (~10 nm for TurboID, ~20 nm for APEX2) of the bait — which includes direct binding partners, proteins within the same complex, and spatially proximate proteins that do not physically contact the bait. This is a feature as much as a limitation: the proximity-labeling dataset captures the full local proteome environment of the bait, including proteins that would be inaccessible to pull-down methods. Distinguishing direct binders from proximal non-binders requires integration with orthogonal data: AP-MS of the same bait (direct binders survive pull-down), cross-linking MS for distance restraints, or co-evolutionary analysis. For drug discovery purposes, the proximity-labeling dataset is most valuable as a network map of the bait's functional neighbourhood — all proteins in that space are candidates for indirect drug effects even if they are not direct binding partners.

Q: How do I study drug-induced changes in the interactome — do I need to pre-treat cells before shipping?

For most comparative interactomics experiments, drug pre-treatment is performed in our facility using the compound you supply, under conditions we coordinate with you. You ship cells or cell-line stocks, we establish the culture, perform drug treatment at the specified concentration and duration, then execute the pull-down or proximity labeling protocol directly. This approach ensures that the drug treatment and interactomics workflow are tightly integrated without sample-quality risk from shipping treated cells. If you prefer to perform drug treatment in-house and ship treated cell pellets, this is also acceptable — but the pull-down must be initiated immediately after freezing and the treatment timing relative to harvest must be documented precisely. Contact our team to discuss which logistics model suits your experimental design and compound stability.

Q: What cell lines are compatible with this service, and do I need to engineer my own cell line?

Common mammalian cell lines (HEK293T, HeLa, HCT116, Jurkat, U2OS, A549, and others) are routinely compatible with all four workflows. For AP-MS via tag pull-down, you supply cells stably or transiently expressing the tagged bait — or, if your bait has a validated antibody, we can perform endogenous immunoprecipitation without requiring a tagged construct. For TurboID or APEX2 workflows, a stably integrated fusion construct is recommended for biological replicate consistency; transient transfection is acceptable for initial pilot experiments. If you do not have the appropriate cell line engineered and prefer us to handle construct integration, we can discuss lentiviral stable integration as a project add-on. Our chemoproteomics workflows are available for probe-based interaction mapping when a covalent or photoactivatable bait is appropriate for your target.

References

  1. Luo S., Xie L., Yang L., et al. Sensitive and specific affinity purification-mass spectrometry assisted by PafA-mediated proximity labeling. Cell Reports Methods. 2025;5:101166.
  2. Choi H., Larsen B., Lin Z.Y., et al. SAINT: probabilistic scoring of affinity purification-mass spectrometry data. Nat Methods. 2011;8(1):70–73.
  3. Mellacheruvu D., Wright Z., Couzens A.L., et al. The CRAPome: a contaminant repository for affinity purification-mass spectrometry data. Nat Methods. 2013;10(8):730–736.
  4. Qin W., Cho K.F., Cavanagh P.E., Ting A.Y. Deciphering molecular interactions by proximity labeling. Nat Methods. 2021;18(2):133–143.

Map your target's protein interaction network with the MassTarget™ team

Tell us your bait protein, your biological question — stable complex, transient signalling, membrane interactome, or drug-induced remodelling — and our scientists will recommend the right workflow, control strategy, and quantification design before your project begins.

For Research Use Only (RUO). Not intended for diagnostic, therapeutic, or clinical decision-making purposes. Creative Proteomics services are designed to support preclinical research, drug discovery, and mechanism of action studies only.

Online Inquiry

Please submit a detailed description of your project. We will provide you with a customized project plan to meet your research requests. You can also send emails directly to for inquiries.

* Email
Phone
* Service & Products of Interest
Services Required and Project Description