Zhu Y, Chen G, Zhang K, et al. "High-Throughput Metabolic Soft-Spot Identification in Liver Microsomes by LC/UV/MS: Application of a Single Variable Incubation Time Approach." Molecules, 2022, 27(22):8058. https://doi.org/10.3390/molecules27228058 [CC BY 4.0]
Background
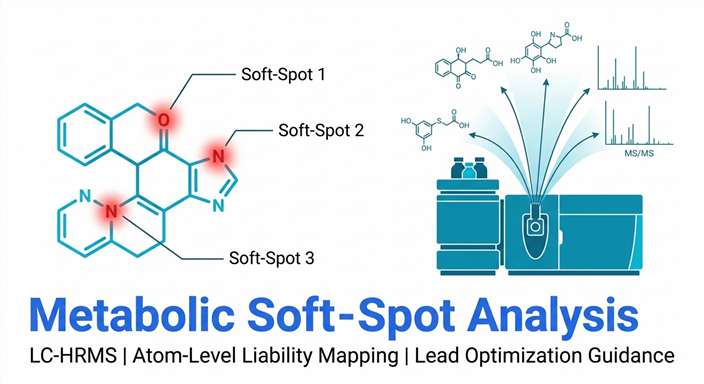
Metabolic soft-spot identification (MSSID) is a routine requirement in lead optimization, but conventional methods require extensive LC-MS analysis time and manual data interpretation. The goal of this study was to develop and validate a simple, effective, and high-throughput MSSID assay suitable for early drug discovery.
Methods
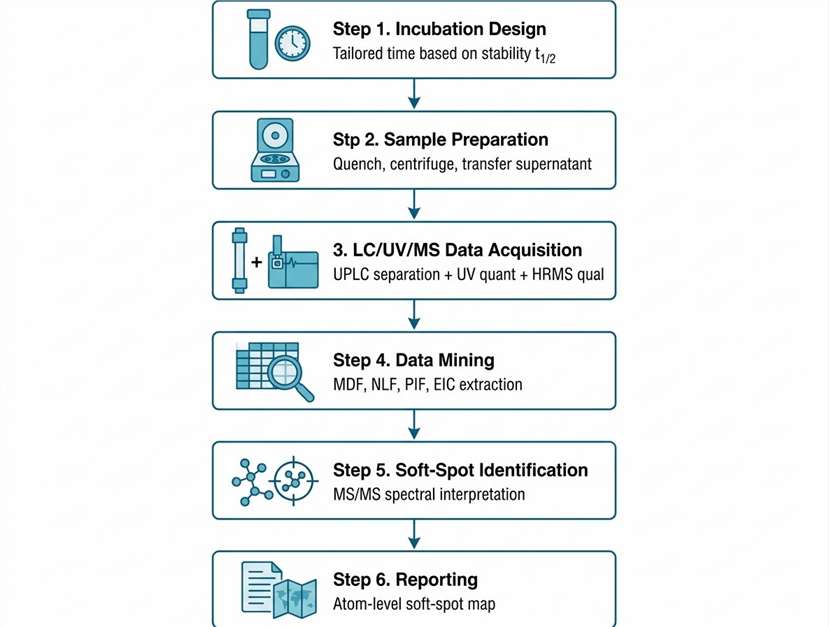
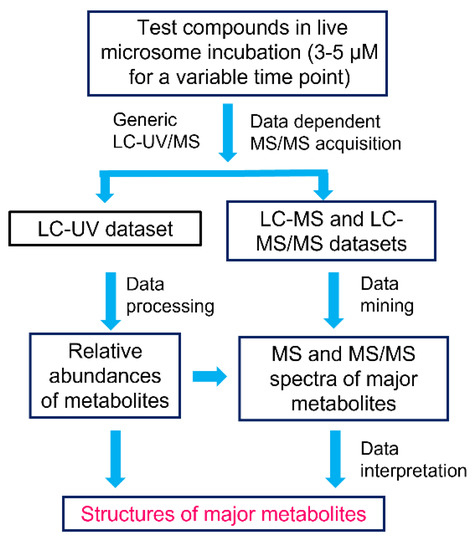
Seven model compounds with diverse structures and metabolic rates were selected: verapamil, dextromethorphan, buspirone, mirtazapine, saquinavir, midazolam, and amodiaquine. Each compound was incubated at 3 or 5 µM with human liver microsomes (0.5 mg/mL) and NADPH. The incubation time for each compound was individually calculated based on its pre-determined metabolic stability t1/2, targeting 20–40% parent depletion.
Two LC/UV/MS platforms were used: LC/UV/Q-TOF (TripleTOF 4600) with Full MS/dd-MS2 acquisition for saquinavir, verapamil, mirtazapine, and buspirone; and LC/UV/Qtrap with MIM-EPI acquisition for verapamil, dextromethorphan, midazolam, and amodiaquine. Data mining was performed using MetabolitePilot and PeakView software with MDF, NLF, PIF, and EIC techniques.
Results
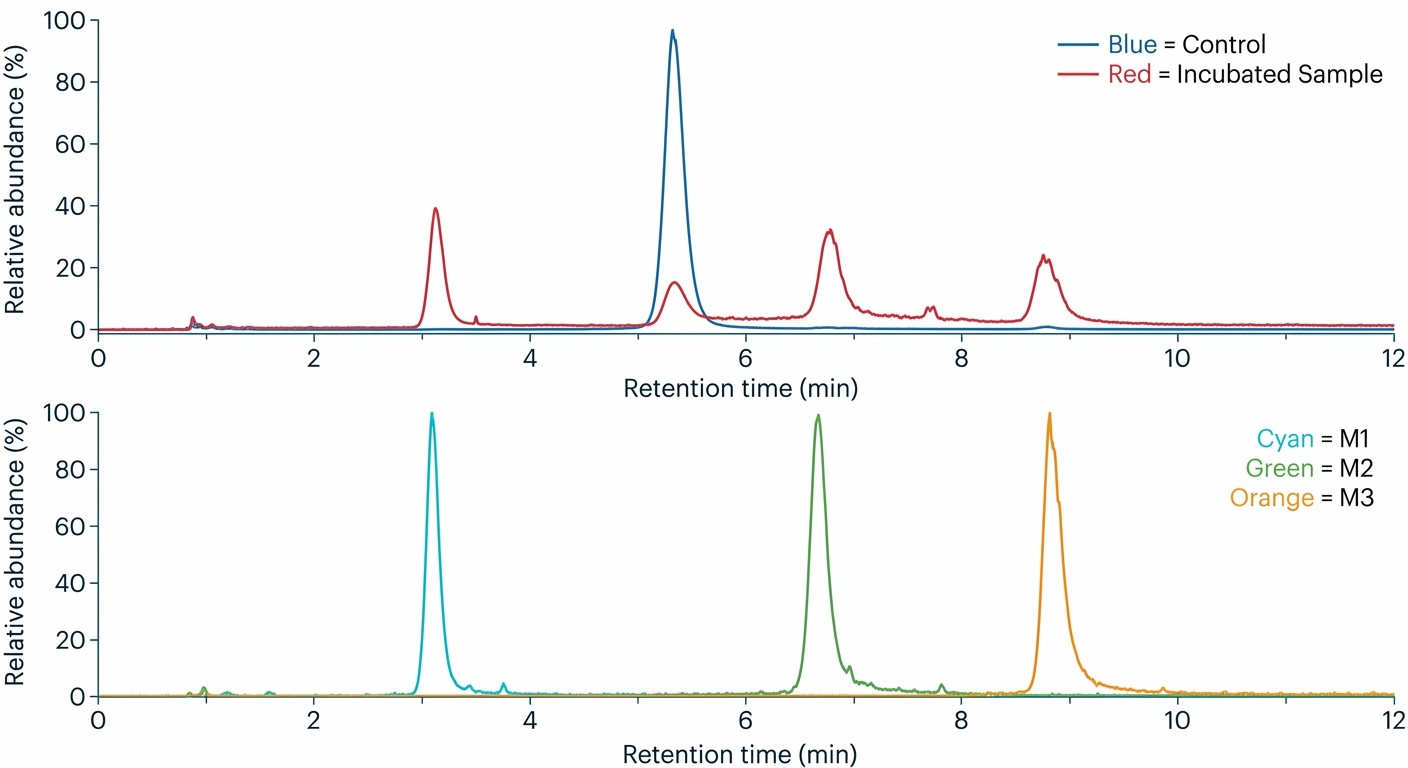
The single variable incubation time approach successfully limited metabolism to primary metabolites for all seven compounds. Key findings included:
- Verapamil — Major soft-spots identified at N-dealkylation (V1/VM2) and N-demethylation (V5/VM8) positions
- Dextromethorphan — Primary soft-spot at O-demethylation (DM2)
- Midazolam — Primary soft-spot at mono-oxidation (MM2)
- Amodiaquine — Primary soft-spot at N-deethylation (AM1)
An important methodological finding was that UV quantification corrected for MS ionization bias. For saquinavir, metabolites S6 and S7 showed similar UV responses, but S7's MS response was significantly underestimated, demonstrating that MS-only quantification could lead to inaccurate soft-spot prioritization.
Conclusion
The single variable incubation time approach substantially simplifies metabolic soft-spot identification and is well-suited for high-throughput lead optimization. The combination of LC/UV quantification with HRMS structural characterization provides both accurate abundance assessment and confident structural assignment. The analytical workflow used in this study is illustrated in Figure 2 of the publication.