Lipidomics Drug Response Profiling Service

Profile drug-induced lipid remodeling across treated models, controls, doses, time points, and sample matrices.

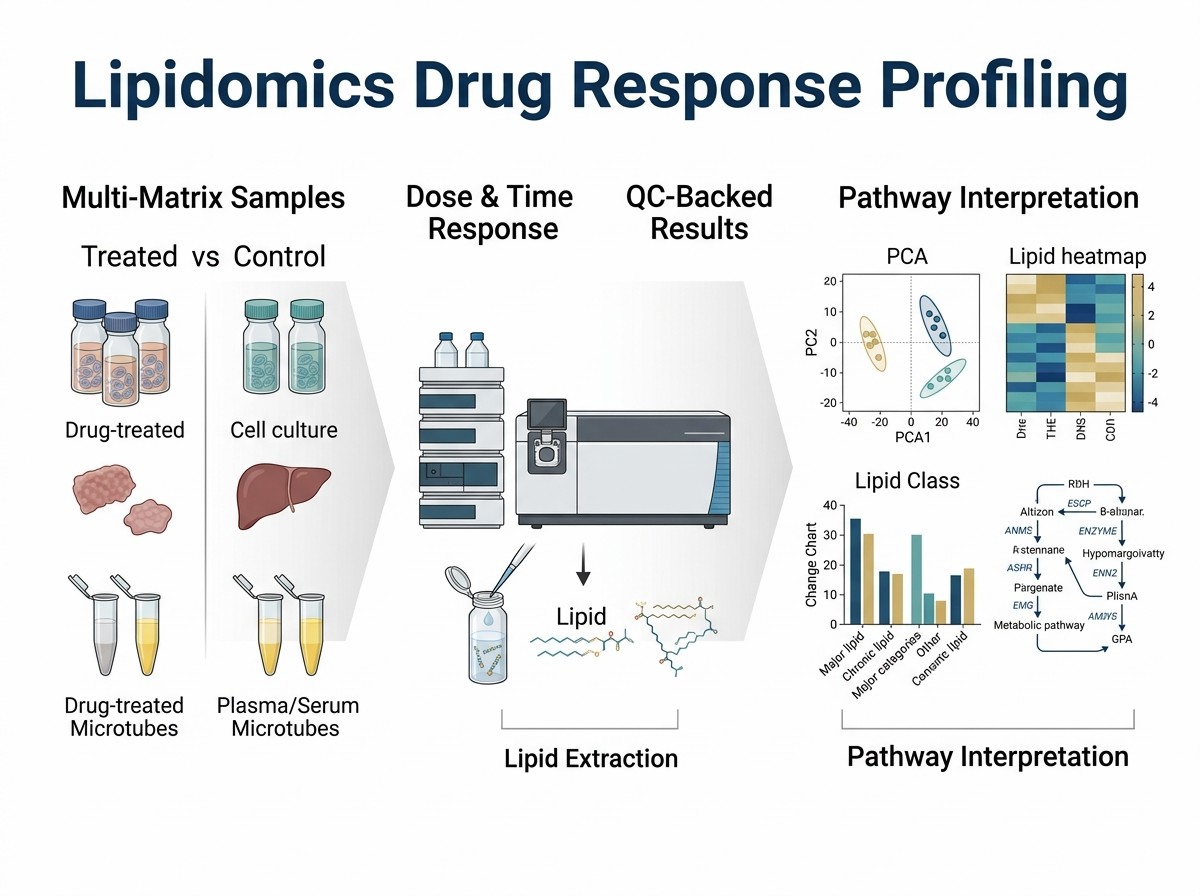
Candidate compounds can reshape lipid biology in ways that are not always visible from phenotype, viability, or protein-level data alone. Our Lipidomics Drug Response Profiling Service helps you evaluate how drug treatment affects lipid species, lipid classes, and lipid pathways across treated models, controls, doses, time points, and sample matrices.

We use LC-MS/MS-based lipidomics to analyze compound-treated cells, tissues, biofluids, organoids, spheroids, co-culture models, and selected subcellular fractions. Our team helps you turn lipid changes into reviewable evidence: data tables, QC summaries, lipid class summaries, visual outputs, and interpretation notes that support mechanism-focused research decisions.

Key advantages

  • Compare treated vs control lipid responses
  • Profile dose and time-dependent remodeling
  • Interpret lipid pathway perturbation
  • Support compound prioritization decisions
  • Receive QC-backed deliverable packages
Lipidomics drug response profiling workflow showing treatment matrix, LC-MS/MS analysis, and lipid pathway interpretation.
Overview Applications Capabilities Workflow Sample Analysis Case Study FAQ

Drug-Response Lipidomics for Compound and Mechanism Studies

Lipidomics drug response profiling measures how a compound, treatment condition, or biological perturbation changes lipid species, lipid classes, and lipid-related pathways. The goal is not simply to generate a long lipid list. The goal is to understand how lipid biology responds to treatment and what that response may suggest for the next experiment.

This service is built for projects asking questions such as:

  • Does a compound reshape membrane lipids, sphingolipids, triglycerides, ceramides, phospholipids, or lipid mediators?
  • Do treated and control groups show a clear lipid-response signature?
  • Do different compounds create similar or different lipid remodeling patterns?
  • Does the lipid response support a mechanism hypothesis for follow-up work?
  • Can lipidomics help prioritize which candidate should move forward?

What This Service Measures

We analyze lipid changes across drug-treated and control samples using LC-MS/MS-based lipidomics. Depending on your project design, we can support broad lipid discovery or focus on selected lipid classes and mediator pathways.

Typical readouts include:

  • Differential lipid species between groups
  • Lipid class-level remodeling
  • Treatment-specific lipid signatures
  • Dose- or time-associated lipid trends
  • Candidate compound response patterns
  • Lipid pathway changes linked to biological response
  • QC-backed lipid annotation and reporting

What Makes a Strong Drug-Response Lipidomics Project

A strong project usually starts with a clear treatment matrix. That may include a vehicle control, one or more compound concentrations, defined exposure times, biological replicates, and a model system that reflects the biological question.

We can support studies that compare:

  • Vehicle vs compound-treated groups
  • Low-dose vs high-dose treatment
  • Early vs later exposure time points
  • Multiple compounds or analogs
  • Sensitive vs resistant models
  • Treated tissues or biofluids from model systems
  • Organoids, spheroids, co-culture models, or selected fractions

With this structure, the final data can move beyond “what changed” and begin to show how treatment reshapes lipid biology across conditions.

When to Use Lipidomics Drug Response Profiling

Lipidomics is especially useful when a compound may affect membrane biology, lipid storage, oxidative stress, inflammatory signaling, metabolic remodeling, or model-level treatment response.

Compare Candidate Compounds by Lipid-Response Signature

When several compounds show similar phenotypic activity, lipidomics can help reveal whether they produce similar molecular responses.

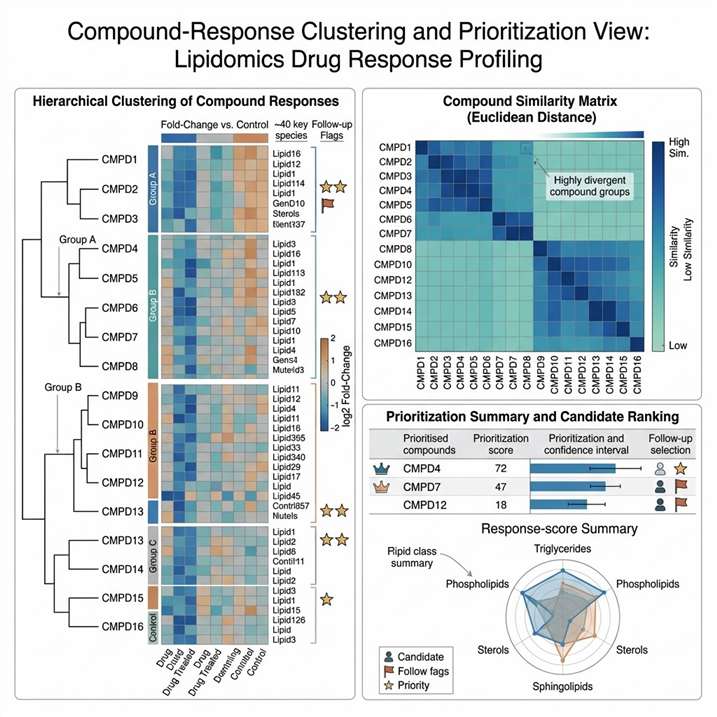
Our team can compare compound-specific lipid signatures using lipid species tables, lipid class summaries, clustering plots, and pathway-level interpretation. This helps you see whether candidates share a lipid-response pattern or act differently at the lipid pathway level.

If your project is still at the hit discovery stage and you need direct binding evidence before downstream response profiling, our Affinity Selection Mass Spectrometry service can support label-free ligand screening and hit identification.

Track Dose- or Time-Dependent Lipid Remodeling

A single treated vs control comparison may miss important response trends. If your study includes multiple doses or time points, we can evaluate whether lipid changes increase, decrease, reverse, or cluster by treatment intensity.

This is useful when you need to know whether lipid remodeling appears early, strengthens with exposure, or differs between short and longer treatment windows.

Explore Lipid Pathway Clues in Disease-Model Drug Response

Drug treatment can affect phospholipids, sphingolipids, glycerolipids, fatty acyls, sterol lipids, and lipid mediators. These changes can provide useful pathway clues in disease-model studies.

We keep the interpretation grounded. Lipid changes can support mechanism hypotheses and guide follow-up experiments, but they should not be treated as direct proof of target binding or therapeutic effect.

Investigate Toxicity-Related Lipid Shifts Without Overclaiming Causality

Some drug treatments may produce lipid signatures linked to stress response, membrane remodeling, lipid storage, or mitochondrial-related metabolic changes. Lipidomics can help identify these patterns and support additional evaluation.

We report these findings as lipid-response evidence and follow-up hypotheses, not as stand-alone safety conclusions.

Support Mechanism Hypotheses with Lipid Pathway Evidence

Lipidomics can help connect a compound’s observed effect with changes in lipid classes, pathways, and biological processes.

For example, shifts in sphingolipids, ceramides, phosphatidylcholines, phosphatidylserines, triglycerides, or lipid mediators may point to pathway changes worth testing with orthogonal methods.

Service Capabilities and Project Fit

We support lipidomics drug response studies from project design through data delivery. Before samples enter analysis, we review the compound, model, treatment groups, dose, exposure time, controls, sample type, and planned comparisons.

This early review helps us align the LC-MS/MS workflow with your research question instead of forcing every project into the same analysis format.

MODE 1

Untargeted Lipidomics for Broad Response Discovery

Untargeted lipidomics is suitable when you want a broad view of drug-induced lipid remodeling. It can help discover lipid classes and species that change across treated and control groups without limiting the analysis to a predefined panel.

  • Comparing treated and control groups
  • Discovering unexpected lipid class changes
  • Evaluating broad compound-response signatures
  • Supporting early mechanism exploration
  • Identifying lipid species for follow-up targeted analysis
MODE 2

Targeted Lipid Panels for Pathway-Focused Quantification

Targeted lipidomics is useful when your team already has a defined lipid pathway, lipid class, or mediator group of interest.

This approach is better suited for focused quantification of selected lipid groups, such as lipid mediators, sphingolipids, oxylipins, or other pathway-focused targets, depending on project feasibility and available method coverage.

MODE 3

Lipid Mediator Profiling for Inflammatory or Immune-Response Studies

Some drug-response projects require closer attention to lipid mediators involved in inflammatory or immune-related pathways. In these studies, sample handling, extraction method, and analytical sensitivity are especially important.

We can help you decide whether a discovery lipidomics workflow or a more targeted mediator-focused strategy is the better fit.

MODE 4

Multi-Condition Comparison for Compound, Dose, and Time Matrices

Many drug-response questions cannot be answered by a single pairwise comparison. We support study designs that compare:

  • Vehicle vs treated groups
  • Low, medium, and high treatment conditions
  • Multiple exposure time points
  • Multiple compounds or analogs
  • Sensitive vs resistant models
  • Model-specific response patterns
MODE 5

Optional Multi-Omics Interpretation for Matched Datasets

When matched proteomics, metabolomics, transcriptomics, or phenotypic data are available, lipidomics can be interpreted as part of a broader response map.

This can help show whether lipid remodeling aligns with protein-level changes, pathway activity, metabolic shifts, or observed phenotype.

Lipidomics Drug Response Workflow with QC Checkpoints

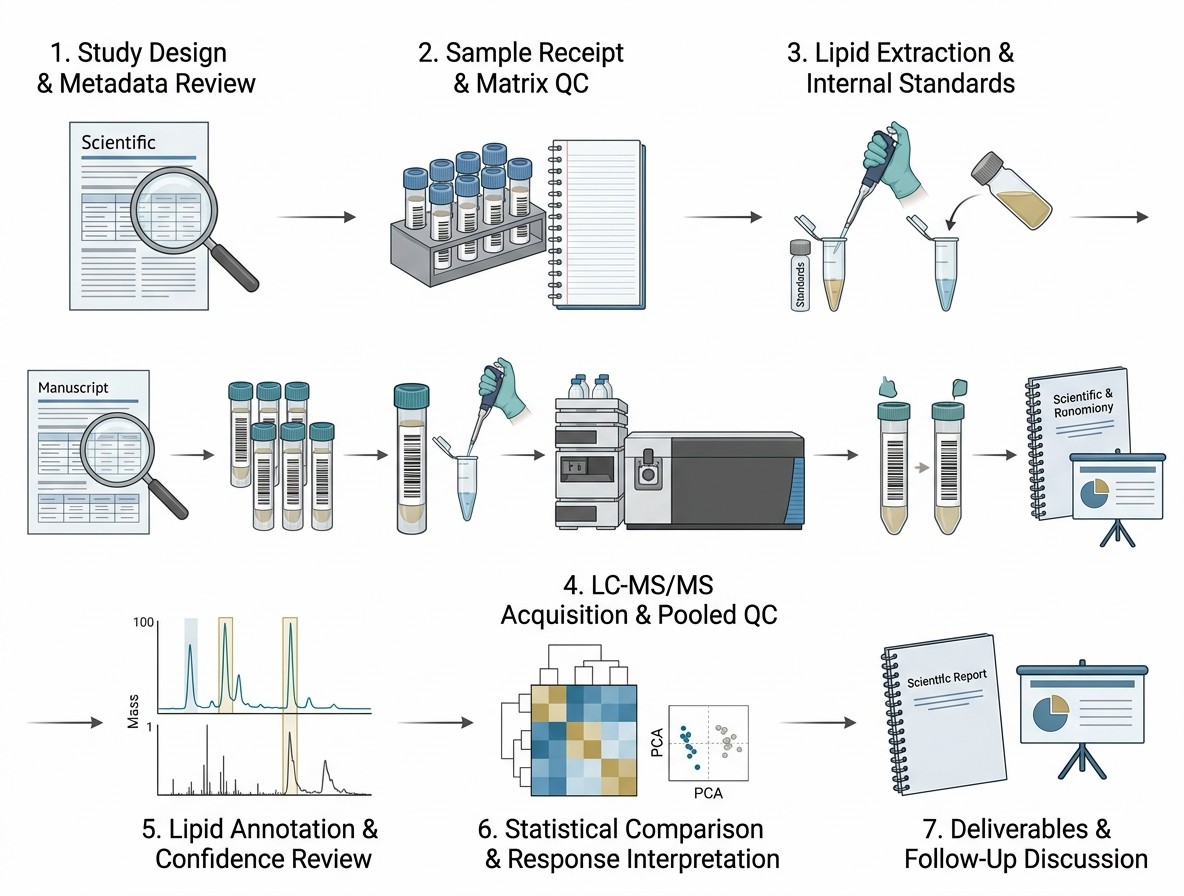
Our workflow combines service planning, sample handling, lipid extraction, LC-MS/MS acquisition, data processing, and interpretation. Each stage is designed to protect lipid signal quality and produce data that your team can review.

1

Study Design and Metadata Review

We review compound identity or code, treatment groups, vehicle controls, dose, exposure time, model type, biological replicates, sample matrix, collection method, and planned comparisons.

QC focus: treatment matrix clarity, control group design, replicate structure, and sample metadata completeness.

2

Sample Receipt, Matrix QC, and Extraction Planning

When samples arrive, we review labeling, sample type, storage condition, shipping condition, and visible matrix concerns. Samples are assigned to an extraction plan based on matrix type, project goal, and lipid coverage needs.

QC focus: sample integrity, freeze-thaw history, matrix consistency, labeling, and extraction suitability.

3

Lipid Extraction and Internal Standard Addition

Lipid extraction separates lipid molecules from proteins, salts, aqueous components, and matrix background. Depending on the sample type and target lipid range, extraction conditions may be adjusted to improve recovery and reproducibility.

QC focus: extraction consistency, matrix effect review, recovery monitoring, and sample-to-sample comparability.

4

LC-MS/MS Acquisition and Pooled QC Monitoring

Extracted lipid samples are analyzed by LC-MS/MS. Liquid chromatography separates lipid species before mass spectrometry detection, and MS/MS information supports lipid annotation.

QC focus: retention time stability, signal intensity, pooled QC performance, blank review, and batch consistency.

5

Lipid Annotation and Identification Confidence Review

Lipid features are processed, aligned, annotated, and filtered. Annotation confidence depends on accurate mass, MS/MS information, retention behavior, adduct patterns, isotope patterns, and database or library support.

QC focus: mass accuracy, MS/MS support, redundant adducts, expected elution patterns, and annotation confidence.

6

Statistical Comparison and Response-Pattern Interpretation

After QC review, we perform group comparisons based on the treatment matrix. This may include treated vs control comparisons, dose trends, time-course patterns, compound clustering, lipid class summaries, and pathway-level interpretation.

QC focus: group structure, normalization approach, outlier review, statistical consistency, and visual interpretability.

7

Deliverable Package and Follow-Up Discussion

The final package is prepared for review by your research team. We provide data tables, QC summaries, result figures, lipid class summaries, and interpretation notes.

Vertical workflow diagram for lipidomics drug response profiling with QC checkpoints.

Sample Requirements for Drug-Response Lipidomics Studies

Good lipidomics data starts with consistent sample collection and rapid stabilization. In Creative Proteomics’ metabolomics sample guidance, lipidomics sample amounts include 100–200 mg for animal or plant tissue, >100 μL for plasma/serum, 200–500 μL for urine, >200 μL for saliva, bile, tears, or similar fluids, >1×10⁷ cells, >2 mL for culture supernatant, and 100–200 mg for feces or intestinal contents. Samples should be quickly frozen, stored at -80°C, shipped on dry ice, and protected from repeated freeze-thaw cycles.

Sample TypeRecommended InputRequired Treatment MetadataStorage / ShippingQC CheckpointsNotes
Drug-treated cells>1×10⁷ cellsCompound code, dose, vehicle, exposure time, replicate ID, cell densityFreeze rapidly, store at -80°C, ship on dry iceCell number consistency, vehicle control, treatment timingKeep harvest timing consistent across groups
Treated tissue100–200 mgModel group, treatment condition, tissue region, collection timeFreeze rapidly, store at -80°C, ship on dry iceTissue region consistency, contamination review, freeze-thaw historyUse the same anatomical region when possible
Plasma / serum>100 μLTreatment group, collection time, anticoagulant or serum tube type, fasting/status notes if relevantAliquot, store at -80°C, ship on dry iceHemolysis/lipemia review, tube type, storage historyAvoid repeated freeze-thaw cycles
Urine200–500 μLTreatment group, collection window, normalization planFreeze rapidly, store at -80°C, ship on dry iceCell debris review, collection consistencyCentrifuged supernatant is preferred
Saliva, bile, tears, or similar fluids>200 μLTreatment group, collection method, collection timeAliquot, store at -80°C, ship on dry iceMatrix clarity, contamination risk, volume sufficiencyConfirm special matrices before submission
Culture supernatant>2 mLCell type, medium, treatment, exposure time, collection methodRemove cells/debris, freeze, ship on dry iceMedium consistency, serum condition, debris removalMedium composition may affect lipid-related signals
Organoids / spheroids / co-culture modelsProject-dependent; confirm before submissionModel type, culture condition, treatment matrix, harvest methodFreeze rapidly, store at -80°C, ship on dry iceBiomass sufficiency, media carryover, model consistencyPooling may be needed for low-biomass samples
Subcellular fractionsProject-dependent; confirm before submissionFraction method, treatment condition, normalization basisFreeze rapidly, store at -80°C, ship on dry iceFraction purity indicators, protein/lipid normalization planBest used with clear fraction QC

Please include your treatment matrix with the shipment. At minimum, we need sample ID, group name, compound code, vehicle, dose, exposure time, biological replicate ID, collection method, storage condition, and any special handling notes.

Bioinformatics Analysis and Lipid Response Interpretation

Drug-response lipidomics does not end with peak detection. The value comes from turning lipid features into comparisons your team can interpret and discuss.

We process the data through QC review, feature filtering, lipid annotation, group comparison, visualization, and interpretation. The analysis plan depends on the study design and the number of treatment conditions.

Minimum Analysis Deliverables

  • Raw data package where applicable
  • Processed lipid feature table
  • Lipid annotation table with confidence notes
  • QC summary
  • Differential lipid species table
  • Lipid class-level summary
  • PCA, clustering, heatmap, or volcano-style plots
  • Group comparison statistics
  • Interpretation summary for drug-response patterns

Optional Add-Ons for Dose, Time, and Compound-Response Modeling

  • Dose-response lipid trend analysis
  • Time-course lipid response analysis
  • Compound-response clustering
  • Pathway enrichment or lipid pathway mapping
  • Targeted lipid mediator panel interpretation
  • Multi-omics integration with proteomics, metabolomics, or transcriptomics
  • Candidate prioritization based on lipid-response similarity

Lipid Pathway Interpretation and Reporting Boundaries

Lipidomics can support mechanism hypotheses by showing how lipid classes and pathways shift after treatment. For example, changes in triglycerides, phospholipids, sphingolipids, ceramides, or lipid mediators may suggest pathway-level remodeling.

We interpret these findings as response evidence. We do not present lipid changes as direct proof of a drug target without orthogonal validation.

Multi-Omics Integration When Matched Datasets Are Available

When you have matched proteomics, metabolomics, transcriptomics, or phenotype data, lipidomics can help complete the response picture.

  • Lipidomics may show membrane or lipid storage remodeling.
  • Proteomics may show changes in pathway enzymes or stress-response proteins.
  • Metabolomics may show broader metabolic shifts.
  • Phenotype data may show how molecular changes align with cell or model behavior.

Together, these layers can support stronger follow-up hypotheses than any single dataset alone.

Representative Demo Results: What Your Drug-Lipidomics Data May Show

Your final results will depend on sample type, treatment design, and analytical scope. The examples below show typical output formats we can prepare for lipidomics drug response projects.

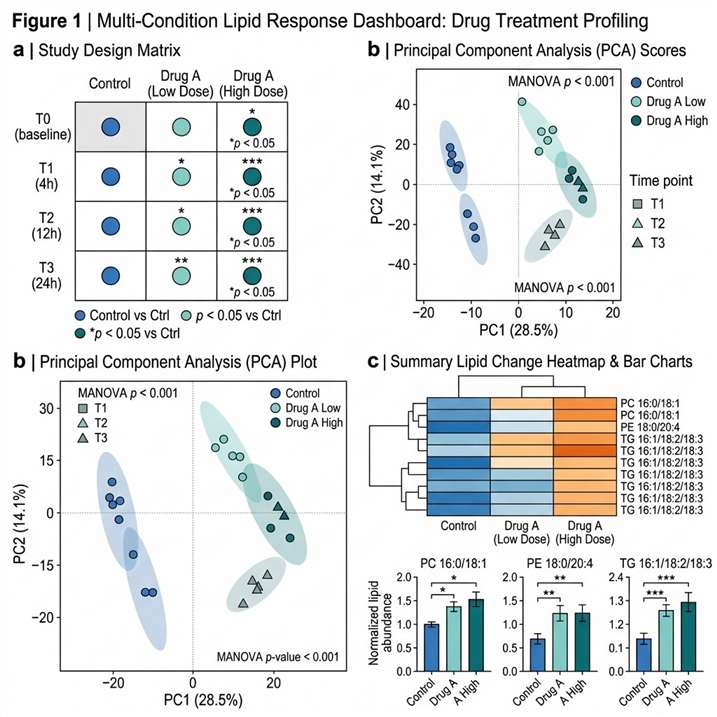
Demo lipidomics drug response results showing PCA, heatmap, lipid class remodeling, and compound clustering.

Multi-Condition Lipid Response Dashboard

A multivariate score plot can show whether control, low-dose, high-dose, recovery, or time-point groups separate by lipid profile.

Suggested visual: PCA or PLS-style score plot with treatment groups.

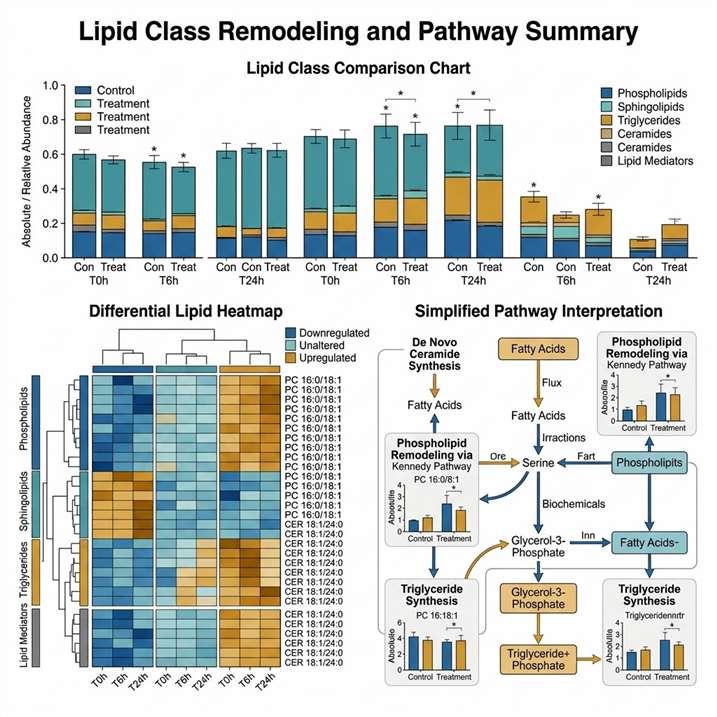
Lipid class remodeling summary and heatmap for drug-response lipidomics.

Lipid Class Remodeling and Pathway Summary

A lipid class summary can show whether treatment affects phospholipids, sphingolipids, triglycerides, ceramides, fatty acyls, or lipid mediators.

Suggested visual: Heatmap plus lipid class bar summary.

Compound-response clustering map for lipidomics drug response profiling.

Compound-Response Clustering and Prioritization View

When several compounds are compared, clustering can show which candidates produce similar lipid-response signatures.

Suggested visual: Compound-response clustering map.

How to Choose the Right Lipidomics Strategy

The best approach depends on your question, sample type, and how much you already know about the lipid pathway involved.

StrategyBest Used WhenStrengthLimitationPractical Decision Rule
Lipidomics Drug Response ProfilingYou need to compare lipid changes after compound treatmentStrong for treated vs control, dose/time, and compound-response interpretationDoes not prove direct target engagement by itselfChoose this when lipid remodeling is central to your drug-response question
Untargeted LipidomicsYou want broad lipid discovery without a predefined panelGood for discovering unexpected lipid species and classesMay require follow-up targeted validationChoose this when you do not yet know which lipid pathways matter
Targeted Lipid PanelYou already know the lipid class or pathway of interestBetter focus for selected lipid groupsLimited discovery scopeChoose this when your hypothesis is already defined
Untargeted MetabolomicsYou need broader metabolic response information beyond lipidsCaptures non-lipid metabolites and pathway shiftsLess depth for lipid classesChoose this when the phenotype may not be lipid-centered
Proteomics Drug ResponseYou need protein abundance or pathway-level protein responseStrong for enzyme, pathway, and protein network contextMay miss lipid-specific remodelingChoose this when protein-level biology is the primary question
Multi-Omics IntegrationYou need a systems-level view of drug responseConnects lipid, metabolite, protein, and transcript changesRequires matched design and careful interpretationChoose this when one data layer cannot explain the response clearly

Practical Selection Rules for Study Design

Choose lipidomics drug response profiling when:

  • You expect drug treatment to affect lipid pathways.
  • You need to compare multiple compounds.
  • You want to evaluate dose- or time-dependent lipid remodeling.
  • You need lipid-response evidence to support a mechanism hypothesis.
  • You want a reviewable data package for internal project discussion.

Choose a targeted lipid panel when:

  • The pathway is already known.
  • You need focused measurement of selected lipid mediators.
  • You are following up on discovery lipidomics results.

Choose multi-omics when:

  • Lipid changes alone do not explain the phenotype.
  • You need to connect lipid shifts with protein or metabolic pathways.
  • You have matched samples across omics platforms.

If your team needs direct binding or interaction data to pair with lipid-response evidence, we can also support orthogonal project planning through services such as Biacore Service or Chemical Cross-Linking Mass Spectrometry Service, depending on the biological question.

Deliverables for Reviewable Drug-Response Decisions

We design deliverables so your team can review the data, understand the QC, and decide what to test next.

Data Files

  • Raw data files where applicable
  • Processed lipid feature tables
  • Lipid annotation tables
  • Group comparison tables
  • Differential lipid species tables
  • Lipid class summaries

QC and Annotation Summaries

  • Sample-level QC notes
  • Pooled QC performance summary where applicable
  • Batch review notes
  • Annotation confidence notes
  • Missing value and filtering summary
  • Outlier review notes where relevant

Statistical and Visualization Outputs

  • PCA or clustering plots
  • Heatmaps
  • Volcano-style plots
  • Lipid class remodeling charts
  • Dose or time trend plots when designed
  • Compound-response comparison plots

Interpretation Summary and Follow-Up Recommendations

The final interpretation focuses on drug-response patterns, not unsupported claims.

We summarize:

  • Which lipid classes changed
  • Which lipid species contributed to group separation
  • Whether dose, time, or compound-specific patterns are visible
  • Which lipid pathways may be useful for follow-up
  • Which findings may benefit from targeted validation or orthogonal assays

Case Study: Lipid Species Signatures in Drug-Resistant Cells

Background

Drug resistance can involve changes in lipid metabolism, membrane biology, and lipid storage. In a 2025 study, Ramzy and colleagues investigated lipid signatures in FOLFOXIRI-naïve and FOLFOXIRI-resistant colorectal cancer cell models.

The study was designed to understand whether acquired resistance was associated with measurable lipidome changes. The authors used four human colorectal carcinoma cell lines and compared resistant clones with matched treatment-naïve cells.

Source: Identification of Lipid Species Signatures in FOLFOXIRI-Resistant Colorectal Cancer Cells

Methods

The researchers used untargeted LC-HRMS-based lipidomic profiling to compare lipid signatures across the cell models. They also used Analysis of variance-Multiblock Orthogonal Partial Least Squares, or AMOPLS, to separate variation linked to resistance, cell origin, and their interaction.

This design is relevant to drug-response lipidomics because it shows why treatment response should be interpreted in context. The lipidome shift was not only a simple resistant vs naïve pattern; it also depended on the cell line background.

Results

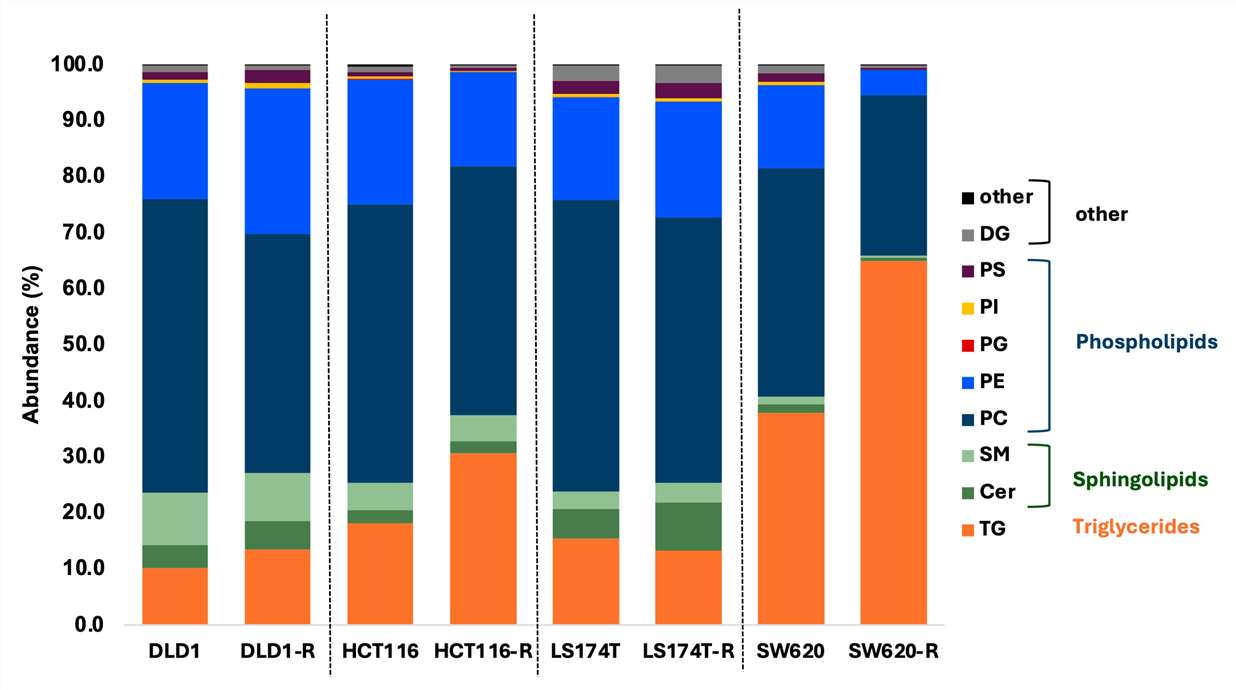
The paper reported 1737 MS2-matched lipids, which were further curated based on accurate mass, redundant adduct signals, and expected elution patterns. Figure 2 showed normalized distributions of the main lipid subclasses in FOLFOXIRI-naïve and FOLFOXIRI-resistant clones.

  • HCT116 and LS174T cells showed similar lipid compositions, with 73% phospholipids, 7–8% total sphingolipids, and 15–18% triglycerides in the treatment-naïve state.
  • DLD1 cells had the highest relative amount of sphingolipids among the four cell lines, at 14%.
  • SW620 cells had the highest triglyceride proportion, at 38%, compared with 10–15% in the other three cell lines.
  • DLD1-R, HCT116-R, and SW620-R resistant cells showed triglyceride abundance increases of 3%, 13%, and 27%, respectively.
  • LS174T-R cells showed the opposite trend, with decreases in triglycerides and ether lipids.
  • The authors reported that resistance-related lipid reprogramming was cell-line specific rather than a single universal lipid pattern.

Figure 2 from Ramzy et al. shows lipid subclass distribution shifts between FOLFOXIRI-naïve and FOLFOXIRI-resistant colorectal cancer cell models. The figure is a useful visual example of how lipidomics can reveal drug-response-associated lipid remodeling.

Conclusion

This study shows why lipidomics can be valuable for mechanism-focused drug response research. The lipid changes were not limited to one lipid class, and the response differed across cell backgrounds.

For drug discovery teams, this type of evidence can help connect treatment response with lipid pathway remodeling, identify model-specific differences, and select lipid signatures for follow-up testing.

Figure 2 showing lipid subclass distribution changes in FOLFOXIRI-naïve and resistant colorectal cancer cell models.

Figure 2 from Ramzy et al. shows lipid subclass distribution shifts between FOLFOXIRI-naïve and FOLFOXIRI-resistant colorectal cancer cell models.

The publications below provide scientific context for lipidomics, drug response, lipid remodeling, and lipidomics data interpretation.

  1. Identification of Lipid Species Signatures in FOLFOXIRI-Resistant Colorectal Cancer Cells
    Drug-resistance-associated lipid species signatures and Figure 2 case evidence.
  2. Loss of G0/G1 Switch Gene 2 Promotes Disease Progression and Drug Resistance in Chronic Myeloid Leukaemia by Disrupting Glycerophospholipid Metabolism
    Lipid metabolism and drug resistance context.
  3. A Human iPSC-Derived Hepatocyte Screen Identifies Compounds That Inhibit Production of Apolipoprotein B
    Compound screening and LC-MS-related readout context.
  4. Cancer Cells Avoid Ferroptosis Induced by Immune Cells via Fatty Acid Binding Proteins
    Lipid mediator and ferroptosis-related pathway context.
FAQ

Frequently Asked Questions

Q: What is lipidomics drug response profiling?

Lipidomics drug response profiling measures how lipid species, lipid classes, and lipid pathways change after compound or treatment exposure. It is used to compare treated vs control groups, evaluate dose or time effects, and support mechanism-focused follow-up.

Q: What sample types can be used?

Common sample types include drug-treated cells, treated tissues, plasma, serum, urine, culture supernatant, organoids, spheroids, co-culture models, and selected subcellular fractions. Special matrices should be discussed before sample submission.

Q: Can this service compare multiple compounds?

Yes. If your study includes multiple compounds or analogs, we can compare their lipid-response signatures using differential lipid tables, lipid class summaries, clustering, and response-pattern visualization.

Q: Can lipidomics support mechanism-of-action studies?

Yes, lipidomics can support mechanism hypotheses by showing how treatment affects lipid classes and pathways. It should be combined with follow-up validation or orthogonal data when direct target or pathway confirmation is needed.

Q: Do I need untargeted lipidomics or a targeted lipid panel?

Choose untargeted lipidomics when you want broad discovery and do not yet know which lipid pathway matters. Choose a targeted lipid panel when you already know the lipid class, mediator group, or pathway you want to measure.

Q: What metadata should I provide?

Please provide sample ID, group name, compound code, dose, vehicle, exposure time, replicate ID, sample type, collection method, storage condition, and any special handling notes.

Q: How do you control batch effects and lipid identification confidence?

We review sample handling, pooled QC performance where applicable, retention time stability, signal consistency, blank signals, feature filtering, and lipid annotation confidence. Lipid IDs are reported with appropriate caution when structural resolution is limited.

Q: What deliverables will I receive?

Typical deliverables include raw data where applicable, processed lipid feature tables, lipid annotation tables, QC summaries, differential lipid species tables, lipid class summaries, visual plots, and an interpretation summary.

Q: Can lipidomics data be integrated with proteomics or metabolomics data?

Yes. When matched datasets are available, lipidomics can be integrated with proteomics, metabolomics, transcriptomics, or phenotype data to support a broader drug-response interpretation.

Plan a Lipidomics Drug Response Study

Share your compound, model, treatment groups, dose design, exposure time, and sample type with our team. We will help you review whether untargeted lipidomics, targeted lipid panels, or an integrated omics approach best fits your drug-response question.

Disclaimer

For Research Use Only. This service is not intended for diagnostic procedures, medical decision-making, or therapeutic use.

Online Inquiry

Please submit a detailed description of your project. We will provide you with a customized project plan to meet your research requests. You can also send emails directly to for inquiries.

* Email
Phone
* Service & Products of Interest
Services Required and Project Description