Structure–Activity Relationship by Mass Spectrometry (SAR-MS) Service

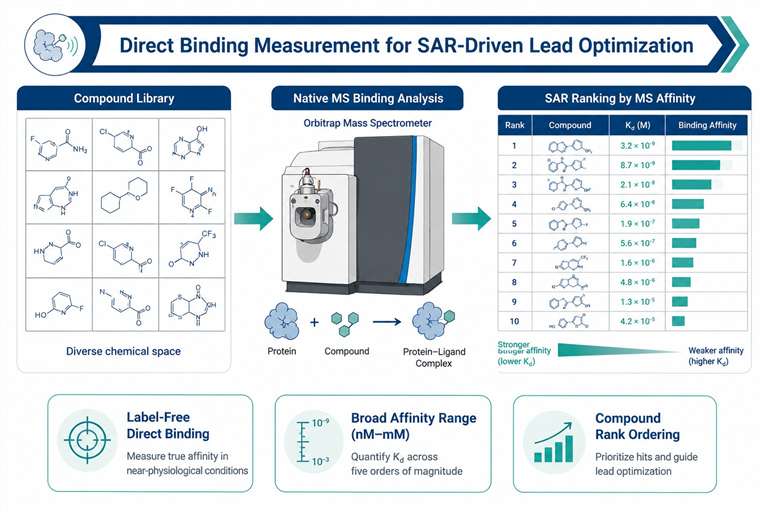
Direct binding measurement for SAR-driven lead optimization.

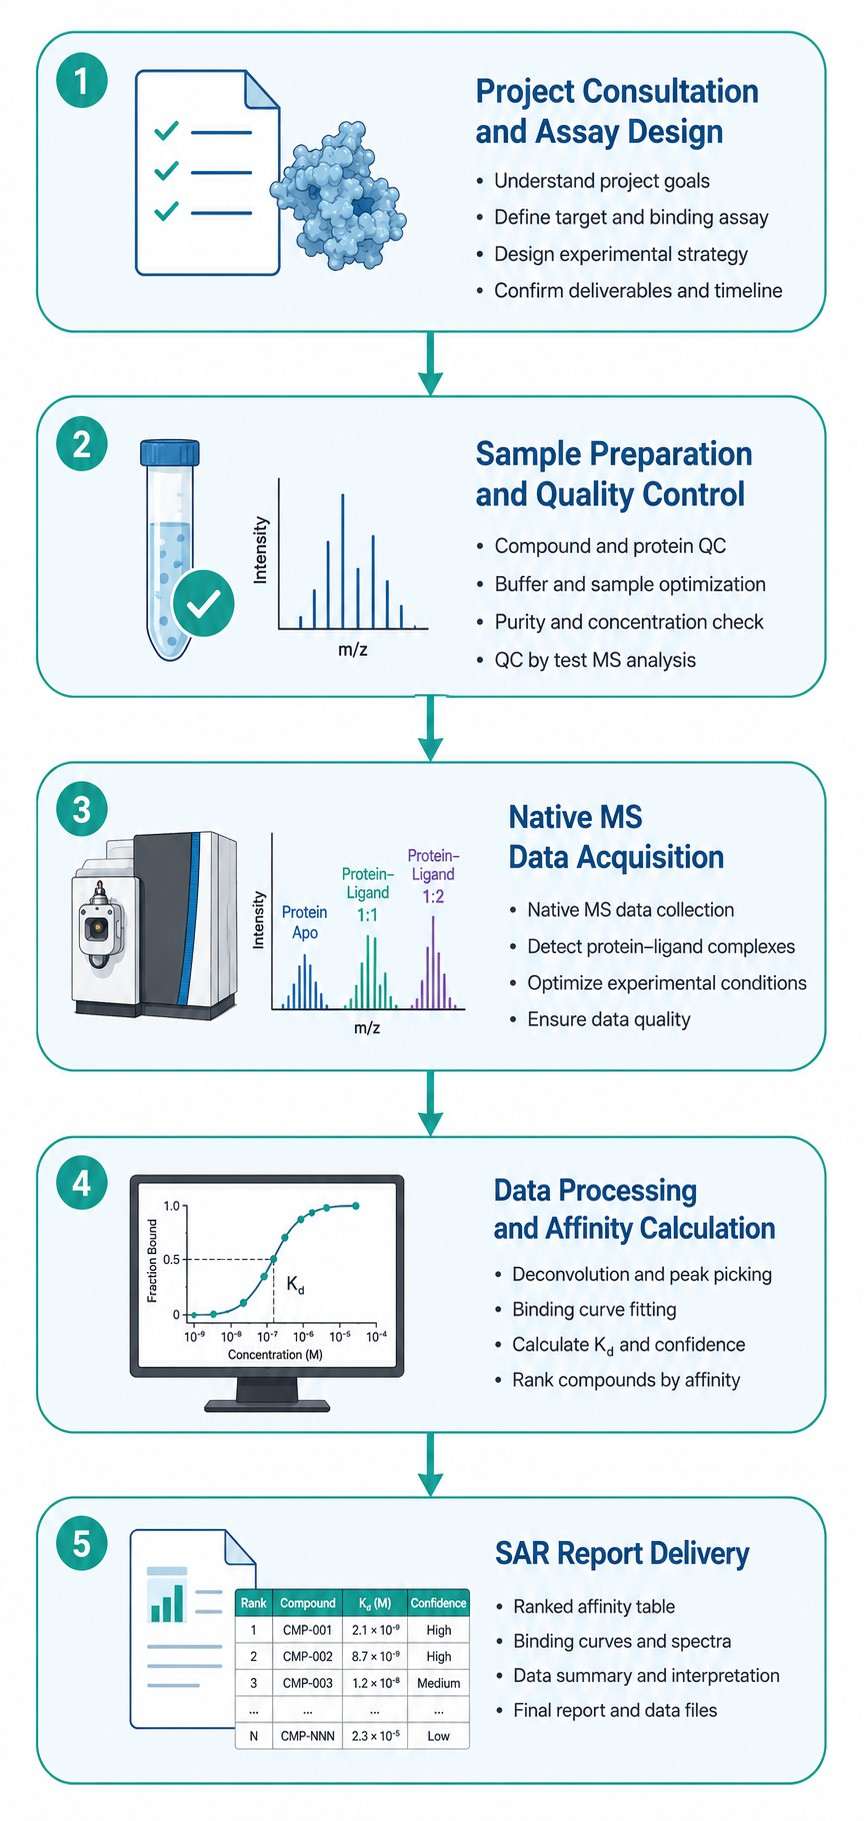
Every analog synthesized needs to be tested for binding — and the quality of that data determines how efficiently your team can optimize potency, selectivity, and drug-like properties. Our SAR-MS service delivers direct biophysical binding affinity measurements by native mass spectrometry, without labels, immobilization, or computational modeling.

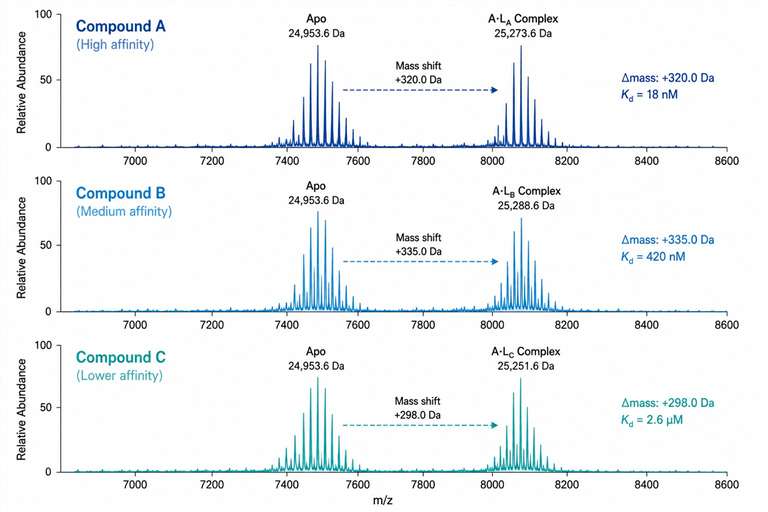
We measure protein–ligand binding under native solution conditions across a broad affinity range (nM to mM), providing Kd values, binding stoichiometry, and rank-ordered affinity lists for your chemical series. Whether you are optimizing a fragment hit, profiling a congeneric series, or assessing selectivity across related targets, SAR-MS gives you the data you need to make confident SAR decisions.

Key Advantages:

  • Label-free direct binding — no fluorescent tags, radioactive labels, or immobilization artifacts
  • Broad affinity range — detects binders from nM potent leads to mM weak fragments
  • Compound rank ordering — clear affinity ranking within chemical series
  • Multi-target selectivity — same platform works across diverse protein targets
  • Native solution conditions — measurements in physiological-like buffers
  • Rapid turnaround — results in days, not weeks
SAR-MS concept compound library native MS analysis SAR table output.
Service Overview Key Advantages What SAR-MS Reveals Project Fit Workflow Technology Comparison Sample Requirements Deliverables Representative Data Case Study FAQ

Service Overview

Structure–activity relationship (SAR) analysis is the backbone of medicinal chemistry. Every analog synthesized needs to be tested for binding — and the quality of that binding data directly determines how efficiently your team can optimize potency, selectivity, and drug-like properties.

Our SAR-MS service uses native electrospray ionization mass spectrometry (native ESI-MS) to directly observe protein–ligand complexes in solution. By measuring the mass shift of the protein upon ligand binding, we determine binding affinity (Kd), binding stoichiometry, and relative affinity ranking across compound series — all from a single experiment.

We support a wide range of target classes, including kinases, proteases, protein–protein interaction targets, RNA-binding proteins, and membrane proteins (in detergent or nanodisc systems). Our team works with you to design the experimental plan, execute the measurements, and deliver actionable SAR data.

Related services: Our native ESI-MS for noncovalent complexes provides the foundational technology platform, while our ligand-observed ESI-MS binding assays offer complementary readouts for ligand-based screening.

Key Advantages

Label-Free Direct Binding Detection

No fluorescent tags, radioactive labels, or reporter assays required. We measure binding directly by detecting the mass of the protein–ligand complex — eliminating artifacts from label interference or immobilization.

Broad Affinity Range (nM to mM)

From potent leads (low nM Kd) to weak fragment hits (mM Kd), our native MS platform captures the full affinity spectrum. This is particularly valuable for fragment-to-lead programs where early hits often bind weakly.

Compound Rank Ordering

We deliver clear, quantitative affinity rankings within your chemical series — enabling your team to prioritize the most promising analogs for further development without ambiguity.

Binding Stoichiometry Information

Native MS reveals not just whether a ligand binds, but how many ligands bind per protein — critical information for understanding multivalent binding, cooperativity, and target engagement.

Multi-Target Selectivity Profiling

Assess selectivity across related targets (e.g., kinase family members, FABP isoforms) in a single multiplexed experiment. Our platform handles up to 5 targets simultaneously.

Native Solution Conditions

Measurements are performed in physiological-like buffers (ammonium acetate, pH-adjusted) — preserving native protein conformation and binding behavior without the constraints of surface immobilization.

What SAR-MS Reveals

Our SAR-MS platform provides a comprehensive set of biophysical measurements that directly inform structure–activity relationship decisions:

Binding Affinity (Kd): Quantitative equilibrium dissociation constants derived from titration experiments, giving your team precise binding strength measurements for each compound.

Relative Affinity Ranking: Direct comparison of binding across a compound series under identical conditions — eliminating inter-experiment variability that can confound SAR interpretation.

Binding Stoichiometry: Determination of how many ligand molecules bind per protein target — essential for understanding whether a compound engages one or multiple binding sites.

Selectivity Profile: Side-by-side comparison of compound binding across related targets or isoforms, enabling early identification of selectivity issues.

Competition Binding: Assessment of whether compounds bind at the same site as a reference ligand, providing mechanistic insight into binding mode.

Binding Kinetics (Qualitative): While our standard service focuses on equilibrium binding, we can provide kinetic insights through time-resolved native MS experiments upon request.

Project Fit

SAR-MS is most valuable in these scenarios:

Lead Optimization Support

Your team has synthesized 50–500 analogs and needs reliable binding data to guide the next design cycle. SAR-MS delivers rank-ordered affinity data within days.

Fragment-to-Lead Progression

Fragment hits (typically mM–μM binders) need to be characterized and prioritized. SAR-MS detects weak binding that SPR or functional assays may miss.

Selectivity Profiling

A lead compound shows promise but you need to assess its selectivity across a target family. Our multiplexed native MS approach screens up to 5 targets in a single experiment.

Challenging Target Classes

For targets that are difficult to immobilize (membrane proteins, protein complexes) or require specific solution conditions, SAR-MS offers a label-free alternative to SPR.

Hit Confirmation from Screening

Hits from ASMS, DEL, or fragment screening need orthogonal validation. SAR-MS provides direct biophysical confirmation with binding affinity data.

For hit identification from compound libraries, consider our native MS fragment screening service as a complementary upstream step.

Workflow

1

Project Consultation and Assay Design

We discuss your project goals, target protein characteristics, compound series, and desired data output. We design the experimental plan including buffer conditions, concentration ranges, and data analysis strategy.

2

Sample Preparation and Quality Control

Your protein is buffer-exchanged into MS-compatible volatile buffer (typically ammonium acetate, pH 6.8–8.0). Compound stocks are prepared in DMSO or compatible solvent. We verify protein integrity by intact mass measurement.

3

Native MS Data Acquisition

Samples are analyzed on a high-resolution Orbitrap mass spectrometer optimized for native MS. Protein–ligand complexes are detected in their native charge state distribution. Each compound is measured at multiple concentrations for Kd determination.

4

Data Processing and Affinity Calculation

Raw mass spectra are deconvoluted using UniDec software. Relative abundances of apo and ligand-bound protein are calculated. Kd values are determined by fitting the binding isotherm to a 1:1 binding model.

5

SAR Report Delivery

You receive a comprehensive report including native MS spectra, binding curves, Kd values, rank-ordered affinity table, and data interpretation. Raw data files are provided for your internal records.

SAR-MS workflow diagram with five technical steps.

Technology Comparison

Different biophysical methods serve different roles in SAR studies. The table below compares SAR-MS with the most commonly used alternatives to help you select the right approach for your project.

ParameterSAR-MS (Native MS)SPRITCNMRComputational SAR
Label requirementLabel-freeLabel-free (immobilization required)Label-freeLabel-free (isotope labeling for protein)None (in silico)
Affinity rangenM – mMpM – mMnM – mMμM – mMPredictive (variable accuracy)
Throughput (compounds/week)50–20020–1005–2010–501000+
Binding stoichiometryYes (direct readout)IndirectYesYesNo
Protein consumption per compoundLow (1–5 μg)Low–Medium (5–20 μg)High (50–200 μg)High (100–500 μg)None
Solution conditionsVolatile buffer (native-like)Surface-dependentFree solutionFree solutionN/A

Selection guidance: For rapid rank ordering of analog series with minimal protein consumption, SAR-MS offers the best balance of throughput, information content, and cost. SPR is preferred when full kinetic data (kon/koff) is required. ITC provides thermodynamic parameters (ΔH, ΔS) but at much lower throughput. NMR excels at detecting weak binders and providing structural information. Computational SAR is useful for virtual screening but requires experimental validation.

For complementary approaches, see our affinity selection mass spectrometry (AS-MS) service for hit identification, and ion mobility MS (IM-MS) for conformational analysis of protein–ligand complexes.

Sample Requirements

Sample CategoryRecommended AmountPurityBufferSubmission Notes
Purified protein≥50 μg per target≥90% by SDS-PAGEVolatile buffer (e.g., 50–200 mM NH4OAc, pH 6.8–8.0)Provide concentration and buffer composition. Avoid detergents, high salt (>500 mM), and glycerol (>10%).
Compound (small molecule)≥100 μg per compound≥95% by HPLCDMSO (preferred) or compatible solventProvide molecular weight and stock concentration. DMSO final concentration ≤2% in assay.
Compound series (analog set)≥50 μg per analog≥90% by HPLCDMSO (preferred)Provide structure data (SMILES or SDF) for each analog. We recommend 10–50 compounds per series.
Fragment library≥100 μg per fragment≥90% by HPLCDMSOFragment MW typically 150–300 Da. Provide structure data for hit deconvolution.
Control compound≥100 μg≥95% by HPLCDMSO or compatible solventProvide known binder (positive control) and non-binder (negative control) for assay validation.

Note: For membrane proteins, please contact us to discuss detergent or nanodisc system compatibility. For proteins requiring non-volatile buffer components, we can perform buffer exchange upon sample receipt.

Deliverables

  • Native MS spectra — annotated mass spectra showing apo protein and protein–ligand complex peaks for each compound
  • Binding affinity (Kd) values — equilibrium dissociation constants with confidence intervals for each compound
  • Rank-ordered affinity table — clear ranking of all tested compounds by binding affinity
  • Binding stoichiometry data — number of ligand molecules bound per protein for each compound
  • Binding curves — titration curves with fitted binding isotherms for Kd determination
  • SAR summary report — written interpretation of the SAR trends, including key findings and recommendations for next steps
  • Raw data files — mass spectrometry raw files (Thermo .raw format) and processed data for your internal records

Representative Data

SAR-MS native spectra with ligand mass shift annotations.

Figure 1: Native MS spectra of a target protein (25 kDa) titrated with three analogs from a lead optimization series.

Mass shifts of 320 Da (Compound A), 335 Da (Compound B), and 298 Da (Compound C) confirm 1:1 binding. Relative abundance of the bound species correlates with binding affinity.

Case Study: Native MS Distinguishes Structurally Similar Enzyme Inhibitors in ED-MS Workflow

Vlahakis NW, Flowers CW, Liu M, et al. Combining MicroED and native mass spectrometry for structural discovery of enzyme–small molecule complexes. Proc Natl Acad Sci USA. 2025;122(31):e2503780122. https://doi.org/10.1073/pnas.2503780122

Background

Determining the three-dimensional structures of enzyme–small molecule complexes is essential for understanding binding modes and guiding SAR. However, when multiple structurally similar ligands are present — as in natural product extracts or biosynthetic reaction mixtures — distinguishing which ligand is bound can be challenging by crystallography alone.

Methods

Vlahakis et al. developed an integrated ED-MS workflow combining microcrystal electron diffraction (MicroED) with native mass spectrometry (nMS). Papain microcrystals were soaked with E-64 (a natural covalent cysteine protease inhibitor, MW 357.20 Da) and its biosynthetic analog E-64-A65 (MW 369.23 Da). After MicroED data collection, the same TEM grids were recovered, crystals were dissolved in 150 mM ammonium acetate, and the resulting solution was analyzed by native MS on a Thermo Q Exactive Plus UHMR Orbitrap.

Results

Native MS clearly distinguished the two inhibitors by their characteristic mass shifts: E-64 produced a 357 Da mass shift (Fig. 3D), while E-64-A65 produced a 369 Da mass shift (Fig. 3F). This mass difference of 12 Da — corresponding to a single carbon atom — was unambiguous by MS but would have been difficult to resolve by electron density alone. The MicroED structures at 2.3 Å (E-64) and 2.5 Å (E-64-A65) resolution confirmed the binding mode, with the nMS data providing definitive ligand identification. Time-course experiments showed that 10 min of soaking achieved >80% occupancy (Fig. 2F–H).

Conclusion

The ED-MS approach demonstrates how native MS serves as a critical orthogonal technique for unambiguous ligand identification in protein–ligand complex structures — a capability directly applicable to SAR-MS workflows where distinguishing closely related analogs is essential for accurate SAR interpretation.

ED-MS workflow combining MicroED and SAR-MS native mass spectrometry.

ED-MS workflow combining MicroED and native mass spectrometry for enzyme–small molecule complex structural discovery.

FAQ

Frequently Asked Questions

Q: What throughput can I expect for SAR-MS analysis?

Our standard SAR-MS workflow handles 50–200 compounds per week, depending on the number of concentration points and replicates required. For larger compound sets, we can design tiered screening strategies to maximize efficiency.

Q: What is the sensitivity range for binding affinity measurement?

We reliably detect binding from low nanomolar (Kd ~1 nM) to low millimolar (Kd ~5 mM). The lower limit depends on protein size, ionization efficiency, and complex stability during ESI — we'll discuss this during project planning.

Q: How do you handle data interpretation and reporting?

Each project includes a comprehensive SAR report with annotated mass spectra, binding curves, Kd values, and a rank-ordered affinity table. Our scientists provide written interpretation of SAR trends and are available to discuss results with your team.

Q: What types of protein targets are compatible with SAR-MS?

We have worked with soluble proteins (kinases, proteases, phosphatases), protein–protein interaction targets, RNA-binding proteins, and membrane proteins in detergent micelles or nanodiscs. Contact us to discuss your specific target.

Q: How does SAR-MS compare with SPR for SAR studies?

SPR provides full kinetic data (kon/koff) but requires surface immobilization, which can alter protein conformation or block binding sites. SAR-MS measures binding in free solution without immobilization artifacts, offering higher throughput with lower protein consumption. We recommend SPR when kinetic parameters are essential, and SAR-MS for rapid rank ordering and stoichiometry determination.

Q: What is the typical turnaround time for a SAR-MS project?

For standard projects (10–50 compounds), results are typically delivered within 5–10 business days from sample receipt. Larger projects or those requiring method development may take 2–3 weeks.

Reference

  1. Vlahakis NW, Flowers CW, Liu M, et al. Combining MicroED and native mass spectrometry for structural discovery of enzyme–small molecule complexes. Proc Natl Acad Sci USA. 2025;122(31):e2503780122. https://doi.org/10.1073/pnas.2503780122
  2. Sternicki LM, Poulsen SA. Fragment-based drug discovery campaigns guided by native mass spectrometry. RSC Med Chem. 2024;15(7):2275–2287. https://doi.org/10.1039/d4md00273c
  3. Fiorentino F, Rotili D, Mai A. Native mass spectrometry-directed drug discovery: Recent advances in investigating protein function and modulation. Drug Discov Today. 2023;28(5):103548. https://doi.org/10.1016/j.drudis.2023.103548

Ready to Accelerate Your SAR Program?

Get direct binding data for your compound series — no labels, no immobilization, no delays.

This service and all related deliverables are for research use only. Not for clinical diagnostic use.

Online Inquiry

Please submit a detailed description of your project. We will provide you with a customized project plan to meet your research requests. You can also send emails directly to for inquiries.

* Email
Phone
* Service & Products of Interest
Services Required and Project Description