Single-cell MS Drug Profiling Service

Reveal drug action at single-cell resolution — directly measure drug uptake, metabolism, and phenotypic response from individual cells using high-sensitivity mass spectrometry.

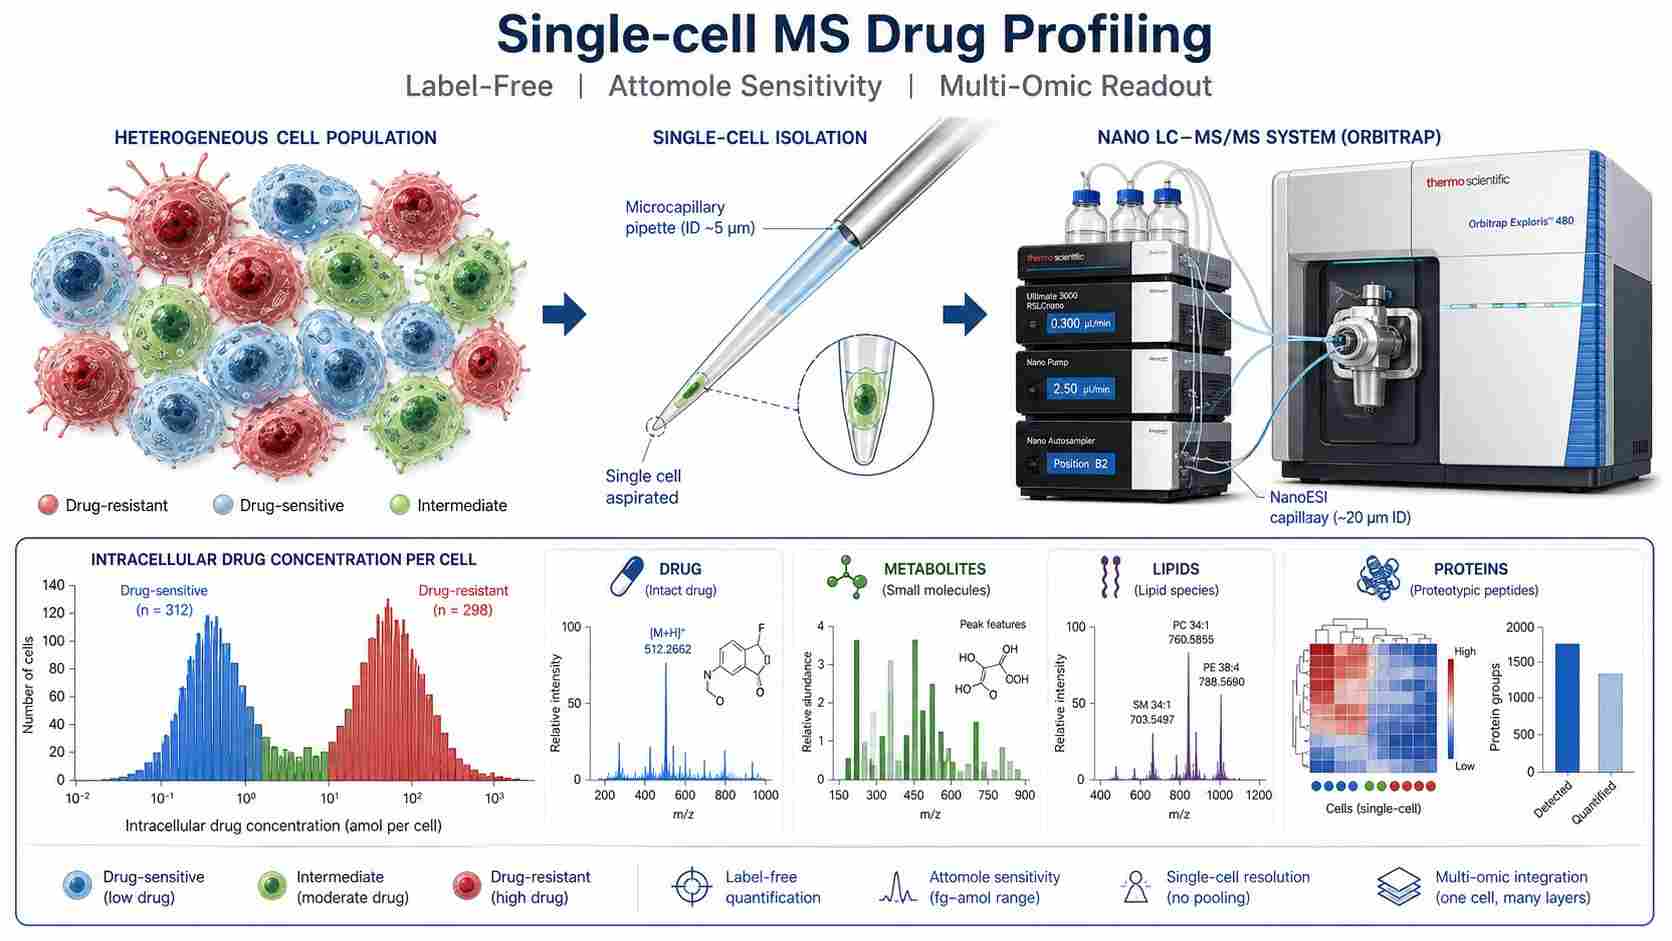
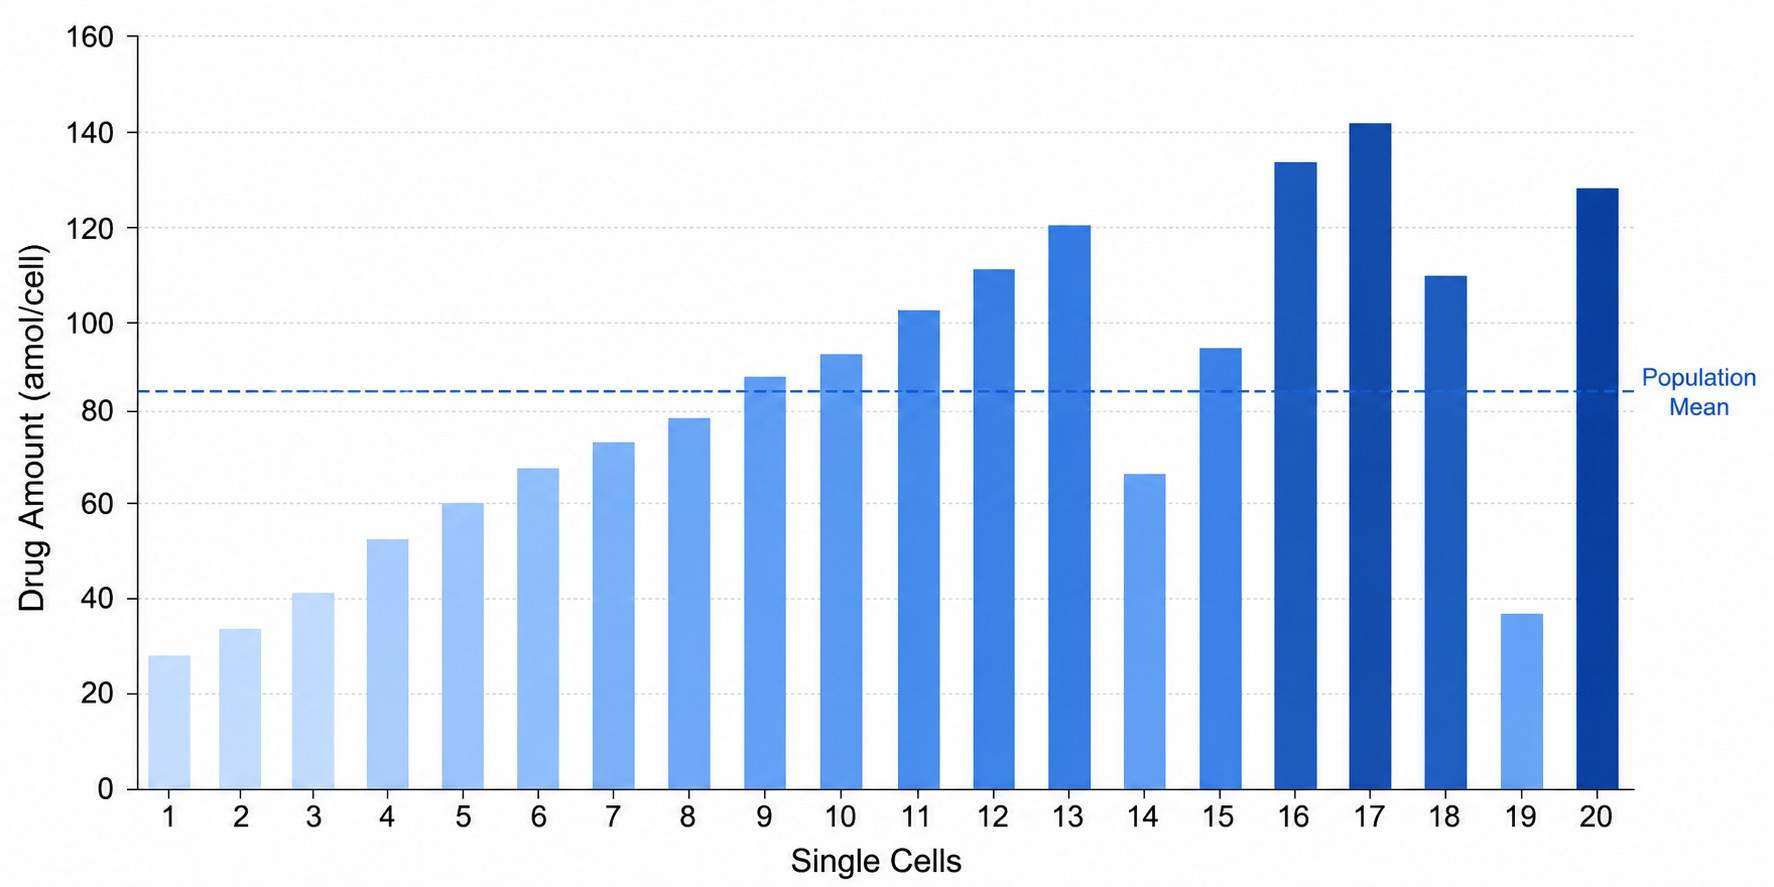
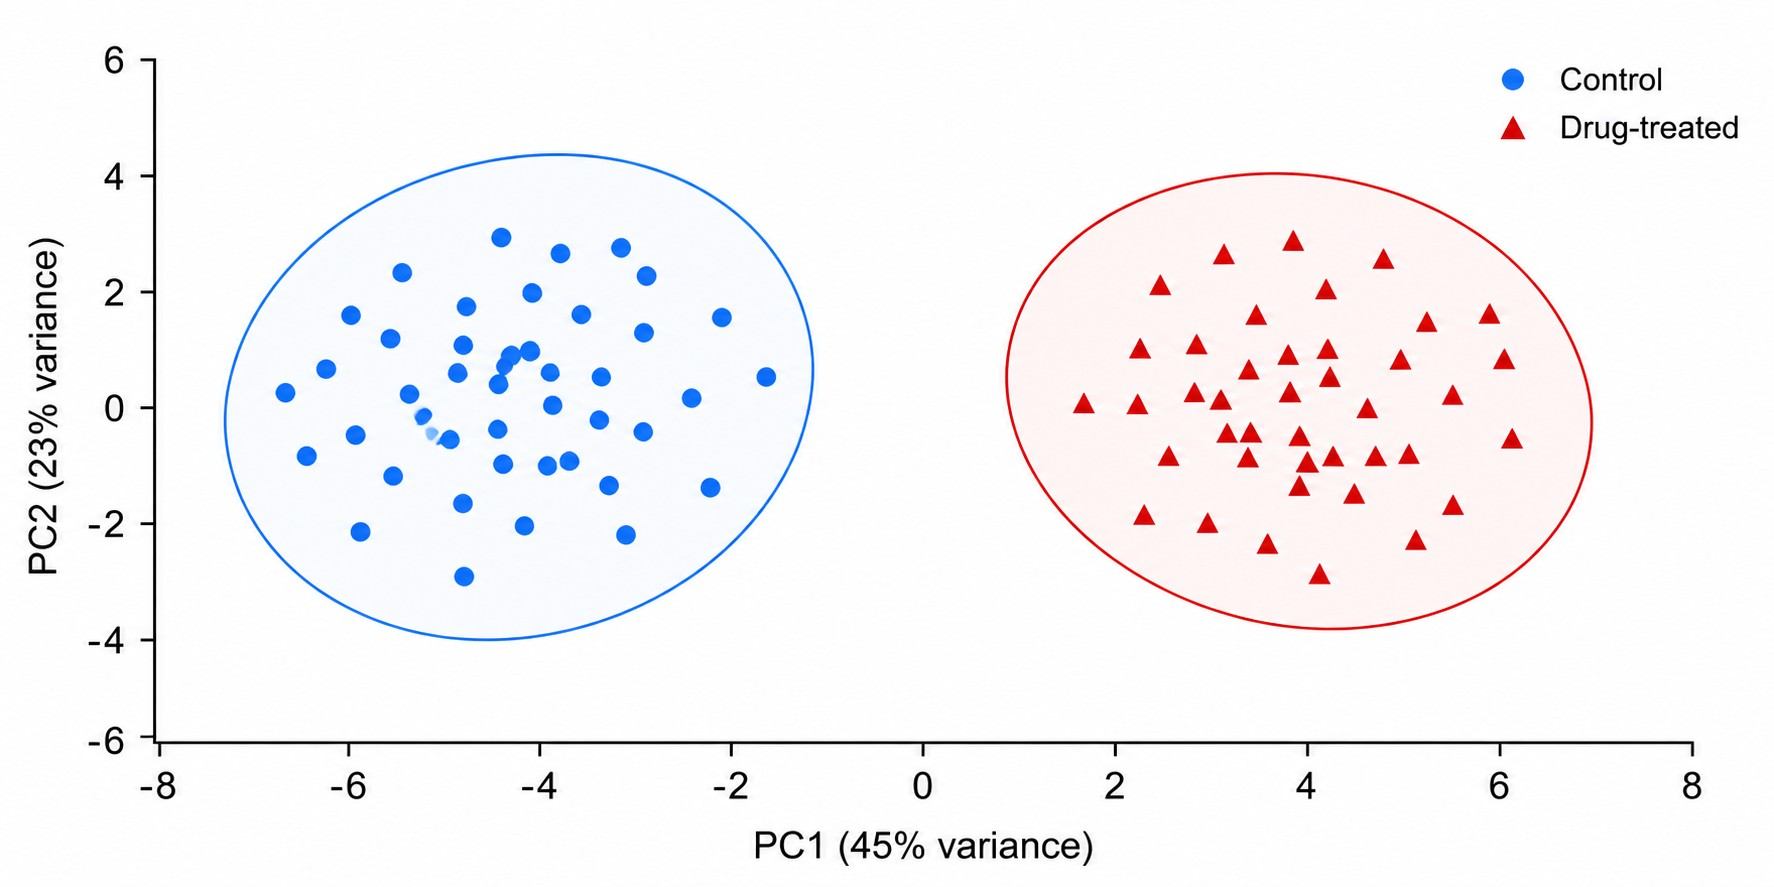
Single-cell mass spectrometry (scMS) drug profiling lets you quantify drugs, metabolites, lipids, and proteins from individual cells — not just population averages. While bulk assays report a single mean value that masks what individual cells are doing, scMS reveals the true heterogeneity of drug action: the drug-resistant subpopulation hiding in plain sight, the cell that metabolizes the drug differently from its neighbors, the rare cell that escapes target engagement.

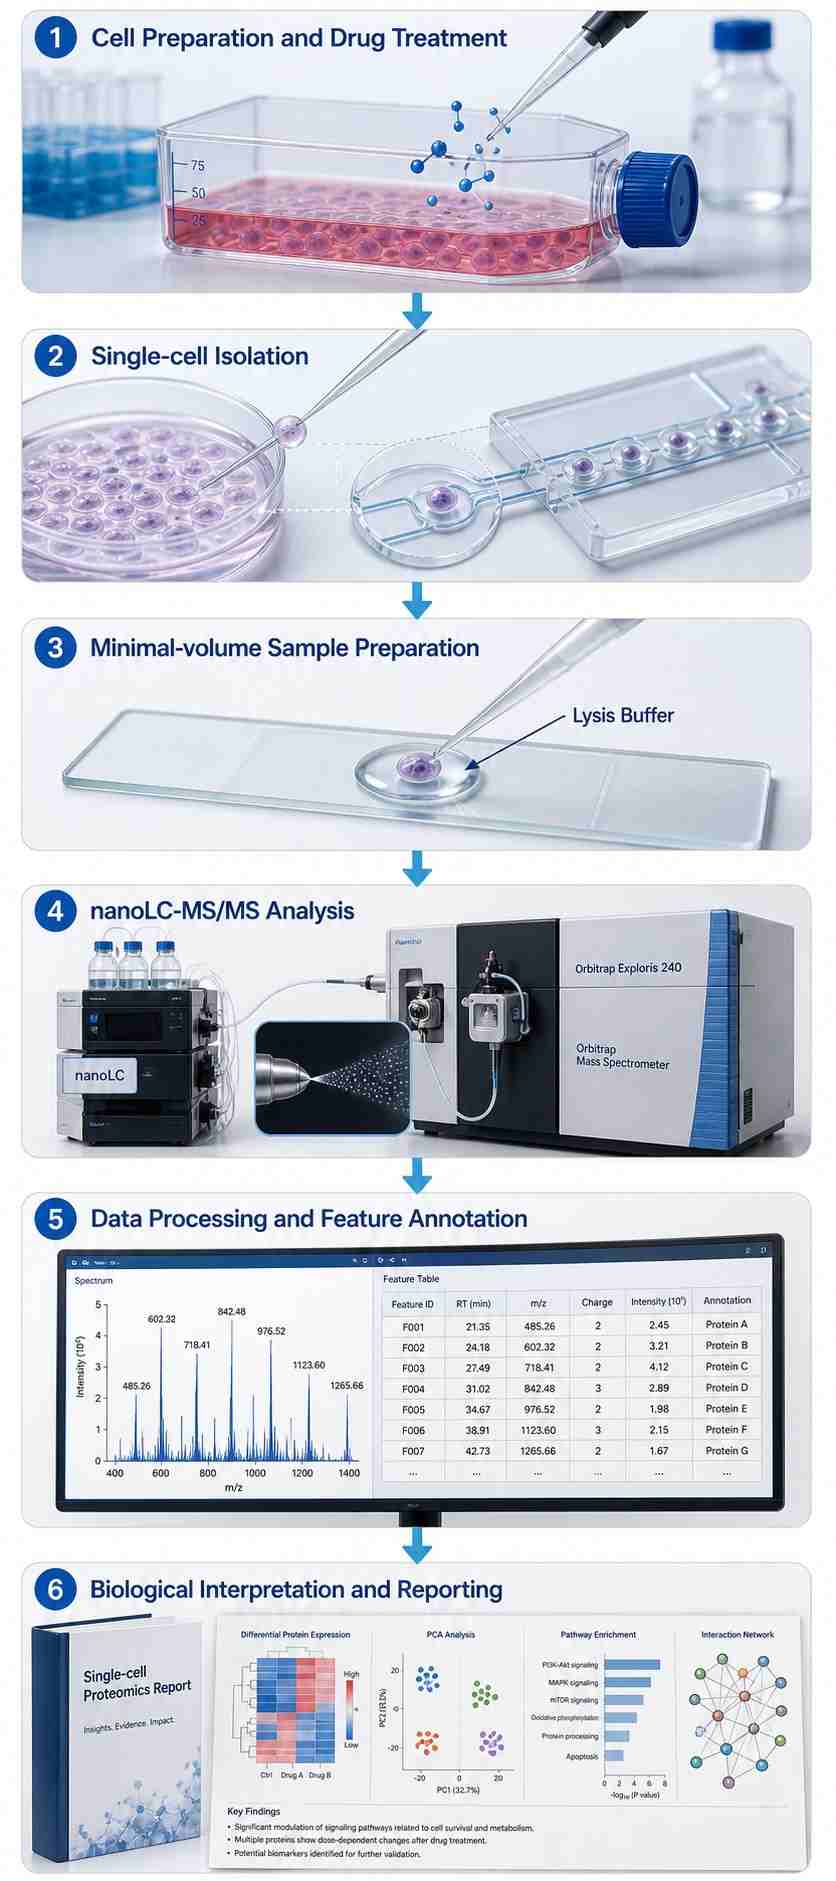
At Creative Proteomics, our MassTarget™ platform combines advanced single-cell isolation with high-sensitivity nanoLC-MS/MS to deliver label-free drug profiling at single-cell resolution. Whether you are investigating chemoresistance mechanisms, mapping cell-specific pharmacokinetics, or building a multi-omic picture of drug response, our service provides the analytical depth to support informed discovery decisions.

Key Advantages:

  • Attomole-level drug detection from individual mammalian cells
  • Multi-omic readout: drugs, metabolites, lipids, and proteins from the same cell
  • Label-free — no antibody panels, genetic reporters, or radioactive tracers
  • Validated across adherent, suspension, and tissue-derived cell types
Single-cell MS drug profiling platform showing single-cell isolation from a heterogeneous cell population, nanoLC-MS/MS analysis, and single-cell resolution data output including drug distribution histogram and multi-omic readout panels.
What Is Single-cell MS Why Choose Single-cell MS Service Overview Workflow Demo Technology Comparison Sample Bioinformatics Case Study FAQ

What Is Single-cell MS Drug Profiling?

Single-cell mass spectrometry drug profiling measures drug molecules and their downstream biological effects one cell at a time. The core workflow is straightforward: isolate single cells from a treated population, prepare each cell with minimal-volume extraction, and analyze the contents by high-sensitivity mass spectrometry.

What makes this approach fundamentally different from conventional pharmacology is its ability to resolve heterogeneity. A bulk experiment on 10,000 cells might report a mean drug concentration of 100 amol/cell — but that average could hide a bimodal distribution where 30% of cells accumulate 250 amol/cell while 70% carry only 30 amol/cell. Those subpopulations matter clinically: the high-accumulation cells may be more vulnerable to toxicity, while the low-accumulation cells could represent a reservoir of drug resistance.

Single-cell MS addresses this by measuring each cell individually. The result is a distribution — of drug concentrations, metabolite levels, protein expression — across the population. This distributional view is essential for understanding drug action in heterogeneous tissues like tumors, where clonal subpopulations with distinct drug sensitivities coexist within the same microenvironment.

Why Choose Single-cell MS for Drug Profiling?

Bulk LC-MS, fluorescence assays, and radiolabeled drug studies all have their place. But none of them can tell you what individual cells are doing — and that blind spot matters more than most researchers realize.

Reveals drug-resistant subpopulations

In cancer chemotherapy, a small fraction of cells can survive treatment even when the mean drug exposure looks adequate. Single-cell MS identifies these cells directly by measuring drug accumulation per cell, distinguishing truly resistant cells from those that simply received insufficient drug.

Direct, label-free quantification

Unlike CyTOF (which needs heavy-metal-tagged antibodies) or fluorescence imaging (which needs labeled drug analogs), we measure the unmodified drug molecule itself. No concerns about labels interfering with drug activity, cellular uptake, or metabolism.

Multi-omic readout from the same cell

A single nanoLC-MS/MS run can simultaneously quantify the parent drug, its known and unknown metabolites, endogenous signaling metabolites, lipids, and (with proteomics workflows) proteins. This gives you a systems-level view of drug action at single-cell resolution.

Complements transcriptomic data

scRNA-seq tells you which genes are expressed — but not the drug concentration, metabolite levels, or protein activity in those cells. Single-cell MS fills that gap, providing the functional and pharmacological dimension that transcriptomics alone cannot reach.

For teams investigating drug resistance, cell-specific pharmacology, or heterogeneous tumor responses, single-cell MS drug profiling delivers analytical capability that no other technique matches. Our cellular lipidomics drug profiling and drug-resistance mechanism MS services extend this to specific biological questions.

Service Overview — Single-cell MS Drug Profiling at Creative Proteomics

Our single-cell MS drug profiling service runs on the MassTarget™ multi-modal MS screening platform. We offer several service modes, each designed for a different research question:

Mode 1 — Drug Uptake & Accumulation Profiling

We quantify the amount of drug in individual cells after treatment. Use this for studying drug permeability, efflux transporter activity, and the relationship between drug accumulation and cellular response. Time-course experiments track uptake and retention kinetics at single-cell resolution.

Mode 2 — Drug Metabolism Analysis

We detect parent drugs and their metabolites simultaneously in individual cells. High-resolution MS identifies known metabolites and reveals unexpected biotransformation products. This mode is especially valuable for understanding cell-type-specific drug metabolism and how metabolic activation or detoxification shapes drug response.

Mode 3 — Proteomic Drug Response Profiling

We measure protein expression changes across hundreds of individual cells after drug treatment. This reveals how different cells within the same population respond to identical drug exposure at the proteome level — identifying pathways of resistance, adaptation, and cell death.

Mode 4 — Metabolomic & Lipidomic Drug Response

We profile the global metabolome and lipidome of individual cells after drug treatment. This captures the metabolic consequences of drug action — changes in energy metabolism, oxidative stress, lipid signaling, biosynthesis — that may not show up in proteomic data alone.

Mode 5 — Custom Pharmacology Study Design

For questions that do not fit standard modes, our scientists design a tailored strategy. This may include combination drug studies, time-series experiments, multi-omic integration, or specialized cell models such as patient-derived organoids or primary cells.

Each mode is supported by our cell-based MS screening, cellular metabolomics screening, and cell permeability MS capabilities, so your single-cell data integrates seamlessly with broader drug discovery campaigns.

Our workflow is built for robustness, reproducibility, and minimal sample loss. Here is how it works:

1

Cell Preparation and Drug Treatment

We culture cells under standard conditions, treat them with your drug(s) at specified concentrations and time points, and harvest them for single-cell analysis. We work with your established protocols to keep the biology relevant.

2

Single-cell Isolation

Individual cells are isolated by microcapillary manipulation, microfluidic sorting, or laser capture microdissection — whichever fits your cell type and experimental needs. Isolation efficiency exceeds 90% for most cell types, and viability is maintained throughout.

3

Minimal-volume Sample Preparation

Each single cell undergoes lysis and extraction in sub-microliter volumes to maximize analyte recovery. For metabolomic and lipidomic analysis, we extract in cold organic solvents to preserve labile metabolites. For proteomic analysis, we use a dedicated single-cell digestion protocol.

4

nanoLC-MS/MS Analysis

Extracted samples run on nanoflow LC coupled to high-resolution tandem MS (Orbitrap or Q-TOF). The nanoLC system delivers the sensitivity needed for attomole-level detection, while HRMS ensures confident identification of drugs, metabolites, and endogenous molecules.

5

Data Processing and Feature Annotation

Raw data goes through our bioinformatics pipeline: feature detection, alignment, normalization, statistical analysis. Drugs and metabolites are identified by accurate mass, retention time, and MS/MS matching against in-house and public databases.

6

Biological Interpretation and Reporting

We visualize and interpret the data to answer your specific research question. Deliverables include per-cell intensity tables, heterogeneity metrics, statistical comparisons, pathway enrichment, and a comprehensive project report.

Representative Demo Data

Bar chart showing drug uptake heterogeneity across 20 individual cancer cells, with drug amount per cell ranging from 28 to 142 amol/cell and population mean at 85 amol/cell.

Drug Uptake Heterogeneity Across Single Cells

PCA plot showing clear separation between control and drug-treated single cells based on metabolomics data, with PC1 and PC2 accounting for 68% of total variance.

Metabolic Profile Shift After Drug Treatment

Heatmap of metabolite changes across individual single cells ordered by intracellular drug concentration, showing dose-dependent metabolic response with high-accumulation cells showing pronounced perturbations.

Correlation Between Drug Concentration and Metabolic Response

Technology Comparison: Single-cell MS vs. Alternative Approaches

FeatureSingle-cell MS (scMS)CyTOF (Mass Cytometry)scRNA-seqBulk LC-MS
Analyte typesDrugs, metabolites, lipids, proteinsPre-selected proteins (antibody panel)mRNA transcriptsDrugs, metabolites, proteins (population average)
Label requirementNone (label-free)Heavy-metal-tagged antibodiesReverse transcription + amplificationNone (label-free)
Single-cell resolutionYes (true single-cell)Yes (true single-cell)Yes (true single-cell)No (population average)
Drug quantificationDirect (parent drug + metabolites)No (cannot detect small molecules)No (cannot detect drugs)Direct (population average)
Multi-omic readoutYes (drug + metabolome + proteome)Limited (proteins only)Transcriptome onlyYes (population average)
Throughput50–200 cells per experiment10⁵–10⁶ cells per run10³–10⁴ cells per runN/A (bulk)
Sample preparationMinimal-volume extractionAntibody staining (extensive)Library preparation (extensive)Bulk extraction (simple)

Which method should you choose? Single-cell MS is the right call when you need direct drug measurements at single-cell resolution — especially when multi-omic readout (drug + metabolites + proteins) from the same cells matters. CyTOF works better for high-throughput protein profiling with pre-defined panels. scRNA-seq is the tool for transcriptomic discovery. Bulk LC-MS handles population-level pharmacokinetics. For drug resistance studies, cell-specific metabolism, or mechanism-of-action questions at single-cell resolution, scMS provides information no other method can deliver.

Our live-cell MS profiling and drug uptake and retention MS services complement this capability for related applications.

Sample Requirements

Sample TypeMinimum Cell NumberViabilityFormatDrug TreatmentNotes
Adherent cells≥ 50 cells≥ 85%T25/T75 flask, 70–80% confluentOptional (client can pre-treat)Provide culture conditions and passage number
Suspension cells≥ 100 cells≥ 85%Cell suspension in mediumOptionalProvide cell density and medium composition
Tissue-derived cells≥ 20 cells≥ 70%Single-cell suspension in PBSNot applicableRequires dissociation protocol details
Frozen cell pellets≥ 200 cellsN/ADry ice or liquid nitrogenOptionalAvoid freeze-thaw cycles

Note: For pilot or feasibility studies, we can work with as few as 10–20 cells to assess signal quality and detection limits before scaling up. Contact our team to discuss your specific sample type and experimental design.

Platform Instrumentation

Creative Proteomics’ single-cell MS platform integrates advanced nanoLC chromatography, high-resolution mass spectrometry, and bioinformatics systems to support sensitive and reproducible single-cell drug profiling workflows.

Module CategoryInstrument / SystemCore CapabilityWhy It Matters
Single-cell IsolationMicrocapillary / Microfluidic / LCMSingle-cell capture with >90% efficiencyMinimizes sample loss and preserves viability
ChromatographynanoLC (nanoACQUITY / EASY-nLC)Nanoflow separation at sub-microliter flow ratesAttomole-level sensitivity for single-cell samples
Mass SpectrometryOrbitrap / Q-TOF (e.g., Q Exactive, Xevo G3 QTof)High-resolution, accurate-mass detectionConfident drug and metabolite identification
InformaticsProteoWizard, MZmine, XCMSFeature detection, alignment, normalization, statisticsScalable single-cell data processing pipeline

Case Study: Single-cell Level Drug Screening with Concentration Gradient Profiling

Shen S, Zhang F, Zhang Y, Li Y, Niu Y, Pang L, Wang J. "Construction of multiple concentration gradients for single-cell level drug screening." Microsystems & Nanoengineering 9, 46 (2023). https://doi.org/10.1038/s41378-023-00516-0

Background

Most single-cell drug screening platforms test drugs at a single concentration, which limits their ability to generate dose-response information. The authors set out to build an integrated microfluidic device that could generate multiple concentration gradients while capturing single cells for parallel screening.

Methods

The team designed a microfluidic chip combining a Tai Chi-spiral mixer (which uses Dean flow for rapid, uniform mixing) with an H-shaped single-cell capture array. The mixer generated stable linear concentration gradients across five output channels. Single cells were captured in H-shaped microstructures with >90% efficiency, sorted by size and deformability. They tested two chemotherapeutics — 5-fluorouracil (5-FU) and cisplatin (DDP) — against HepG2 liver cancer cells and MCF-7 breast cancer cells.

Results

Both drugs inhibited cancer cell growth in a dose-dependent manner at single-cell resolution, visualized by AO/PI fluorescence staining (Fig. 4). Notably, smaller and/or more deformable tumor cells showed greater drug resistance, suggesting that biophysical heterogeneity at the single-cell level correlates with differential drug sensitivity. Combination therapy (5-FU + DDP) outperformed either drug alone, demonstrating the platform's value for evaluating combination regimens at single-cell resolution.

Conclusions

This integrated microfluidic platform provides a robust system for single-cell drug screening with multi-concentration dose-response capability. The work shows that single-cell drug profiling reveals heterogeneity in drug sensitivity that bulk assays miss, and that biophysical properties like cell size and deformability may predict drug response. The approach has broad applicability for chemotherapy screening, resistance studies, and personalized medicine.

Microfluidic chip design for single-cell level drug screening with multi-concentration gradient generation and single-cell capture array.

Fig. 4: Response of tumor cells in single-cell capture structures to multiple-gradient dosages of 5-FU and cisplatin. (Adapted from Shen et al., Microsystems & Nanoengineering, 2023).

FAQ

Frequently Asked Questions

Q: What is single-cell MS drug profiling and how does it differ from bulk-cell pharmacology?

Single-cell MS drug profiling measures drug uptake, metabolism, and response at the level of individual cells, revealing the heterogeneity that bulk assays average away. While bulk LC-MS gives the mean drug concentration across thousands of cells, scMS shows the distribution — identifying subpopulations with high or low drug accumulation that may drive resistance or toxicity.

Q: What is the sensitivity of single-cell MS for drug detection?

Modern nanoLC-MS/MS platforms achieve attomole-level sensitivity, sufficient to detect most small-molecule drugs, their metabolites, and endogenous signaling molecules from a single mammalian cell. Detection limits depend on the drug's ionization efficiency and the complexity of the cellular matrix.

Q: How many cells are needed for a single-cell MS drug profiling experiment?

A typical experiment requires 50–200 single cells per condition, depending on the biological question and the number of analytes being measured. Pilot experiments can be conducted with as few as 20 cells to assess feasibility.

Q: What types of drugs can be analyzed by single-cell MS?

Most small-molecule drugs (MW 200–1000 Da) are compatible, including chemotherapeutics, kinase inhibitors, antibiotics, and natural products. For drugs with poor ionization, derivatization strategies can be employed. Large biologics (antibodies, proteins) require different MS approaches (top-down or middle-down proteomics).

Q: Can single-cell MS distinguish parent drug from metabolites in individual cells?

Yes. High-resolution MS (HRMS) enables simultaneous detection of parent drugs and their known or unknown metabolites based on accurate mass and fragmentation patterns. This provides a comprehensive view of cell-specific drug metabolism.

Q: What data deliverables can I expect from a single-cell MS drug profiling project?

Deliverables include: (1) raw MS data files, (2) processed feature tables with drug/metabolite intensities per single cell, (3) statistical analysis (heterogeneity metrics, PCA, clustering), (4) visualization plots (bar charts, heatmaps, PCA), and (5) a project report with methods and biological interpretation.

Q: How does single-cell MS drug profiling compare with CyTOF or scRNA-seq for drug studies?

CyTOF requires heavy-metal-tagged antibodies and can only measure pre-selected proteins. scRNA-seq measures transcripts, not drugs or metabolites. Single-cell MS uniquely provides direct, label-free quantification of the drug molecule itself, its metabolites, and downstream endogenous molecules — all from the same cell.

References

  1. Shen S, Zhang F, Zhang Y, Li Y, Niu Y, Pang L, Wang J.Construction of multiple concentration gradients for single-cell level drug screening. Microsystems & Nanoengineering 9, 46 (2023).
  2. Lee S, Vu HM, Lee JH, Lim H, Kim MS.Advances in mass spectrometry-based single cell analysis. Biology. 2023;12(3):395.
  3. Momenzadeh A, Meyer JG.Single-cell proteomics using mass spectrometry. Cell Genomics. 2025;5:100229.

Plan a single-cell drug profiling campaign with the MassTarget™ team

Share your cell model and drug targets — our scientists will design a tailored single-cell MS drug profiling strategy for your discovery program.

Online Inquiry

Please submit a detailed description of your project. We will provide you with a customized project plan to meet your research requests. You can also send emails directly to for inquiries.

* Email
Phone
* Service & Products of Interest
Services Required and Project Description