NanoESI High-Throughput Mass Spectrometry Service

Ultra-low flow nanoelectrospray ionization with automated high-throughput sample delivery. Our nanoESI HT-MS service delivers high-sensitivity analysis from 1–5 µL sample volumes — 100–1000× less than conventional ESI — while maintaining 100–500 samples per day throughput.

Every microliter of your sample matters when the protein is difficult to express, the compound is the product of a multi-step synthesis, or the clinical specimen is irreplaceable. Our nanoESI high-throughput mass spectrometry service changes that equation, operating at 20–500 nL/min to consume 100–1000 times less sample than conventional ESI while delivering equal or better sensitivity through more efficient ionization and ion transmission.

Key Advantages:

  • nL/min flow rates — consume 100–1000× less sample than conventional ESI
  • Higher ionization efficiency from smaller initial droplets
  • Reduced ion suppression in complex matrices
  • Automated sample delivery for 100–500 samples per day throughput
  • Compatible with Orbitrap, Q-TOF, and triple quadrupole platforms
  • Ideal for limited samples: preclinical PK, rare matrices, expensive compounds
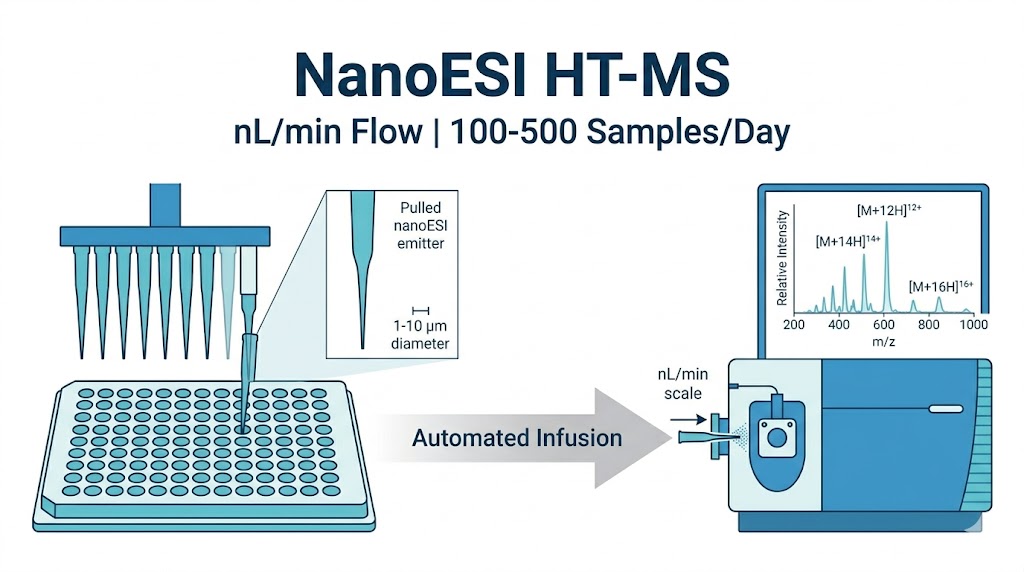
NanoESI HT-MS showing nanospray emitter with automated sample delivery from microtiter plate into mass spectrometer for high-throughput analysis.
Overview Applications Workflow Demo Sample Data & Analysis Why Choose Case Study FAQ

Ultra-Low Flow Nanoelectrospray for Maximum Sensitivity

Every microliter of your sample matters when the protein is difficult to express, the compound is the product of a multi-step synthesis, or the clinical specimen is irreplaceable. Conventional electrospray ionization consumes 5–50 µL per minute — and for many sample-limited projects, that flow rate determines how many experiments you can run, not how many you need. Our nanoESI high-throughput mass spectrometry service changes that equation. Operating at 20–500 nL/min, nanoESI consumes 100–1000 times less sample than conventional ESI while delivering equal or better sensitivity. The reason is physical: at low flow rates, the initial electrospray droplets are much smaller, requiring fewer droplet fission events to produce gas-phase ions, which translates directly into higher ionization efficiency and better ion transmission.

The nanoESI source uses a pulled glass or fused silica emitter with a tip diameter of 1–10 µm. At these dimensions, the electrospray forms spontaneously without pneumatic assistance. The small initial droplets — approximately 100–200 nm diameter versus 1–5 µm in conventional ESI — mean that the majority of analyte molecules in each droplet are ionized and transmitted to the MS, rather than lost to incomplete desolvation. This improved ionization efficiency is the primary reason nanoESI achieves its sensitivity advantage: for a given concentration, a larger fraction of analyte molecules is converted into gas-phase ions and detected.

For high-throughput operation, we use automated sample delivery systems — chip-based multi-nozzle arrays or robotic autosamplers — to process samples sequentially. Each sample infuses for 30–120 seconds while we acquire full-scan MS or targeted SRM data. Between samples, the system exchanges the tip and washes the fluid path, eliminating carryover. The workflow enables 100–500 samples per day on a single instrument. The combination of ultra-low flow rates and automation makes nanoESI HT-MS ideal for applications where both sensitivity and throughput are required simultaneously.

High-Throughput Applications in Drug Discovery

APPLICATION 1

Compound Library Screening with Minimal Sample Consumption

When screening compound collections against difficult-to-express target proteins, every milligram of protein conserved is an experiment saved. NanoESI HT-MS enables screening of 100–500 compounds per day using 1–5 µL of sample per compound at concentrations as low as 1–10 µM. The direct infusion format eliminates LC method development per compound, and the reduced ion suppression improves detection confidence for weak binders. For direct binding assays, the gentle nanoESI conditions help preserve non-covalent protein-ligand complexes. For related label-free screening approaches, see our electrosonic spray MS service.

APPLICATION 2

Enzyme Kinetics and Inhibition with Limited Enzyme

NanoESI's low flow rate extends the effective analysis time from a limited sample volume, making it particularly effective for continuous monitoring of enzyme reactions. A 20 µL reaction volume infused at 100 nL/min provides over three hours of continuous data acquisition — enough to capture full progress curves for multiple substrate concentrations or inhibitor conditions. We have applied this to kinases, phosphatases, and CYP450 enzymes, using 10–100-fold less enzyme per curve than conventional ESI methods.

APPLICATION 3

Metabolite and Lipid Profiling from Limited Biofluids

For preclinical studies where total plasma volume is 50–100 µL (mouse, zebrafish larvae) or for clinical samples where volume is restricted (pediatric, CSF), nanoESI HT-MS provides comprehensive metabolome coverage from 1–5 µL of biofluid. The enhanced ionization efficiency at low flow rates partially compensates for reduced absolute analyte quantity, and the automated workflow ensures consistent acquisition across multi-batch studies. For complementary techniques, see our paper spray MS and microfluidic chip–MS services.

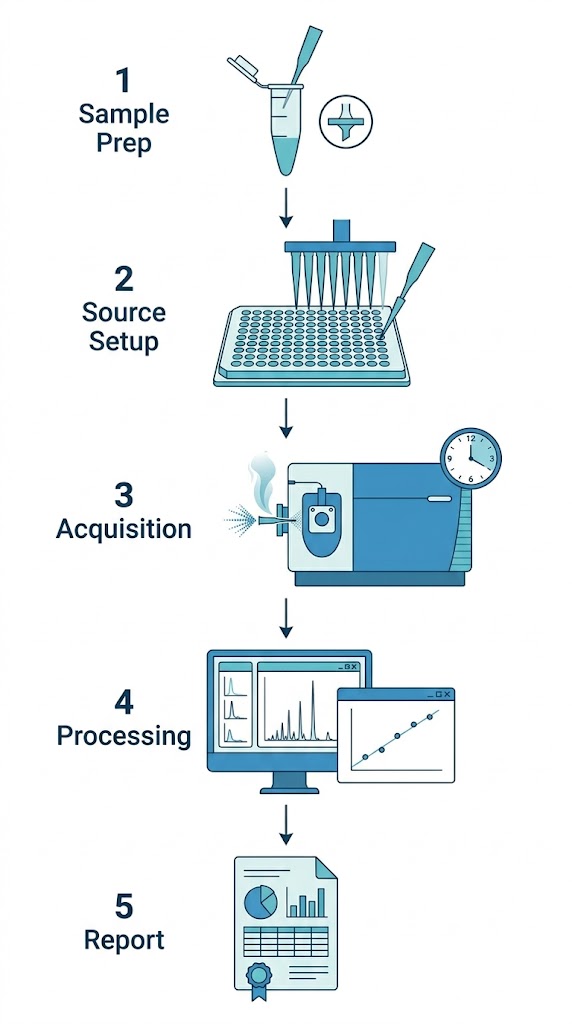
Our NanoESI HT-MS Workflow

Five steps from sample preparation to delivered results.

1

Sample Preparation

Your sample is prepared in an ESI-compatible solvent — 50–80% organic with 0.1% formic acid for positive mode, or ammonium acetate for native conditions. For direct infusion, samples are filtered or centrifuged to remove particulates.

2

NanoESI Source Setup

The sample is loaded into a 96- or 384-well plate. The automated system picks up a fresh conductive pipette tip for each sample, forms the nanoESI emitter, and applies voltage (1–2 kV) to initiate stable spray.

3

Automated Acquisition

Each sample infuses for 30–120 seconds at 100–500 nL/min. We acquire full-scan MS at high resolution (Orbitrap, 70,000) or targeted SRM. A blank injection runs every 10 samples for background monitoring.

4

Data Processing

Raw data is processed using vendor software. For quantitative analysis, extracted ion chromatograms are integrated. For metabolomics, peak picking uses MZmine or XCMS. Protein data uses deconvolution algorithms.

5

Report Delivery

You receive processed data tables, extracted ion chromatograms (targeted) or peak lists (untargeted), calibration curves and QC summary, and a written methods summary.

Five-step vertical workflow for nanoESI HT-MS: sample prep, source setup, automated acquisition, data processing, and report delivery.

Representative Data — NanoESI HT-MS Performance

Sensitivity Comparison with Conventional ESI

Using the same peptide mixture at 1 µM, nanoESI at 100 nL/min produced 5–10 fold higher signal intensity per unit sample volume than conventional ESI at 10 µL/min. LOD improved from 50 nM to 5 nM — a 10-fold gain.

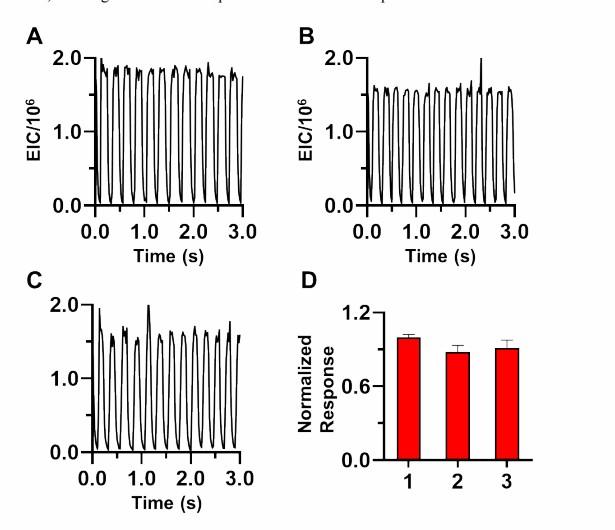
Reproducibility Across Automated Runs

In a 96-well plate analysis of a drug compound in plasma extract (100 ng/mL), intra-plate CV was 8.3% with IS normalization. Inter-plate CV across three days was 11.2%.

Linearity and Dynamic Range

Calibration curves showed R² ≥ 0.995 over 3–4 orders of magnitude. LLOQ was 1–10 ng/mL for compounds with good ionization efficiency.

Sample Requirements and Project Planning

Sample TypeVolume per InjectionConcentrationSolvent CompatibilityReplicates
Purified compound (screening)1–5 µL1–100 µM50–80% MeOH/ACN, 0.1% FA1–3
Peptide/protein digest1–5 µL10–500 fmol/µL0.1% FA, 2–5% ACN3
Plasma/serum extract2–10 µLVariable50–80% organic, 0.1% FA3
Cell lysate digest1–5 µL0.1–1 µg/µL0.1% FA, 2% ACN3
Metabolite extract2–10 µLVariable50–80% organic3
Enzyme reaction mix5–20 µL0.1–10 µM substrateMS-compatible buffer3

Planning notes: High salt (>20 mM) and detergents (>0.01%) should be minimized. Samples should be particulate-free. Method development: 1–2 days. Turnaround: 2–4 weeks.

Data Processing and Interpretation

Quantitative Analysis

Extracted ion chromatograms from each infusion event are integrated. Calibration curves use weighted linear regression with 6–8 standards. QC samples at three concentrations in triplicate are placed at beginning, middle, and end of each batch.

Untargeted Metabolomics/Lipidomics

Peak picking and alignment are followed by blank subtraction, CV filtering, and S/N filtering. Putative identifications use accurate mass matching (≤5 ppm) and MS/MS spectral matching where available.

Deliverables Package

Processed data tables (targeted) or feature lists (untargeted), calibration curves and QC summary, representative chromatograms or mass spectra, and a written methods summary with experimental conditions.

Why Choose Our NanoESI HT-MS Platform

CriterionConventional ESI-MSNanoESI HT-MS
Flow rate5–1000 µL/min20–500 nL/min
Sample consumption per run5–50 µL1–5 µL
Ionization efficiencyModerateHigh (smaller droplets)
Ion suppressionModerate-to-highReduced
Sensitivity per unit sampleBaseline5–10× higher
Automated throughput50–200 samples/day100–500 samples/day
Emitter typeSilica capillary or steelPulled glass tip or chip nozzle

What sets us apart: Dedicated nanoESI HT-MS workflow with automated chip-based sample delivery; method development for sample-limited applications; flexible platform compatibility with Orbitrap, Q-TOF, and triple quadrupole instruments; reduced sample consumption without sacrificing sensitivity.

Case Study — High-Throughput NanoESI-MS for Microfluidic Droplet Enzyme Screening

Steyer DJ, Kennedy RT. "High-Throughput Nanoelectrospray Ionization-Mass Spectrometry Analysis of Microfluidic Droplet Samples." Analytical Chemistry, 2019, 91(10), 6645–6651. DOI: 10.1021/acs.analchem.9b00571

Background

High-throughput analysis of microfluidic droplet samples by mass spectrometry has been limited by the stability and sensitivity of nanoESI at the low flow rates required for pL-nL droplet volumes. Steyer and Kennedy (2019) addressed this by developing a stable, high-throughput nESI-MS platform capable of continuous analysis of thousands of droplets without user intervention.

Methods

The platform coupled a microfluidic droplet generator to a commercial nanoESI emitter through a zero-dead-volume inline capillary connection, operating at 20-160 nL/min flow rates. Droplets containing the amine transaminase ATA-117 enzyme and substrate were generated at up to 10 droplets per second and infused directly into the nanoESI source.

Results

The system demonstrated continuous stable operation for over 2.5 hours, analyzing more than 20,000 individual droplets in a single run. The platform achieved quantitative linearity (R² = 0.998) over a 20-90 µM concentration range, with carryover below 3%. Limit of detection was 1.5 µM in 65 pL droplets (130 amol). The system successfully distinguished active enzyme droplets from negative controls.

Conclusion

This study demonstrated that automated nanoESI-MS at low nL/min flow rates can achieve the stability, throughput, and sensitivity required for practical high-throughput screening applications.

Case study showing high-throughput nanoESI-MS analysis of microfluidic droplets.

Data from Steyer & Kennedy (2019): NanoESI-MS platform for high-throughput droplet analysis.

FAQ

Frequently Asked Questions

Q: How does nanoESI differ from conventional electrospray ionization?

NanoESI operates at 20–500 nL/min versus 5–1000 µL/min for conventional ESI. The smaller emitter tip produces finer initial droplets, resulting in more efficient ionization, reduced ion suppression, and 5–10 fold better sensitivity per unit sample volume.

Q: How many samples can be analyzed per day with nanoESI HT-MS?

With automated chip-based sample delivery, 100–500 samples per day depending on acquisition time per sample (30–120 seconds per infusion).

Q: What types of compounds are suitable for nanoESI analysis?

The same compound classes that work with conventional ESI: peptides, proteins, small molecules, metabolites, lipids, and drug compounds. NanoESI is particularly advantageous for samples available in limited volume or concentration.

Q: Can nanoESI be coupled with liquid chromatography?

Yes. NanoESI is compatible with nanoLC systems operating at 200–500 nL/min for LC-MS/MS applications, offering improved sensitivity for low-abundance analytes in complex mixtures.

References

  1. Covey TR, Thomson BA, Schneider BB. "Atmospheric pressure ion sources." Mass Spectrometry Reviews, 2009, 28(6), 870–897. DOI: 10.1002/mas.20246
  2. Schmidt A, Karas M, Dülcks T. "Effect of different solution flow rates on analyte ion signals in nano-ESI MS, or: when does ESI turn into nano-ESI?" Journal of the American Society for Mass Spectrometry, 2003, 14(5), 492–500. DOI: 10.1016/S1044-0305(03)00128-4
  3. Steyer DJ, Kennedy RT. "High-throughput nanoelectrospray ionization-mass spectrometry analysis of microfluidic droplet samples." Analytical Chemistry, 2019, 91(10), 6645–6651. DOI: 10.1021/acs.analchem.9b00571
  4. Wilm M, Mann M. "Analytical properties of the nanoelectrospray ion source." Analytical Chemistry, 1996, 68(1), 1–8. DOI: 10.1021/ac9509519

Ready to maximize your sample value with nanoESI HT-MS?

Contact our team to discuss your project and receive a detailed quotation.

Disclaimer: All products and services provided by Creative Proteomics are for research use only (RUO). They are not intended for use in diagnostic, therapeutic, or clinical procedures.

Online Inquiry

Please submit a detailed description of your project. We will provide you with a customized project plan to meet your research requests. You can also send emails directly to for inquiries.

* Email
Phone
* Service & Products of Interest
Services Required and Project Description