Proximity Labeling Proteomics Service

Creative Proteomics provides Proximity Labeling Proteomics Service to help researchers identify proteins located near a bait protein, organelle, membrane region, or signaling complex in living cells.

We combine proximity-dependent labeling, streptavidin enrichment, LC-MS/MS, and bioinformatics analysis to support protein-neighborhood mapping, transient-interaction discovery, and drug-perturbed interactome studies.

With this service, we help you move from a biological question to an interpretable proximity proteomics dataset. Instead of relying only on stable protein complexes that survive extraction, proximity labeling marks nearby proteins before cell lysis. This makes it especially useful for weak, transient, spatially restricted, or condition-dependent associations.

Key service strengths

  • Map weak, transient, or spatially restricted protein neighborhoods
  • Support BioID, TurboID, miniTurbo, APEX, and APEX2 strategies
  • Compare untreated, treated, mutant, or stimulated conditions
  • Combine enrichment proteomics with LC-MS/MS data analysis
  • Deliver candidate lists, QC summaries, and interpretable result tables
Proximity labeling proteomics workflow showing bait fusion, biotin labeling, enrichment, LC-MS/MS, and bioinformatics outputs.
Protein Neighborhoods Capabilities Labeling Strategy Workflow Sample Deliverables Demo Applications Comparison Case Study FAQ References Disclaimer

Map Protein Neighborhoods That Conventional Pull-Downs May Miss

Proximity labeling proteomics identifies proteins located near a bait protein or defined cellular region. A labeling enzyme is fused to a bait protein or targeted to a compartment. After activation, nearby proteins are biotinylated, enriched with streptavidin-based capture, digested into peptides, and identified by LC-MS/MS.

This approach is useful when conventional Co-IP-MS or pull-down MS does not fully answer the question. Many signaling interactions are weak, short-lived, membrane-associated, or dependent on cellular context. These interactions can be lost during cell lysis or affinity purification.

Proximity labeling does not automatically prove direct physical binding. It identifies proteins that are close enough to be labeled under the chosen experimental conditions. For that reason, we help clients design controls, compare conditions, and prioritize candidates for follow-up validation.

What Proximity Labeling Proteomics Detects

This service can help identify:

  • Proteins near a bait protein
  • Proteins enriched around an organelle or membrane region
  • Proteins that become more or less proximal after compound treatment
  • Signaling-complex-associated proteins
  • Candidate interactors that may be missed by harsh purification conditions

When Proximity Is More Informative Than Direct Pull-Down

Proximity labeling may be a strong fit when your project involves:

  • Weak or transient protein interactions
  • Compartment-specific protein environments
  • Membrane proteins or receptors
  • Drug-induced changes in protein neighborhoods
  • Large signaling assemblies that are hard to preserve during extraction

What the Data Can and Cannot Prove

The data can support candidate discovery, protein neighborhood mapping, and condition-dependent enrichment analysis. It should be interpreted as proximity-based evidence, not as standalone proof of direct binding. For top candidates, follow-up validation may include Co-IP, targeted MS, imaging, mutagenesis, binding assays, or orthogonal chemical proteomics.

Our Proximity Labeling Proteomics Capabilities

We provide a project-focused workflow that connects experimental design, sample preparation, enrichment proteomics, LC-MS/MS, and data interpretation. Our role is not only to run mass spectrometry, but also to help you design a proximity labeling experiment that produces useful, interpretable data.

Bait-Centered Proximal Interactome Mapping

For bait-centered studies, we help map proteins enriched around your protein of interest. This can be useful for receptor neighborhoods, signaling proteins, transcriptional regulators, organelle-localized proteins, and proteins with poorly defined interaction partners.

We can support projects using client-provided constructs, cell models, enriched materials, or project designs that require feasibility discussion before sample submission.

Drug-Treated vs Control Differential Proximity Analysis

For mechanism-focused projects, proximity labeling can compare protein neighborhoods between untreated and treated conditions. This is useful when a compound may shift protein localization, disrupt a signaling complex, induce a new interaction environment, or alter pathway organization.

Typical comparisons include compound-treated vs untreated cells, mutant vs wild-type systems, stimulated vs baseline conditions, and knockdown or perturbation models vs controls.

Organelle, Membrane, and Signaling-Complex Neighborhoods

We can support compartment-focused proximity proteomics when the biological question depends on where proteins are located, not only whether they can bind in solution. Examples include mitochondria, ER, nucleus, plasma membrane, receptor microdomains, and pathway-specific signaling assemblies.

LC-MS/MS-Based Enrichment Proteomics and Data Reporting

After enrichment, proteins are processed for LC-MS/MS analysis. We provide protein identification and quantification tables, enrichment-based candidate ranking, QC summaries, and analysis-ready result files.

Project Feasibility Review

Before the experiment begins, we review key project details: bait protein or target compartment, labeling system preference, cell model or sample type, treatment conditions, control design, replicate plan, and expected downstream interpretation.

This step helps reduce avoidable background, misleading enrichment, and underpowered comparisons.

Choose the Right Labeling Strategy: BioID, TurboID, miniTurbo, APEX/APEX2

Different proximity labeling systems are not interchangeable. The best choice depends on the research question, cell model, labeling window, background tolerance, and the type of biological event you want to capture.

Biotin Ligase-Based Labeling: BioID, TurboID, miniTurbo

BioID, TurboID, and miniTurbo are biotin ligase-based systems. They label nearby proteins through proximity-dependent biotinylation. TurboID and miniTurbo were developed to improve labeling efficiency compared with earlier BioID systems, and TurboID has become widely used for living-cell proximity proteomics.

These approaches are often useful when the project needs broad protein-neighborhood capture around a bait, organelle, or defined cellular region.

Peroxidase-Based Labeling: APEX and APEX2

APEX and APEX2 use peroxidase chemistry to label nearby proteins. These methods can support fast labeling windows and compartment-focused mapping, but they require careful control of labeling conditions and cell compatibility.

Recent literature comparing APEX2 and TurboID shows that both can enrich compartment-specific proteomes, but they may produce different protein profiles. This means enzyme choice can shape the biological picture, so method selection should be part of the project design rather than an afterthought.

Selection Rules by Research Question

Research GoalMore Suitable StrategyWhy It May Fit
Broad bait-centered protein neighborhood mappingTurboID / miniTurboEfficient labeling and strong fit for many cell-based studies
Longer labeling window with lower reactivity needsBioIDUseful when slower labeling is acceptable
Fast compartment or microdomain labelingAPEX / APEX2Useful when short labeling windows are important
Drug-treated vs control comparisonTurboID, miniTurbo, or APEX2Choice depends on treatment time, biology, and cell tolerance
Membrane or receptor neighborhood mappingTurboID / APEX2Selection depends on localization and labeling chemistry
Discovery-stage candidate generationMulti-method feasibility reviewBest method depends on bait, model, and control design

Experimental Workflow with QC Checkpoints

Our workflow covers both the technical process and the service process, from project intake through final data delivery.

1

Project Design and Control Planning

We start by reviewing the bait protein, target compartment, cell model, perturbation design, and expected biological question. We also discuss controls before samples enter the LC-MS/MS workflow.

QC focus: Does the control design allow real enrichment to be separated from background labeling?

2

Bait-Enzyme Fusion or Model Review

If the project uses a bait fusion, we review the fusion orientation, tag position, expression strategy, and localization evidence. If the project uses a client-prepared system, we review the available documentation before enrichment and MS analysis.

QC focus: Does the bait-enzyme fusion localize where the biology suggests it should?

3

Proximity Labeling in the Cell Model

Cells are exposed to the appropriate labeling conditions for the selected enzyme system. Nearby proteins become biotin-labeled in the cellular environment. Labeling conditions should match the biological question and avoid unnecessary stress to the model.

QC focus: Is labeling detectable and consistent across samples?

4

Cell Collection, Lysis, and Streptavidin Enrichment

After labeling, cells are collected and lysed. Biotinylated proteins are captured through streptavidin-based enrichment. Wash conditions are selected to reduce nonspecific background while preserving the enriched labeled-protein pool.

QC focus: Is enrichment strong enough for LC-MS/MS, and are background signals controlled?

5

Protein Digestion and LC-MS/MS Acquisition

Enriched proteins are prepared for mass spectrometry analysis. Peptides are analyzed by LC-MS/MS to identify and quantify proteins across experimental groups.

QC focus: Are peptide recovery, instrument performance, and sample-level signal quality acceptable?

6

Data Filtering, Ranking, and Interpretation

We process the proteomics data to generate protein identification tables, quantification results, enrichment patterns, and candidate ranking. Depending on the project design, we can compare conditions and perform pathway or network-level analysis.

QC focus: Are candidate proteins supported by enrichment, controls, reproducibility, and biological context?

Vertical workflow diagram for proximity labeling proteomics with QC checkpoints from project design to data interpretation.

Common control types include:

Empty-vector or enzyme-only controls

Localization-matched controls

Untreated or vehicle controls

Mutant or inactive bait controls

Biological replicate groups

Sample Requirements and Project Intake Checklist

Proximity labeling projects are often cell-model dependent, so exact input should be confirmed before submission. The table below provides practical starting points based on Creative Proteomics’ general proteomics and sample-handling guidance.

Sample / Material TypeRecommended Amount or InputContainer / FormatStorage and ShippingKey QC or Intake Notes
Suspension or adherent cultured cells for standard quantitative proteomics5 × 106 cells for label-free analysis; 1 × 10⁷ cells for DIA-style workflowsFrozen cell pellet in labeled centrifuge tubesStore at -80°C and ship on dry iceKeep cell numbers consistent across groups
Trace cell proteomics sample200–5,000 cells for trace DIA workflowsLow-bind tube if applicableStore frozen and ship on dry iceFeasibility review required before submission
Animal soft tissue100 mg for label-free; 200 mg for DIA-style workflowsCryovial or centrifuge tubeFlash-freeze and ship on dry iceRemove non-target tissue and record tissue source
Animal hard tissue200 mg for label-free; 300–500 mg for DIA-style workflowsCryovial or centrifuge tubeFlash-freeze and ship on dry iceDiscuss homogenization needs before submission
Plasma / serum / CSF without high-abundance protein depletion20 μLLabeled low-bind tubeFreeze and ship on dry iceAvoid hemolysis and repeated freeze-thaw cycles
Plasma / serum / CSF with high-abundance protein depletion50–100 μL for label-free; 100 μL for DIA-style workflowsLabeled low-bind tubeFreeze and ship on dry iceEDTA plasma may be preferred for depletion workflows
Pure protein or enriched protein material150 μg for label-free; 300 μg for DIA-style workflowsTube with buffer detailsKeep frozen unless otherwise discussedProvide buffer composition and preparation history
Cell culture supernatant10 mL for label-free; 20 mL for DIA-style workflowsScrew-cap tubeFreeze and ship on dry iceSerum-containing medium may complicate interpretation
FFPE material10 slices for label-free; 15–20 slices for DIA-style workflowsLabeled sample tubeShip under agreed conditionsEach slice: about 10 μm thickness and 1.5 × 2 cm area

For proximity labeling studies, please also prepare:

  • Bait protein name and sequence
  • Enzyme system used or preferred
  • Fusion orientation and tag information
  • Cell line or model description
  • Treatment conditions and controls
  • Replicate design
  • Labeling and enrichment history if already performed
  • Any known stress, drug treatment, infection model, or special sample handling

Samples should be collected consistently across groups, labeled clearly, frozen promptly when required, and protected from repeated freeze-thaw cycles.

Bioinformatics Analysis and Data Deliverables

A proximity labeling experiment should not end with a long protein list. Our goal is to help you understand which candidates are enriched, which proteins are condition-dependent, and which pathways or networks may explain the biology.

Minimum DeliverablesOptional Add-On AnalysesCandidate Prioritization Factors
  • Raw LC-MS/MS data files
  • Protein identification table
  • Protein quantification table
  • Enriched candidate proximal protein list
  • Background-filtered ranking table
  • Sample-level QC summary
  • Enrichment QC summary
  • Basic annotation table
  • Volcano plot or heatmap-ready data
  • Methods and parameter summary
  • Differential proximity enrichment analysis
  • GO enrichment analysis
  • KEGG or Reactome pathway enrichment
  • Protein interaction network visualization
  • Bait-centered candidate prioritization
  • Drug-treated vs control comparison
  • Subcellular marker enrichment review
  • Figure-ready visualization package
  • Enrichment over control
  • Reproducibility across replicates
  • Condition-dependent changes
  • Known localization or pathway relevance
  • Background or contaminant risk
  • Biological fit with the bait, compartment, or perturbation

This helps separate high-priority biological candidates from abundant background proteins or nonspecific enrichment.

Demo Results: What Your Proximity Proteomics Data May Look Like

The examples below describe typical result types. They are not claims about a specific project outcome.

Demo proximity labeling proteomics results showing candidate ranking.

Demo 1: Ranked Candidate Proximal Proteins

A ranked candidate table or bar chart can show which proteins are most enriched near the bait or compartment after background filtering.

  • Protein ID
  • Gene name
  • Enrichment score or fold-change
  • Detection frequency
  • Control comparison
  • Annotation notes
Demo proximity labeling proteomics results showing differential enrichment volcano plot.

Demo 2: Differential Proximity Enrichment

For treatment-control or mutant-wild-type designs, a volcano plot or heatmap can show proteins that change proximity under different conditions.

  • Condition-specific enrichment
  • Up-enriched and down-enriched candidates
  • Replicate-level consistency
  • Statistical comparison where design allows
Demo proximity labeling proteomics results showing protein interaction network and pathway interpretation.

Demo 3: Network and Pathway Interpretation

A network view can place the bait protein at the center and group enriched candidates by pathway, complex, function, or cellular compartment.

  • Bait-centered protein network
  • GO / pathway enrichment
  • Candidate functional clusters
  • Follow-up validation priorities

Applications in Drug Discovery and Mechanism Research

Proximity labeling proteomics is useful when the biological question depends on location, timing, and cellular context.

Target Deconvolution and Candidate Target Prioritization

When a compound changes the protein neighborhood around a bait, receptor, organelle, or signaling complex, proximity proteomics can help generate candidate proteins for follow-up validation. This can support target deconvolution and mechanism exploration when combined with orthogonal MS approaches such as photoaffinity labeling MS, Activity-based protein profiling, or Competitive ABPP.

Compound-Induced Network Rewiring

Some compounds do not simply increase or decrease protein abundance. They may alter localization, complex assembly, or pathway organization. Proximity labeling can compare protein neighborhoods before and after compound exposure to reveal condition-dependent network changes.

Signaling Complex and Pathway Regulation

For signaling studies, proximity labeling can map proteins near pathway members under baseline and stimulated conditions. This is helpful when signaling assemblies are dynamic and may not survive conventional purification.

Organelle and Membrane Protein Neighborhood Mapping

For mitochondria, ER, nuclear regions, plasma membrane, and receptor neighborhoods, proximity labeling can help identify local protein environments that are difficult to capture by whole-cell proteomics alone.

Proximity Labeling vs Co-IP-MS, AP-MS, XL-MS, and Spatial Proteomics

No single method answers every protein-interaction question. The best method depends on whether you need direct binding evidence, stable complex recovery, structural distance information, spatial context, or neighborhood-level discovery.

MethodWhat It MeasuresBest FitStrengthsKey LimitationsFollow-Up Value
Proximity labeling proteomicsProteins near a bait or compartment in cellsWeak, transient, spatially restricted, or condition-dependent neighborhoodsCaptures cellular context; useful for dynamic systems; supports differential analysisDoes not prove direct binding by itself; requires careful controls and tag designCandidate discovery, pathway mapping, MoA exploration
Co-IP-MS / Pull-down MSProteins retained with a bait during extraction and purificationStable protein complexesStrong for recoverable complexes; familiar workflowWeak or transient interactions may be lost; lysis can disrupt contextValidation of top proximity candidates
AP-MSAffinity-purified bait-associated proteinsStable interactome mappingUseful for well-behaved bait systemsLess suitable for unstable or spatially restricted neighborhoodsComplements proximity-based evidence
XL-MSCrosslinked protein contactsStructural interaction evidenceCan provide distance-level structural insightLower coverage; more complex interpretationSupports mechanistic validation
Spatial proteomicsProtein localization or compartment assignmentBroad cellular localization studiesUseful for compartment-level mappingNot always bait-centered; may not identify bait-specific neighborhoodsHelps interpret subcellular enrichment
Proteome-wide thermal stability profilingProtein stability shifts after treatmentTarget engagement and pathway response studiesOrthogonal MS evidence for compound responseDoes not directly map local neighborhoodsSupports target and MoA confidence
chemical cross-linking mass spectrometryCrosslinked protein contactsStructural and complex-level questionsAdds distance-informed evidenceRequires suitable crosslinking chemistry and analysisHelps validate physical proximity

When Proximity Labeling Is the Better Fit

Choose proximity labeling when your question involves:

  • Local protein neighborhoods
  • Dynamic signaling events
  • Weak or transient associations
  • Drug-induced changes in proximity
  • Organelle or membrane-localized systems
  • Bait-centered discovery in living cells

When Orthogonal Validation Is Still Needed

Use follow-up methods when you need to confirm:

  • Direct binding
  • Structural contact sites
  • Functional dependency
  • Compound engagement
  • Localization changes
  • Candidate biological relevance

For structural or conformational follow-up, HDX-MS epitope mapping may help answer a different but related question.

Case Study: TurboID-Based Proximal Proteome Mapping in IFN Signaling

This literature case shows how TurboID-based proximity labeling can map a dynamic signaling pathway and reveal candidate regulatory proteins.

Source: Proximal protein landscapes of the type I interferon signaling cascade reveal negative regulation by PJA2

Background

Type I interferon signaling is controlled by dynamic protein assemblies. These assemblies can change after stimulation and may include weak, transient, or context-dependent associations. Conventional interaction methods may miss part of this landscape because the signaling state can be altered during extraction or purification.

Schiefer and Hale used TurboID-based proximity labeling to map the proximal proteomes of seven canonical type I interferon signaling cascade members under basal and IFN-stimulated conditions. The study focused on IFNAR1, IFNAR2, JAK1, TYK2, STAT1, STAT2, and IRF9, covering receptor-level, kinase-level, transcription-factor-level, and regulatory pathway components.

Methods

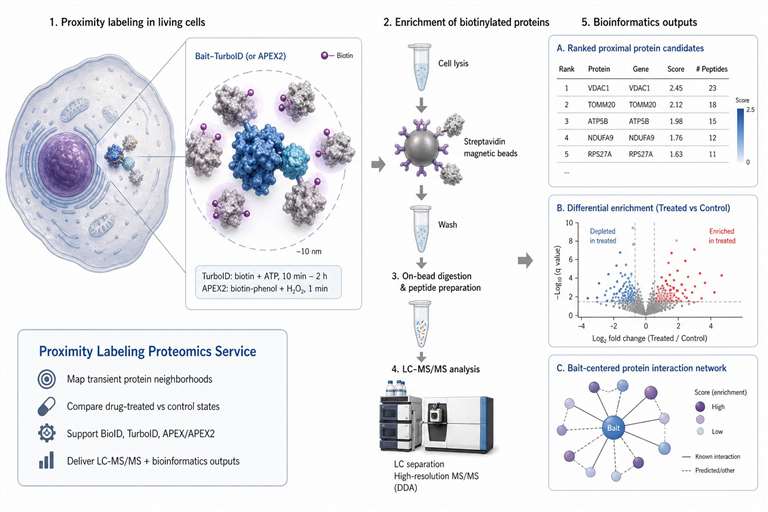
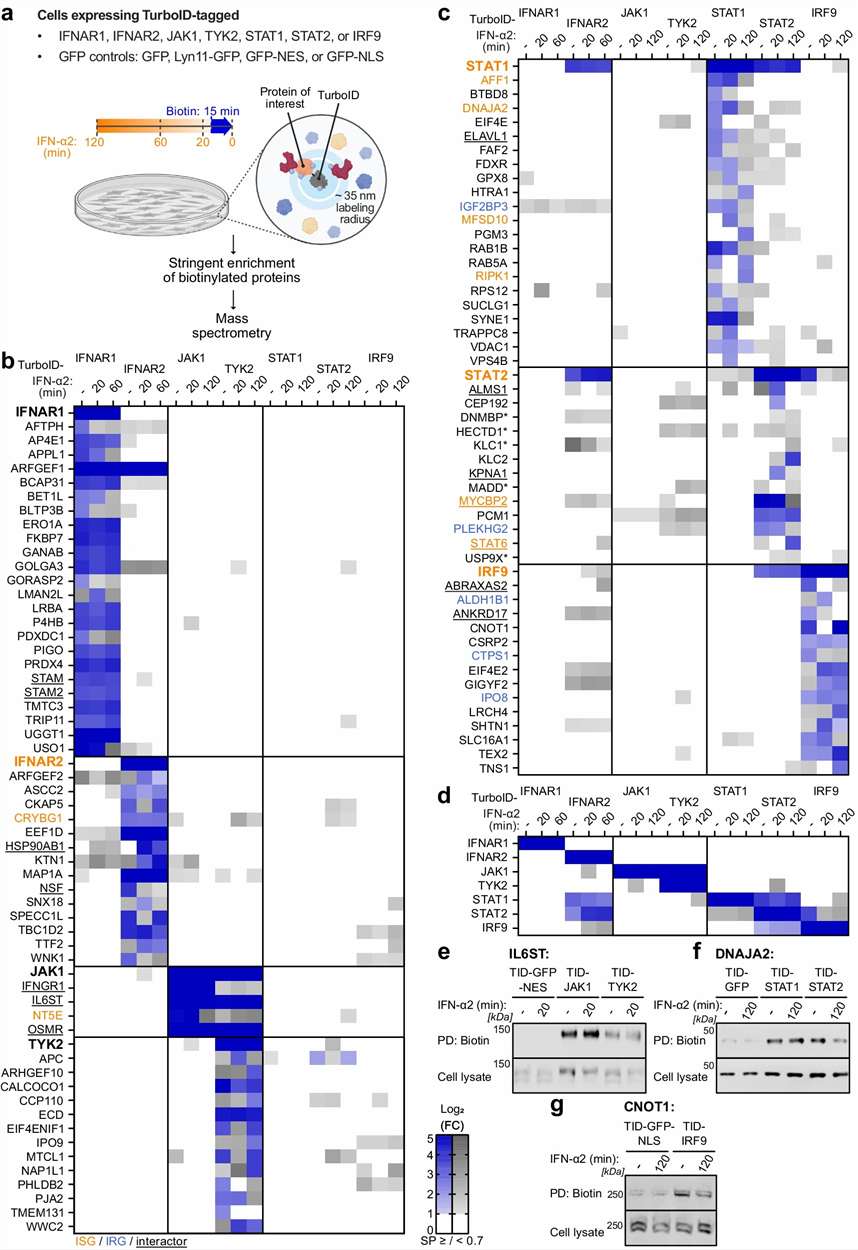
The researchers generated cell systems expressing TurboID-tagged IFN signaling proteins. Cells were either left under basal conditions or stimulated with IFN-α2. Before harvest, biotin was added so that TurboID could label nearby proteins in the cellular environment.

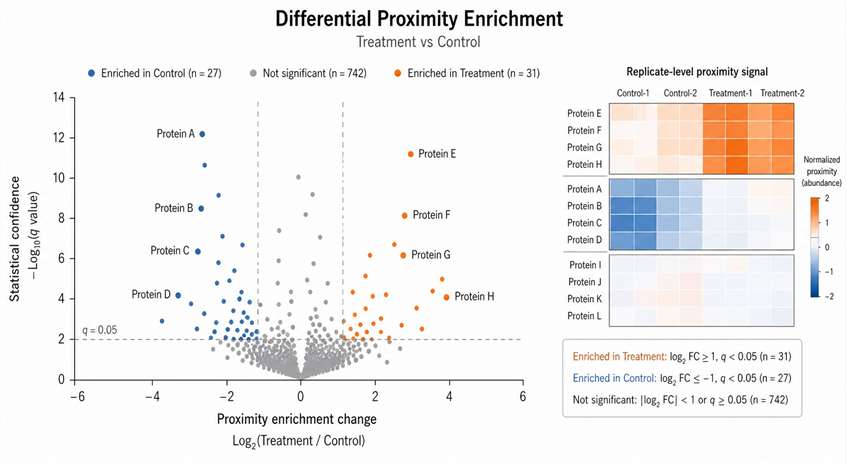
After labeling, biotinylated proteins were enriched and analyzed by label-free mass spectrometry. The study then compared proximal protein profiles across signaling components and stimulation states. Figure 1 presents the system-wide strategy, including TurboID tagging, biotin labeling, enrichment, label-free MS analysis, heatmap visualization, and validation of selected proteins.

Results

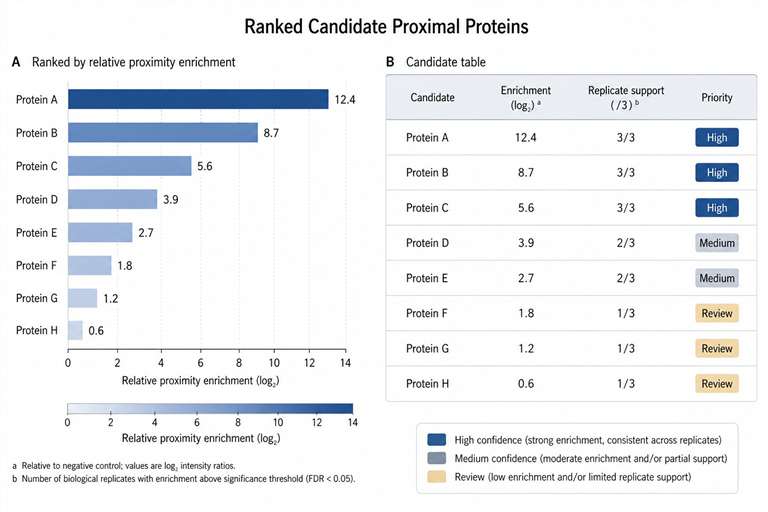
The study identified 103 high-confidence proteins proximal to type I interferon signaling components. The dataset included known pathway-associated proteins as well as additional candidates that were not previously established as core type I interferon signaling components.

Figure 1 shows the workflow and heatmap-style outputs for enriched proximal proteins across the selected pathway members. The authors also used immunoblot validation for selected newly identified proximal proteins, showing that the proximity proteomics workflow produced candidates suitable for deeper biological follow-up.

A key biological finding was the identification of PJA2 as a negative regulator connected to the type I interferon signaling cascade. The study further explored this candidate beyond the discovery dataset, supporting the value of proximity labeling as a starting point for functional mechanism research.

Conclusion

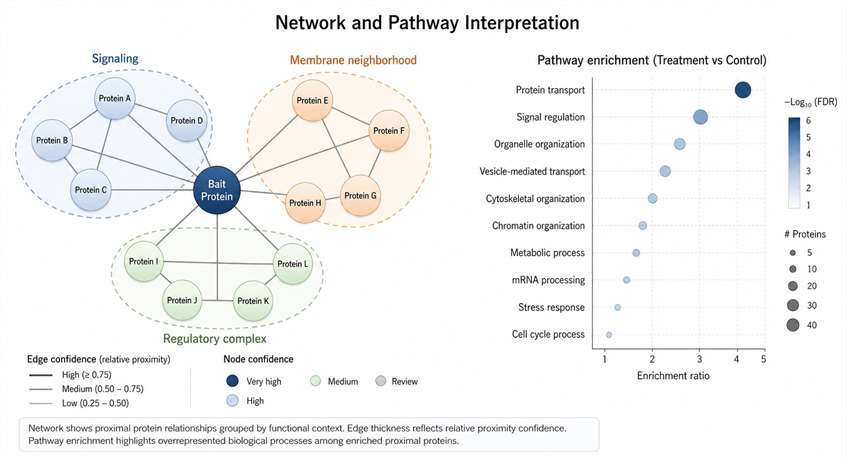
This case shows why proximity labeling proteomics can be valuable for signaling and mechanism research. It can map protein neighborhoods across multiple pathway members, compare stimulated and basal states, and produce candidate regulatory proteins for deeper validation.

For drug discovery and pathway-focused projects, the same logic can support compound-response studies, target deconvolution, and mechanism exploration. The most useful output is not only a protein list, but a controlled and interpretable dataset that helps researchers decide which candidates deserve follow-up experiments.

TurboID proximity labeling workflow and heatmap outputs for mapping type I interferon signaling proximal proteomes.

Figure 1 shows the system-wide TurboID proximity labeling strategy used to map type I interferon signaling proximal proteomes.

FAQ

Frequently Asked Questions

Q: What is proximity labeling proteomics?

Proximity labeling proteomics is an LC-MS/MS-based approach for identifying proteins located near a bait protein, organelle, membrane region, or signaling complex. A labeling enzyme marks nearby proteins, which are then enriched and analyzed by mass spectrometry.

Q: How is proximity labeling different from Co-IP-MS or AP-MS?

Co-IP-MS and AP-MS usually capture proteins that remain associated during extraction and purification. Proximity labeling marks proteins inside the cellular environment before lysis, making it useful for weak, transient, or spatially restricted protein neighborhoods.

Q: Does proximity labeling prove direct protein-protein interaction?

No. It shows proximity under the experimental conditions. Direct binding or functional interaction should be validated with orthogonal methods when needed.

Q: Should I choose BioID, TurboID, miniTurbo, or APEX/APEX2?

The choice depends on your bait, cell model, labeling window, background tolerance, and biological question. TurboID and miniTurbo are often used for efficient biotin-ligase labeling, BioID may fit longer labeling windows, and APEX/APEX2 may fit fast peroxidase-based labeling designs.

Q: What controls are recommended?

Common controls include enzyme-only controls, empty-vector controls, localization-matched controls, untreated controls, mutant bait controls, and biological replicates. The best control design depends on the project question.

Q: Can this service compare drug-treated and untreated samples?

Yes. Proximity labeling can be used to compare protein neighborhoods between treated and untreated conditions, provided that the experimental design includes suitable controls and replicates.

Q: What sample information should I prepare before starting?

Please prepare the bait protein, enzyme system, fusion orientation, cell model, treatment conditions, control groups, replicate plan, and any existing labeling or enrichment information.

Q: What data deliverables are included?

Deliverables may include raw LC-MS/MS data, protein identification tables, quantification tables, enriched candidate lists, QC summaries, enrichment analysis, and visualization-ready result files.

Q: Can proximity labeling support target deconvolution or mechanism studies?

Yes. It can help identify condition-dependent proximal proteins and pathway changes that support target deconvolution or mechanism exploration, especially when combined with orthogonal MS workflows such as Affinity Selection–MS or chemical proteomics.

Q: What validation should be considered after candidate proteins are identified?

Follow-up may include Co-IP, targeted MS, imaging, mutagenesis, binding assays, pathway perturbation, or structural MS depending on the candidate and project goal.

Disclaimer

This service is for Research Use Only and is not intended for clinical diagnosis, treatment selection, patient management, or medical decision-making.

Online Inquiry

Please submit a detailed description of your project. We will provide you with a customized project plan to meet your research requests. You can also send emails directly to for inquiries.

* Email
Phone
* Service & Products of Interest
Services Required and Project Description