Paper Spray Mass Spectrometry Service

Direct, rapid mass spectrometry analysis from paper substrates — no LC separation, minimal sample preparation. Our paper spray MS service delivers quantitative results from biofluids, tissue, and reaction mixtures in seconds per sample.

Every LC-MS sample goes through extraction, column equilibration, a gradient run, and re-equilibration — 10 to 30 minutes per injection. For projects involving hundreds of plasma samples, crude reaction mixtures, or tissue extracts, that bottleneck sets your timeline. Our paper spray mass spectrometry service bypasses it: spot your sample onto a paper substrate, add solvent, apply high voltage, and get quantitative results in seconds. No LC column, no SPE cleanup, no derivatization, no waiting for column re-equilibration between runs.

Paper spray ionization works by applying a high potential (3.5–5 kV) to a wet paper triangle. The electric field generates charged droplets from the paper tip, carrying analytes directly into the MS inlet. The entire ionization event lasts 10–60 seconds, during which we acquire full-scan or targeted MS data. For quantitation, a stable isotope-labeled internal standard is pre-spotted or co-spotted onto the paper, and the analyte/IS peak area ratio is measured against a matrix-matched calibration curve.

Key Advantages:

  • Direct paper spray ionization — no LC column, no mobile phases, no chromatography-related carryover
  • Seconds-per-sample analysis — spot, dry, spray, quantify
  • Minimal sample preparation — blood, plasma, urine, or tissue goes directly onto the paper
  • Quantitative with on-paper internal standard spiking — CV ≤15% comparable to conventional LC-MS
  • Ambient ionization — compatible with benchtop and portable MS platforms
  • Single-use paper substrate — zero carryover between samples
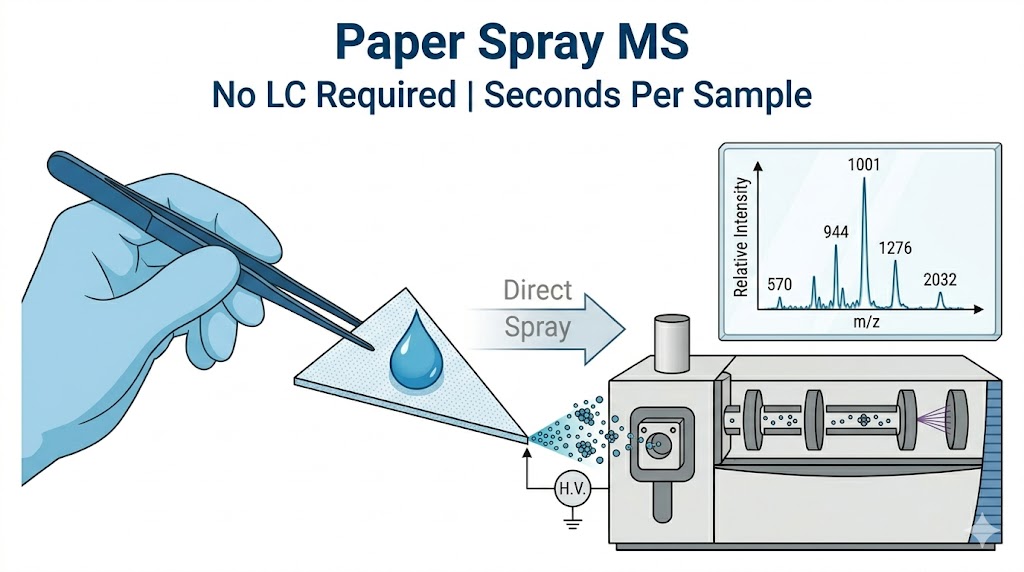
Paper spray mass spectrometry showing sample spotted on paper triangle with high voltage and solvent flow generating electrospray into mass spectrometer inlet.
Overview Applications Workflow Demo Sample Data & Interpretation Why Choose FAQ

Direct, Rapid Analysis Without Chromatography

Every LC-MS sample goes through extraction, column equilibration, a gradient run, and re-equilibration — 10 to 30 minutes per injection. For projects involving hundreds of plasma samples, crude reaction mixtures, or tissue extracts, that bottleneck sets your timeline. Our paper spray mass spectrometry service bypasses it: spot your sample onto a paper substrate, add solvent, apply high voltage, and get quantitative results in seconds. No LC column, no SPE cleanup, no derivatization, no waiting for column re-equilibration between runs.

Paper spray ionization works by applying a high potential (3.5–5 kV) to a wet paper triangle. The electric field generates charged droplets from the paper tip, carrying analytes directly into the MS inlet. The entire ionization event lasts 10–60 seconds, during which we acquire full-scan or targeted MS data. For quantitation, a stable isotope-labeled internal standard is pre-spotted or co-spotted onto the paper, and the analyte/IS peak area ratio is measured against a matrix-matched calibration curve.

This direct-from-substrate approach eliminates the three main bottlenecks of conventional LC-MS bioanalysis: chromatographic separation time, sample preparation steps, and carryover between injections. Each paper triangle is used once and discarded, so there is zero carryover regardless of concentration range. The minimal sample volume requirement (1–20 µL per spot) makes the technique particularly suitable for projects where sample quantity is limited — pediatric studies, preclinical mouse PK, or scarce tissue biopsies.

Paper spray MS is compatible with a range of MS platforms. We operate the technique on Thermo Q Exactive and Orbitrap Exploris platforms for high-resolution accurate-mass work, and on SCIEX Triple Quad systems for quantitative SRM analysis. The source interfaces are commercially available (Prosolia Velox 360) or custom-built, depending on the project requirements. Ionization polarity, spray voltage, and solvent flow rate are optimized during method development and held constant for the duration of the study.

Where Paper Spray MS Delivers the Most Value

APPLICATION 1

Therapeutic Drug Monitoring and PK Bioanalysis

Two hundred plasma samples from a PK study translates to roughly two days of LC-MS instrument time with a 10-minute gradient. Paper spray MS processes the same batch in a few hours — each sample analyzed in under a minute, from spotting the paper to acquiring the mass spectrum. Dried blood spot (DBS) cards can be sprayed directly, eliminating the elution step required by conventional DBS-LC-MS methods. The quantitative accuracy, with proper internal standard normalization, falls within the ±15% acceptance criteria typically applied to regulated bioanalysis.

APPLICATION 2

Reaction Monitoring for Medicinal Chemistry

When you are screening reaction conditions — catalyst loading, temperature, solvent composition — you need rapid feedback to decide which conditions to scale up. Paper spray MS lets you spot 1–2 µL of crude reaction mixture directly onto the paper, acquire a full mass spectrum in seconds, and move to the next condition. The elimination of sample preparation and chromatography means you can evaluate many more conditions per day than with conventional LC-MS.

APPLICATION 3

Direct Tissue and Biofluid Profiling

A small tissue section placed directly on the paper with a few microliters of solvent. Plasma, serum, urine, or saliva spotted, dried, and analyzed. No extraction procedure to develop, no dilution series to optimize, no method adaptation for each new matrix. For related direct ionization approaches, see our electrosonic spray MS and nanoESI HT-MS services.

APPLICATION 4

On-Site and Field-Deployable Analysis

Paper spray's simplicity makes it compatible with miniature mass spectrometers for point-of-care or field applications. Although we focus on lab-based quantitative services, the same methodology translates to portable instruments when on-site analysis is required.

Our Paper Spray MS Workflow

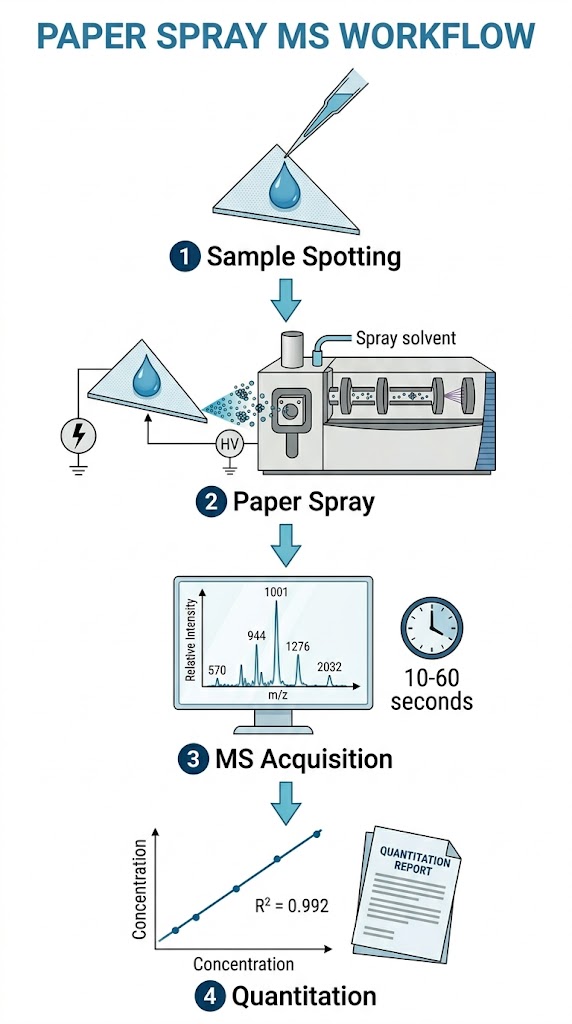
Four simple steps from sample to quantified result.

1

Sample Preparation and Spotting

Your sample is spotted onto a pre-cut paper substrate. Internal standard is applied to the paper surface (pre-spotted for batch consistency or co-spotted with the sample). The paper dries at room temperature in 2–5 minutes. That is the entire sample preparation step — no protein precipitation, no solid-phase extraction, no centrifugation.

2

Paper Spray Ionization

The dried paper triangle is positioned in front of the MS inlet. We apply high voltage (3.5–5 kV) and add 10–50 µL of spray solvent optimized for your analyte. Solvent carries analytes from the paper tip to the MS inlet as charged droplets. No nebulizer gas, no sheath gas, no heated interface required.

3

MS Acquisition

We acquire full-scan MS or targeted SRM/MRM data for 10–60 seconds per sample. For quantitative methods, we monitor the analyte and its stable isotope-labeled internal standard simultaneously. A blank paper spray is run between samples to confirm no carryover.

4

Data Processing and Quantitation

Extracted ion chromatograms from each spray event are integrated. The analyte/IS peak area ratio is calculated and interpolated against a matrix-matched calibration curve prepared on the same paper substrate. Calibration curves typically include 6–8 concentration levels plus blanks and QCs at three concentrations.

Four-step workflow for paper spray MS: sample spotting, paper spray ionization, MS acquisition, and data quantitation.

Representative Data — Paper Spray Quantitative Performance

Linearity and Dynamic Range

Paper spray MS calibration curves for small molecule analytes in plasma typically show linearity (R² ≥ 0.99) over 2–3 orders of magnitude. The working range is method-dependent but routinely covers 1–1000 ng/mL for compounds with good ionization efficiency.

Precision and Accuracy

With stable isotope internal standard normalization, intra-day and inter-day precision (CV) is typically ≤15% at all QC levels, and ≤20% at the lower limit of quantitation. Accuracy, measured as percent deviation from nominal concentration, falls within ±15% for the majority of analytes.

Comparison with LC-MS

In side-by-side comparisons using the same MS platform, paper spray and LC-MS methods for drug quantitation in plasma show correlation coefficients (R²) of 0.98 or better across the calibration range. The primary source of bias is differential matrix effects, which we address through matrix-matched calibration and appropriate IS selection.

Sample Requirements and Project Planning

Sample TypeVolume RequiredPreparationInternal StandardReplicates
Plasma / serum5–20 µLDirect spotting, dry 2–5 minPre-spotted or co-spotted SIL-IS3 per level
Whole blood (DBS)10–20 µLSpot onto DBS card, air dryPre-spotted on card3 per level
Urine5–20 µLDirect spotting or 2× dilutionCo-spotted SIL-IS3 per level
Crude reaction mixture1–5 µLDirect spotting (quench if needed)Co-spotted IS3 per condition
Tissue homogenate5–20 mg equivalentHomogenize, spot supernatantPre-spotted SIL-IS3 per sample
Tissue section1–5 mm² piecePlace directly on paperApplied to tissue surface3 per sample

Planning notes:

  • Calibration curves are prepared on the same paper substrate — typically 6–8 points plus blanks and QCs at low, mid, and high concentrations.
  • Typical LODs for small molecules in biofluids range from 1–100 ng/mL, depending on ionization efficiency and MS platform sensitivity.
  • Most quantitative projects complete in 2–4 weeks from sample receipt. Urgent PK or reaction screening projects can be delivered within 48 hours.

Data Processing and Interpretation

Our data pipeline for paper spray MS projects is designed to produce publication-ready quantitative results.

Peak Integration and Normalization

Raw data from each spray event is processed using Thermo Xcalibur or SCIEX OS software. Extracted ion chromatograms for the analyte and internal standard are integrated using consistent peak detection parameters across all samples, standards, and QCs.

Calibration and Quantitation

Calibration curves are constructed using weighted linear or quadratic regression (1/x or 1/x² weighting, selected based on the concentration range). The model is evaluated based on back-calculated standard accuracy (±15%, ±20% at LLOQ) and correlation coefficient.

Quality Control

Each analytical batch includes: system suitability check, calibration standards at 6–8 levels, QC samples at three concentrations in triplicate, blank matrix, and double blank. Batch acceptance follows fit-for-purpose validation guidelines with ≥75% of QCs within ±15% of nominal.

Deliverables Package

Processed data tables with individual and mean concentrations, accuracy and precision summary, calibration curve parameters (equation, R², weighting), representative extracted ion chromatograms, and a written method summary with experimental conditions.

Why Choose Our Paper Spray MS Platform

CriterionConventional LC-MS BioanalysisPaper Spray MS
Sample preparationSPE, protein precipitation, or dilute-and-shootSpot and dry
Analysis time per sample10–30 min (LC gradient)30–60 sec (direct spray)
Solvent consumption per sample1–5 mL10–50 µL
Column requiredYes (C18, HILIC, etc.)No
Carryover riskModerate (column + injector)Low (single-use paper)
Quantitative accuracyGold standard (CV ≤15%)Comparable (CV ≤15% with IS)
Sample volume per injection5–50 µL1–20 µL
Method development timeDays to weeksHours

What sets us apart:

  • Dedicated paper spray workflow — We have optimized methods for plasma, whole blood (DBS), urine, and tissue matrices, covering substrate selection, solvent composition, and ionization parameters for each sample type.
  • Quantitative rigor — Stable isotope internal standards, matrix-matched calibration, QC samples at three levels, and fit-for-purpose validation protocols.
  • Rapid turnaround — For urgent PK or reaction screening projects, results can be delivered within 48 hours of sample receipt.
  • Flexible substrate options — Standard chromatography paper, commercial DBS cards, and treated paper substrates for improved ionization of specific compound classes.
  • Method development support — If your compound or matrix is not yet validated on paper spray, we will develop and optimize the method before beginning quantitative analysis.

For complementary rapid analysis capabilities, see our digital microfluidics MS and microfluidic chip–MS services.

FAQ

Frequently Asked Questions

Q: How does paper spray MS compare to conventional LC-MS for quantitation?

With stable isotope internal standards and matrix-matched calibration, paper spray MS achieves comparable accuracy (typically within ±15% of expected values) for small molecule quantitation in biofluids. The trade-off is higher matrix effects in some samples due to the absence of chromatographic separation, which we address through careful IS selection and matrix-matched calibration.

Q: What types of compounds can be analyzed by paper spray MS?

Small molecules (MW 100–1000 Da) with moderate to high polarity are most suitable: therapeutic drugs, drug metabolites, endogenous metabolites, lipids, and peptides. Nonpolar compounds and very labile molecules may benefit from alternative ambient ionization methods.

Q: What is the limit of detection for paper spray MS?

Typical LODs range from 1–100 ng/mL for small molecules in biofluids, depending on ionization efficiency and the MS platform. With dedicated paper spray sources, detection limits can reach sub-ng/mL for compounds with good ionization efficiency.

Q: Can paper spray MS handle large batches of samples?

Yes. The workflow is designed for batch processing. Samples are spotted onto a multi-position paper array or individual paper triangles, dried, and analyzed sequentially. A single operator can process 100–200 samples per day on a single MS instrument.

References

  1. McBride EM, Mach PM, Dhummakupt ES, Dowling S, Carmany DO, Demond PS, Rizzo G, Manicke NE, Glaros T. "Paper spray ionization: Applications and perspectives." TrAC Trends in Analytical Chemistry, 2019, 118, 722–730. DOI: 10.1016/j.trac.2019.06.028
  2. Chiang S, Zhang W, Ouyang Z. "Paper spray ionization mass spectrometry: recent advances and clinical applications." Expert Review of Proteomics, 2018, 15(10), 781–789. DOI: 10.1080/14789450.2018.1525295
  3. Manicke NE, Abu-Rabie P, Spooner N, Ouyang Z, Cooks RG. "Quantitative analysis of therapeutic drugs in dried blood spot samples by paper spray mass spectrometry." Journal of the American Society for Mass Spectrometry, 2011, 22(9), 1501–1507. DOI: 10.1007/s13361-011-0177-x

Ready to accelerate your bioanalysis with paper spray MS?

Contact our team to discuss your project and receive a detailed quotation.

Disclaimer: All products and services provided by Creative Proteomics are for research use only (RUO). They are not intended for use in diagnostic, therapeutic, or clinical procedures.

Online Inquiry

Please submit a detailed description of your project. We will provide you with a customized project plan to meet your research requests. You can also send emails directly to for inquiries.

* Email
Phone
* Service & Products of Interest
Services Required and Project Description