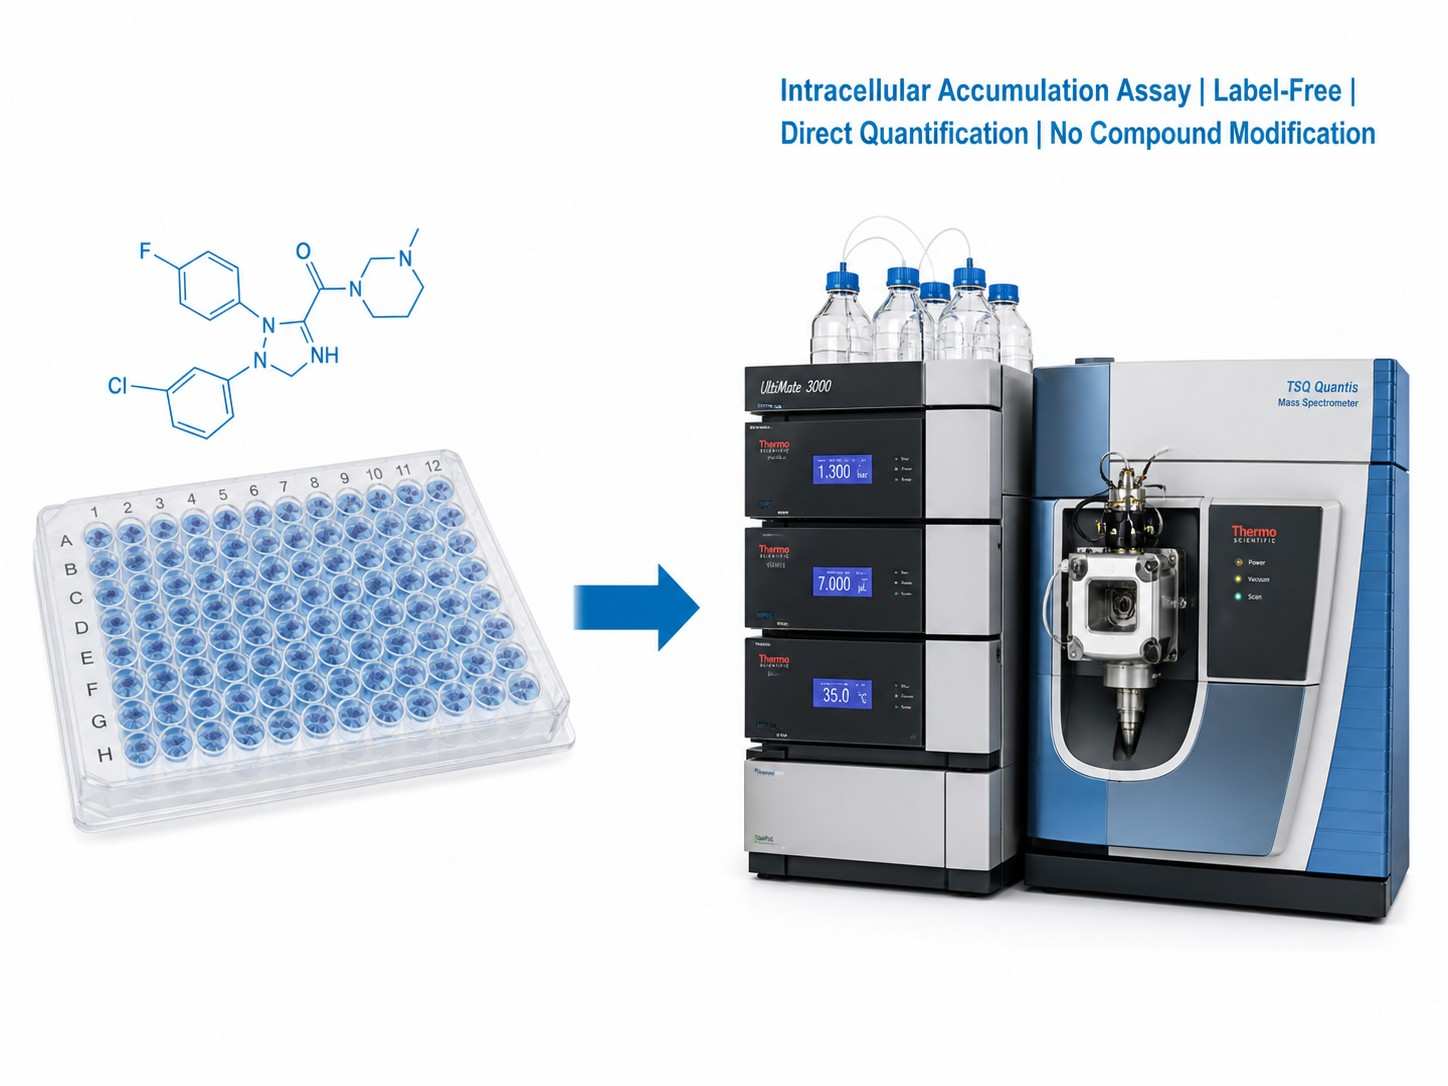
Intracellular Accumulation Assay by LC-MS/MS
Direct, label-free quantification of intracellular compound concentration for drug discovery and lead optimization.
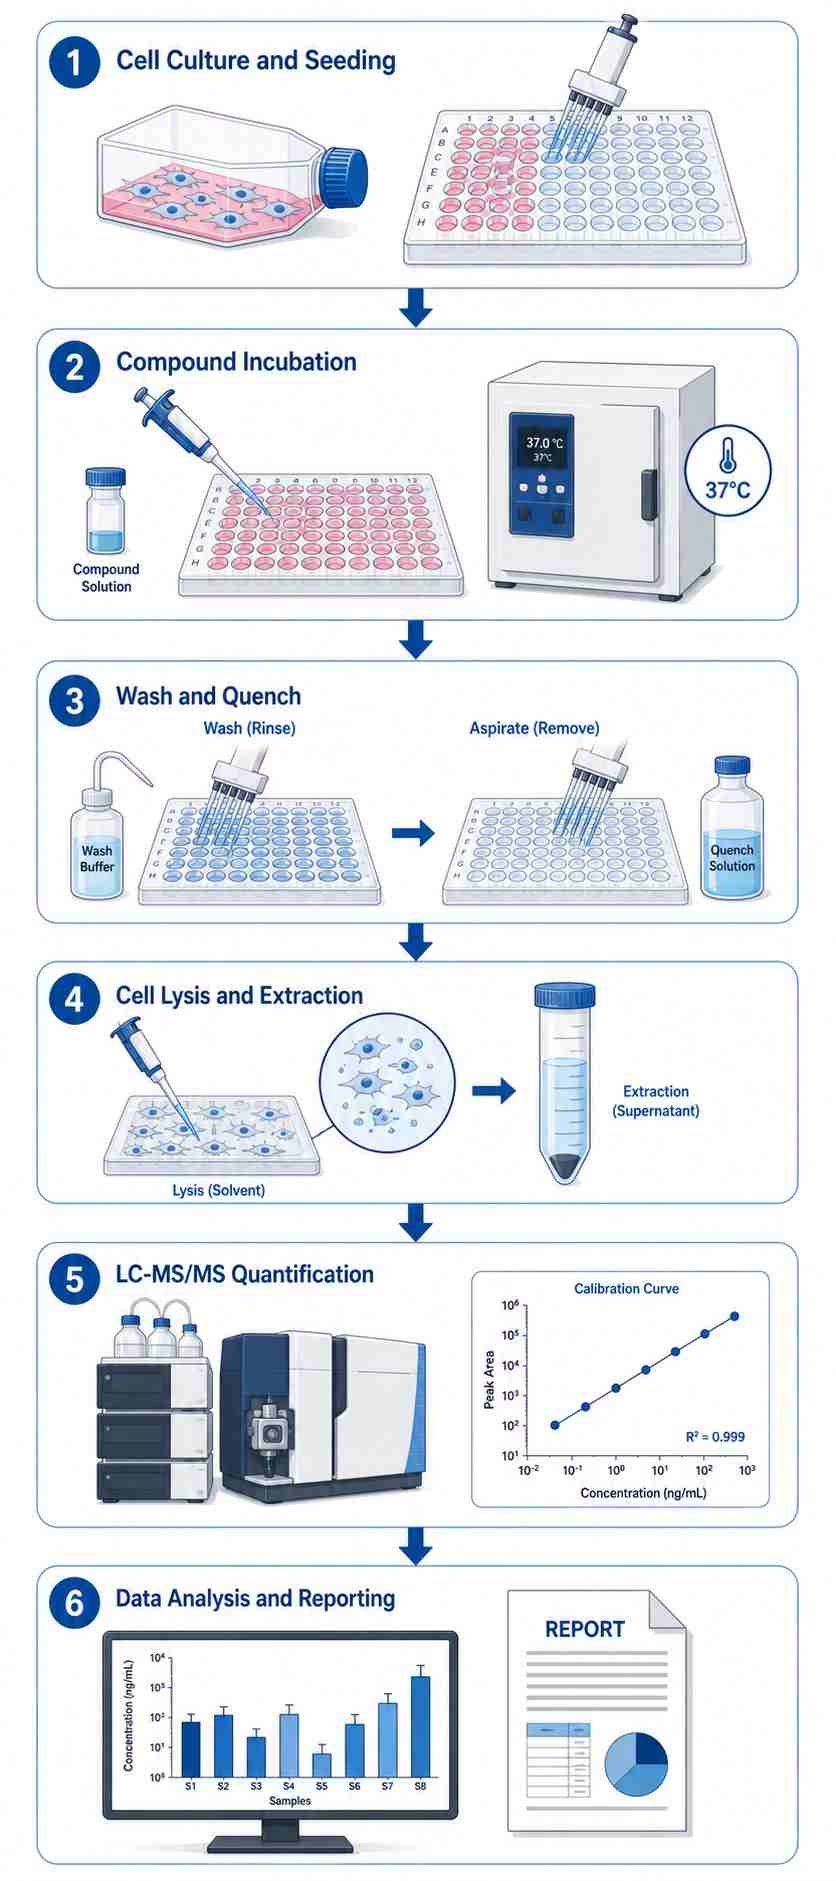
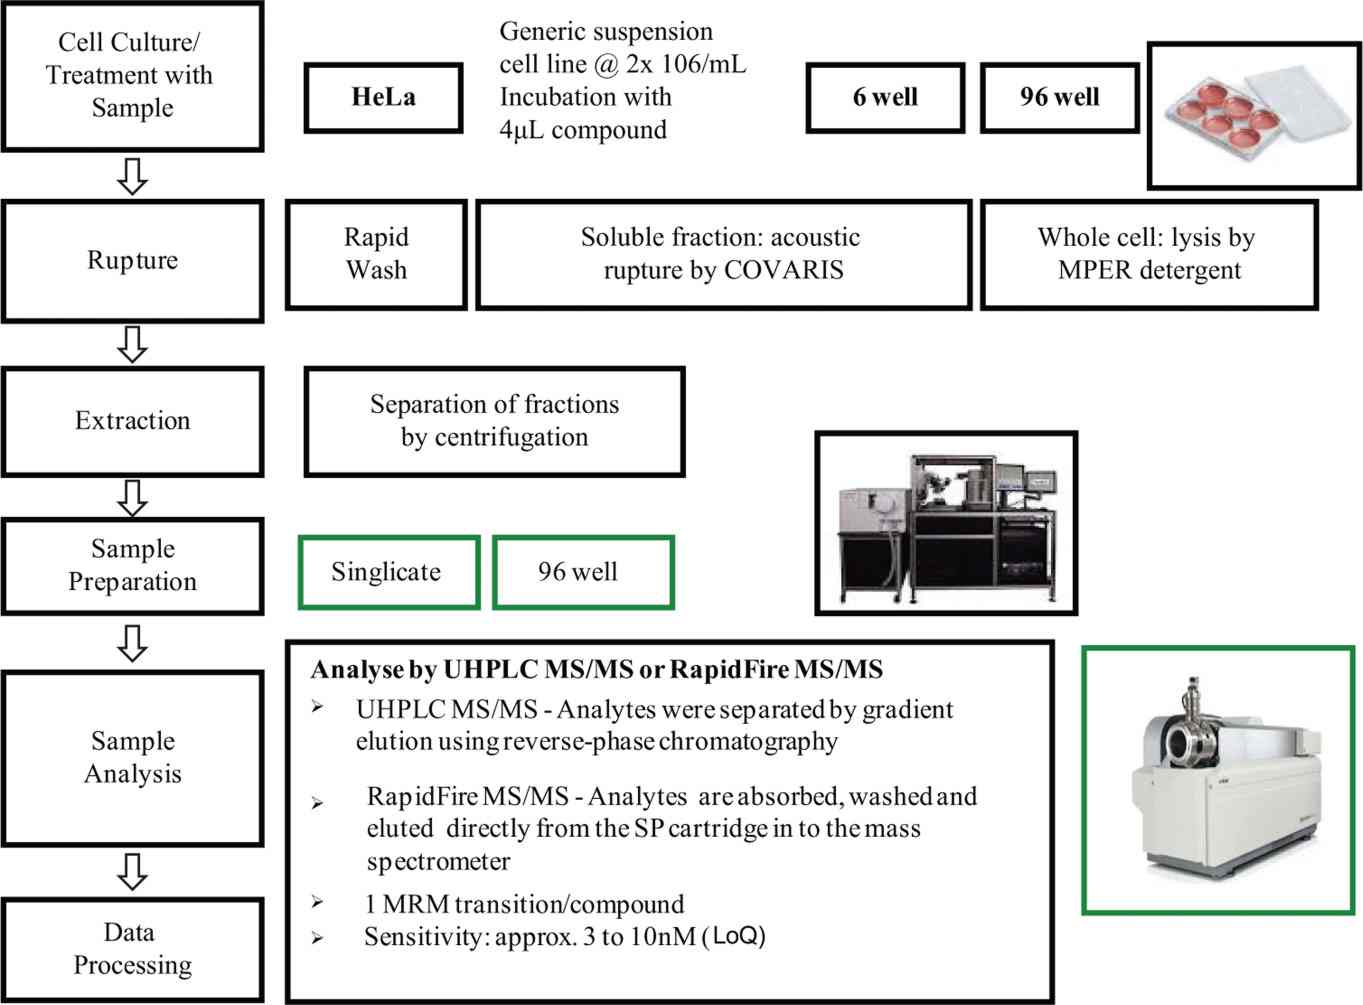
Intracellular accumulation MS is a direct LC-MS/MS-based analytical approach that quantifies the steady-state concentration of a compound inside living cells after incubation. Unlike permeability assays (such as Caco-2 Papp) which measure the rate of membrane crossing, intracellular accumulation MS measures the actual amount of compound that has entered and been retained within cells — the parameter that ultimately drives target engagement and pharmacological activity.
At Creative Proteomics, our Intracellular Accumulation Assay by LC-MS/MS is designed to provide drug discovery teams with actionable intracellular exposure data at every stage of lead optimization. Leveraging validated LC-MS/MS methods and standardized cell-based workflows — including our cell-based MS drug screening capabilities — we deliver reproducible, compound-specific accumulation data — without fluorescent tags, radiolabels, or surrogate readouts.
Key Advantages:
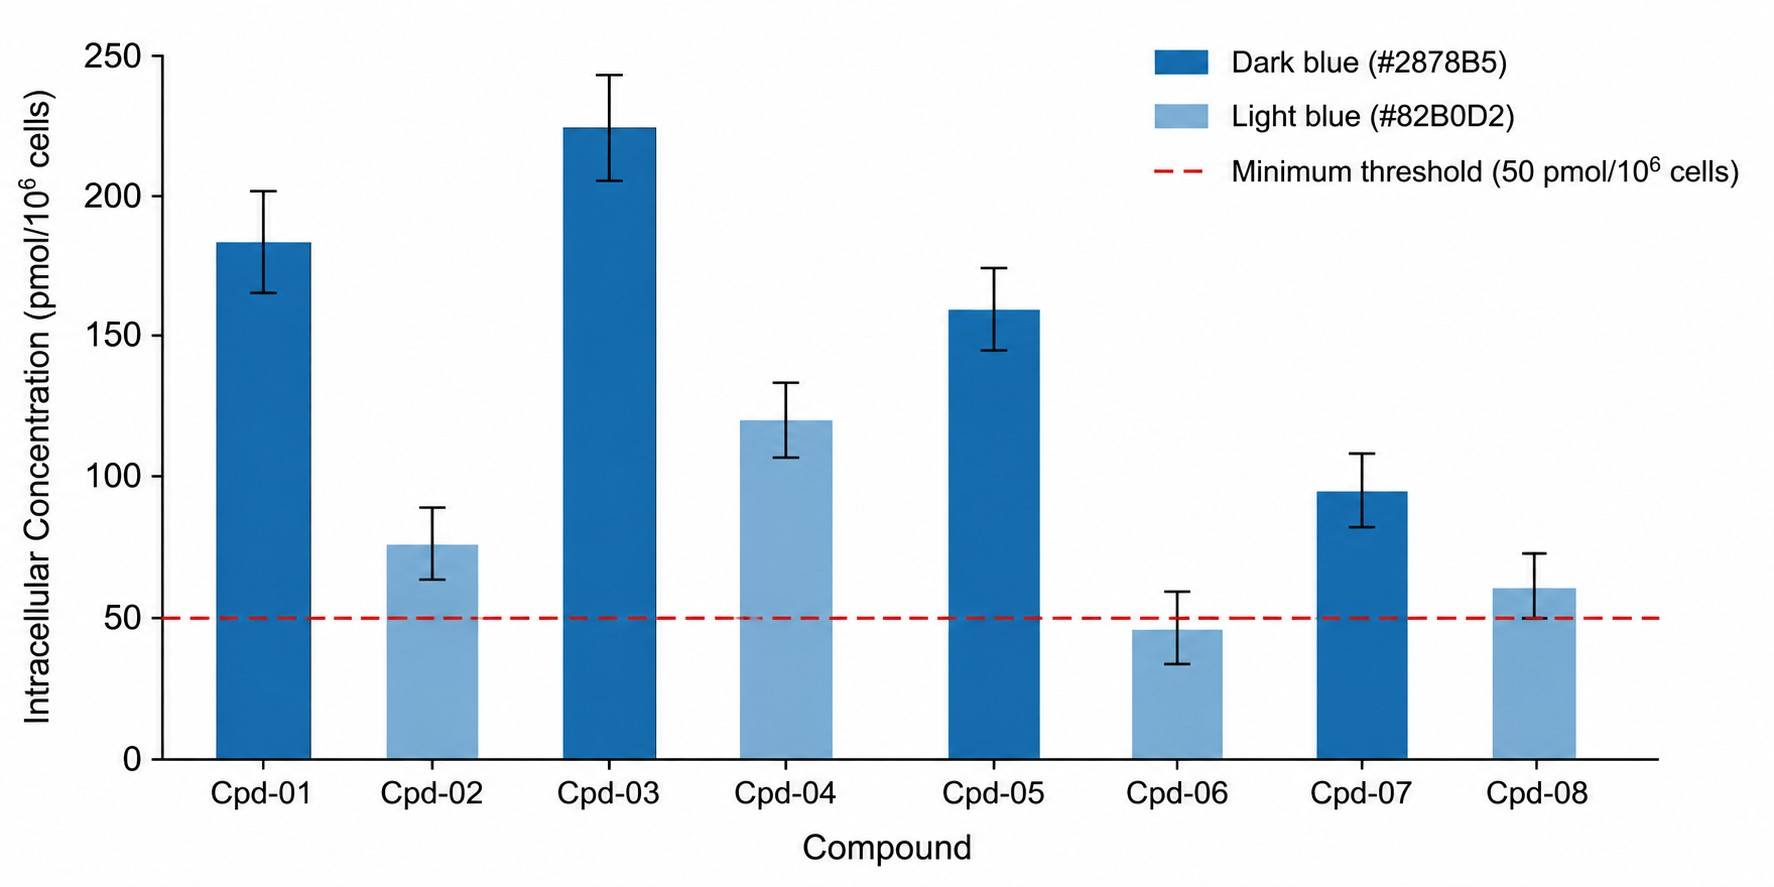
- Label-free, direct quantification of unmodified parent compound inside cells.
- High-throughput screening of up to 50 compounds per run (single time-point mode).
- Compatible with traditional small molecules, PROTACs, macrocycles, and bRo5 modalities.
- Validated wash protocols to distinguish intracellular from membrane-bound compound.