CYP450 Inhibition Panel — LC-MS/MS Cocktail Assay for Drug-Drug Interaction Screening

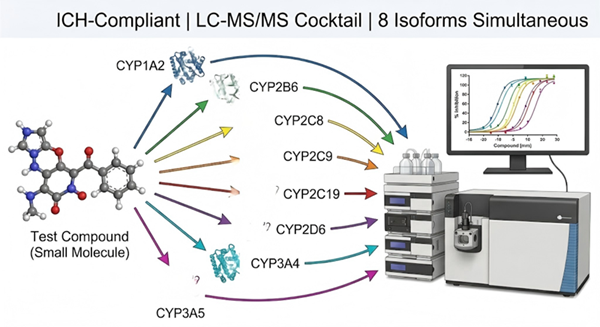
ICH-compliant CYP450 inhibition screening that simultaneously evaluates your compound's inhibitory potential against 7-8 major hepatic isoforms in a single LC-MS/MS cocktail incubation.

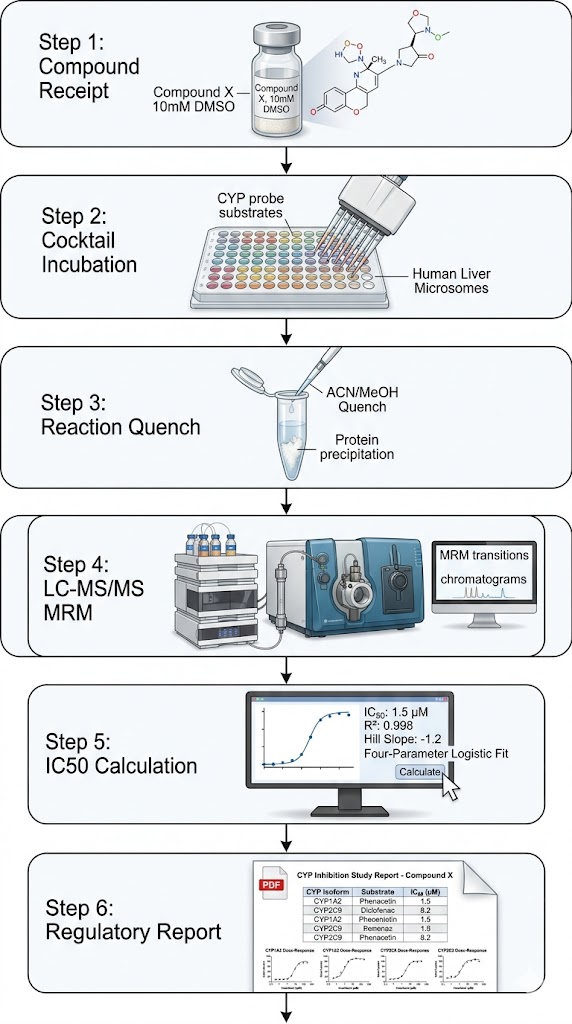
At Creative Proteomics, our CYP450 inhibition panel service is designed to address the regulatory requirement for in vitro DDI assessment before first-in-human dosing — delivering regulatory-ready IC50 data free from fluorescence interference.

Leveraging our validated LC-MS/MS cocktail approach with pooled human liver microsomes, we deliver multi-isoform IC50 results from a single incubation, reducing compound consumption by up to 8-fold compared to individual probe assays.

Key Advantages:

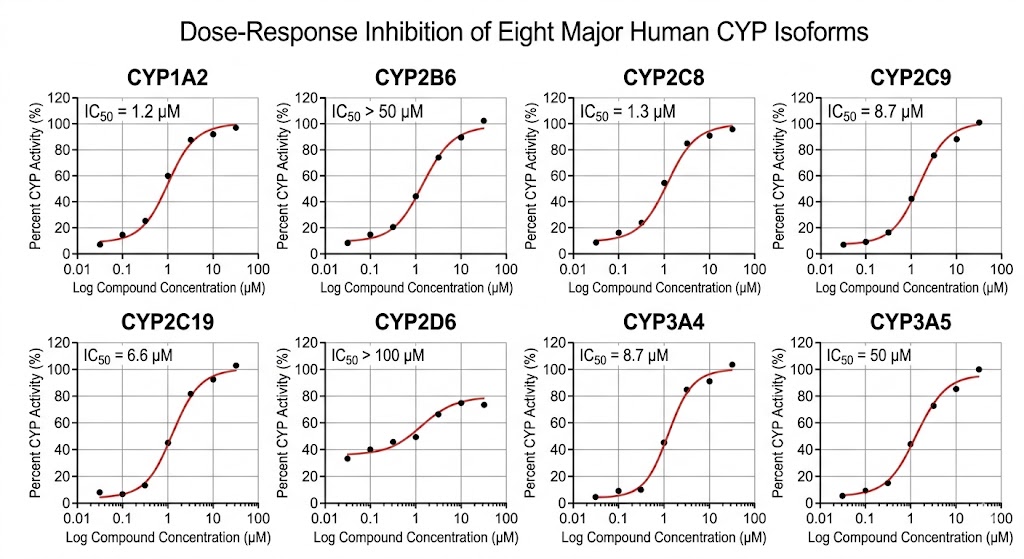
  • ICH-compliant CYP panel covering 7 major hepatic isoforms (CYP1A2, 2B6, 2C8, 2C9, 2C19, 2D6, 3A4/5) plus optional CYP2E1.
  • LC-MS/MS cocktail approach — 8 probe substrates in a single incubation, 8 IC50 curves from one LC-MS/MS run.
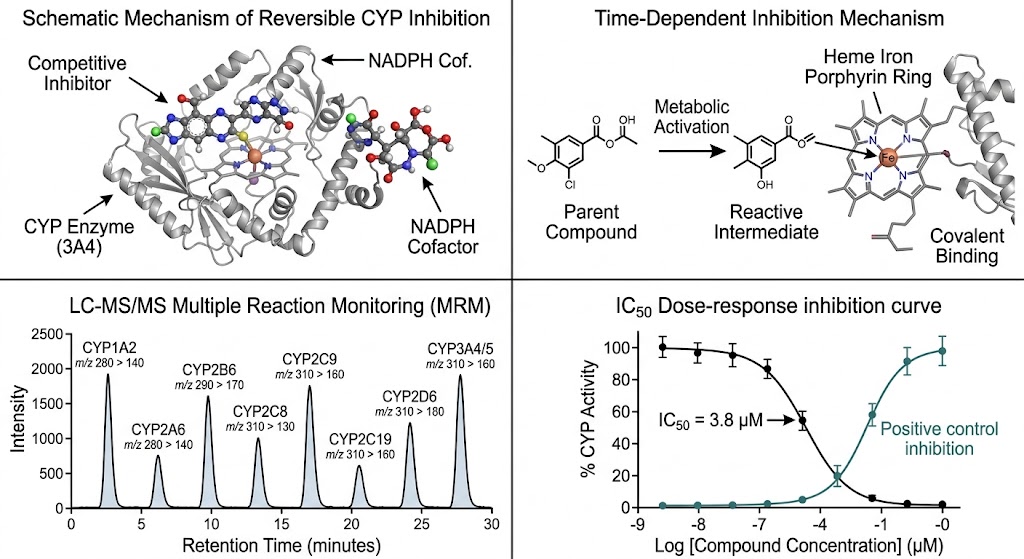
  • No fluorescence interference — mass-based MRM detection eliminates autofluorescence, quenching, and inner-filter effect artifacts.
  • Time-dependent inhibition (TDI) add-on with ±NADPH pre-incubation design for mechanism-based inactivation risk assessment.
CYP450 inhibition panel LC-MS/MS cocktail assay concept — compound incubates with 8 CYP isoforms and probe substrates, detected by LC-MS/MS, outputting IC50 curves
What Is Why MS CYP Panel Workflow TDI Comparison Applications Sample Demo FAQ

What Is a CYP450 Inhibition Panel?

A CYP450 inhibition panel measures a test compound's ability to inhibit major human hepatic cytochrome P450 enzymes — the metabolic workhorses that clear most marketed drugs from the body. Strong inhibition at clinically relevant concentrations can cause co-administered drugs to accumulate to toxic levels, producing serious drug-drug interactions (DDIs).

The Clinical Drug Interaction Guidance and the ICH M12 Guideline require in vitro CYP inhibition data for every investigational new drug before first-in-human dosing. The standard panel assesses reversible inhibition of CYP1A2, 2B6, 2C8, 2C9, 2C19, 2D6, and 3A4/5 — together accounting for over 90% of hepatic drug metabolism. Results are reported as IC50 values (the concentration producing 50% inhibition of enzyme activity), which feed directly into DDI risk assessment models and regulatory decision frameworks.

Why Choose MS-Based CYP450 Inhibition Screening Over Fluorometric Assays?

Elimination of Compound Optical Interference

Fluorometric CYP inhibition assays detect the conversion of a fluorogenic probe substrate into a fluorescent metabolite. This optical readout is inherently vulnerable to interference: autofluorescent test compounds generate false negative inhibition results, while quenching compounds or inner-filter effect molecules mask genuine inhibition. These artifacts are particularly prevalent in compound libraries containing heterocycles, conjugated systems, and natural-product-derived structures — the very chemotypes most likely to yield promising lead molecules.

LC-MS/MS detection measures the probe substrate metabolite by its mass-to-charge ratio via MRM, completely bypassing optical interference. The result is an IC50 value that reflects genuine CYP inhibition potency, not the compound's optical properties.

True Cocktail Multiplexing in a Single Incubation

Fluorometric CYP assays are inherently limited to one isoform per well because each fluorogenic probe requires a distinct excitation/emission wavelength pair. Running 7-8 individual CYP isoform assays consumes 7-8 times the compound material, microsomes, cofactors, and plate-reader time. In contrast, LC-MS/MS MRM can distinguish 7-8 chemically distinct probe metabolites from a single cocktail incubation by their unique precursor-to-product ion transitions. One incubation, one LC-MS/MS run, eight IC50 curves — reducing compound consumption by up to 8-fold and instrument time by a comparable margin.

Reliable Time-Dependent Inhibition Assessment

Time-dependent CYP inhibition (TDI) — also known as mechanism-based inactivation — occurs when a compound is metabolically activated by the CYP enzyme into a reactive intermediate that covalently modifies and irreversibly inactivates the enzyme. TDI is a serious safety concern because CYP activity remains suppressed until new enzyme is synthesized, which can take days. Our LC-MS/MS TDI add-on uses a parallel ±NADPH 30-minute pre-incubation design. An IC50 shift of ≥1.5-fold after NADPH pre-incubation signals potential TDI liability. Because MS detection is blind to NADPH and fluorescent pre-incubation byproducts, the TDI signal is clean and unambiguous.

Direct Metabolite Quantification Without Label Artifacts

Fluorogenic CYP probe substrates are synthetic molecules bearing a fluorophore that is released upon CYP-mediated oxidation. The fluorophore alters the substrate's physicochemical properties relative to the native drug-like molecules the enzyme evolved to metabolize. This can affect substrate binding affinity, active site orientation, and turnover kinetics, particularly for CYP isoforms with narrow active site cavities such as CYP2D6 and CYP2C9. LC-MS/MS probe substrates (phenacetin, diclofenac, midazolam, etc.) are small drug-like molecules whose CYP-mediated metabolism has been extensively characterized. The measured IC50 values reflect inhibition of genuine drug-metabolizing reactions — not fluorophore release chemistry.

Regulatory Confidence in MS-Based Data

Regulatory agencies accept both fluorometric and MS-based CYP inhibition data for IND/NDA submissions. However, reviewers are increasingly aware of the fluorescence interference problem. When fluorometric IC50 values are discordant with other ADME data — for example, a compound showing potent CYP3A4 inhibition by fluorometric assay but no effect on midazolam clearance in hepatocytes — the data inconsistency must be explained in the submission. MS-based CYP inhibition data, by eliminating the optical interference variable at the source, produces results that are more likely to be concordant across orthogonal ADME assays.

CYP450 Isoform Panel and Probe Substrate Cocktail

Our standard CYP450 inhibition panel covers seven major hepatic CYP isoforms plus CYP3A5, using recommended probe substrates and metabolite-specific MRM transitions for unambiguous detection. CYP2E1 is available as an optional add-on with optimized DMSO control.

CYP IsoformProbe SubstrateMetabolite MeasuredMRM Transition (Q1→Q3)Recommended
CYP1A2PhenacetinAcetaminophen152.1 → 110.0Yes
CYP2B6BupropionHydroxybupropion256.1 → 238.1Yes
CYP2C8Paclitaxel6α-Hydroxypaclitaxel870.4 → 286.1Yes
CYP2C9Diclofenac4'-Hydroxydiclofenac312.0 → 230.9Yes
CYP2C19S-Mephenytoin4'-Hydroxymephenytoin235.1 → 150.1Yes
CYP2D6DextromethorphanDextrorphan258.2 → 157.1Yes
CYP3A4/5Midazolam1'-Hydroxymidazolam342.1 → 203.1Yes
CYP2E1 (optional)Chlorzoxazone6-Hydroxychlorzoxazone184.0 → 120.0Yes

The cocktail is prepared in MS-compatible buffer (100 mM potassium phosphate, pH 7.4) with pooled human liver microsomes (HLM, ≥20 donors) as the enzyme source. NADPH (1 mM) initiates the reaction. All probe substrate concentrations are set at or below their respective KM values. DMSO is maintained at ≤0.1% (v/v) final concentration — a critical parameter that prevents solvent-induced CYP inhibition, particularly for CYP2E1.

Positive control inhibitors are included in every analytical batch: α-naphthoflavone (CYP1A2), ticlopidine (CYP2B6), montelukast (CYP2C8), sulfaphenazole (CYP2C9), N-3-benzylnirvanol (CYP2C19), quinidine (CYP2D6), and ketoconazole (CYP3A4). Experimental IC50 values are verified against published reference ranges.

LC-MS/MS CYP450 Inhibition Assay Workflow

Our standard CYP450 inhibition panel follows a streamlined workflow that minimizes hands-on time while maximizing data quality and reproducibility.

1

Compound Receipt and Preparation

Test compounds are received as solid powder or pre-dissolved DMSO stock (10 mM recommended). Compounds are diluted in DMSO to a 100× working concentration series (typically 8-point, 3-fold dilution, covering 0.01–100 µM final).

2

Cocktail Incubation with Pooled HLM

The probe substrate cocktail is combined with pooled HLM (0.1–0.5 mg/mL protein) and test compound at each concentration in 96-well format. The reaction is initiated by addition of NADPH (1 mM) and incubated at 37°C for 10–30 minutes. For TDI assessment, compounds are pre-incubated with HLM and NADPH for 30 minutes before substrate addition.

3

Reaction Termination and Sample Preparation

Reactions are quenched by addition of ice-cold acetonitrile containing an internal standard. Samples are centrifuged to remove precipitated protein, and the supernatant is transferred to LC autosampler vials.

4

LC-MS/MS MRM Analysis

Samples are analyzed by rapid-gradient reversed-phase LC coupled to a triple quadrupole mass spectrometer operating in positive-ion electrospray mode. Each probe metabolite is detected by a specific MRM transition with optimized collision energy and dwell time.

5

IC50 Calculation and QC Verification

Metabolite peak areas are integrated and normalized to the internal standard. IC50 values are determined by fitting the data to a four-parameter logistic (Hill) model. For TDI assessment, the IC50 shift ratio (±NADPH) is calculated, with ≥1.5-fold shift flagged as a TDI risk signal. QC metrics include Z' factor and positive control IC50 verification against literature reference ranges.

6

Regulatory Report Generation

Data is compiled into a comprehensive report including IC50 summary tables with 95% confidence intervals, dose-response curves for each CYP isoform, representative MRM chromatograms, positive control QC data, and method parameters — aligned with IND Module 2.6.4 and ICH M12.

CYP450 inhibition LC-MS/MS cocktail assay workflow — 6 steps from compound receipt to regulatory report

Time-Dependent CYP Inhibition (TDI) — Mechanism-Based Inactivation Screening

Not all CYP inhibition is reversible. Some compounds are metabolically activated by CYP enzymes into reactive intermediates that form covalent adducts with the enzyme's heme iron or apoprotein, irreversibly destroying catalytic activity. Drugs withdrawn from the market or restricted due to TDI-mediated DDIs include mibefradil (CYP3A4 TDI), troglitazone (CYP3A4 TDI), and tienilic acid (CYP2C9 TDI).

TDI Assay Design

Our TDI add-on uses a parallel ±NADPH pre-incubation design:

  1. Test compound is pre-incubated with HLM in the presence (+) or absence (−) of NADPH for 30 minutes at 37°C.
  2. The pre-incubation mixture is diluted into a cocktail incubation containing probe substrates and fresh NADPH.
  3. Residual CYP activity is measured, and IC50 values are calculated for both +NADPH and −NADPH arms.
  4. An IC50 shift ratio (IC50−NADPH / IC50+NADPH) ≥ 1.5-fold is the standard TDI risk threshold.

Structural Alerts for TDI

Compounds containing the following functional groups have elevated TDI risk:

  • Terminal alkenes and alkynes (epoxidation → covalent heme adducts)
  • Methylenedioxyphenyl (carbene formation → quasi-irreversible CYP-Fe complex)
  • Thiophene, furan, and thiazole rings (S-oxidation or epoxidation → reactive electrophiles)
  • Hydrazines and alkylamines (N-oxidation → nitroso/nitro intermediates)
  • para-Aminophenols and anilines (quinone-imine formation)

We recommend TDI testing when your compound contains any of these structural alerts or when the reversible IC50 is ≤10 µM for any CYP isoform.

MS-Based vs. Fluorometric CYP Inhibition Assays — A Technical Comparison

FeatureLC-MS/MS Cocktail AssayFluorometric Probe AssayP450-Glo™ Luminescent
Detection PrincipleMRM quantification of metabolite by massFluorescence of released fluorophoreLuciferin-luciferase luminescence
Cocktail Capability7–8 isoforms in single incubation1 isoform per well (wavelength limit)Typically 1 isoform per well
Compound Optical InterferenceNone — mass-based detectionHigh — autofluorescence, quenching, IFELow
Probe Substrate TypeDrug-like small moleculesSynthetic fluorogenic moleculesPro-luciferin substrates
TDI CompatibilityClean — NADPH does not interfereComplicated — NADPH may affect signalPossible with pre-incubation
DMSO Sensitivity≤0.1% required for CYP2E1 accuracyVariable by isoformMore DMSO-tolerant
Regulatory AcceptanceFully accepted for IND/NDAAccepted but interference must be ruled outAccepted for early screening
False Positive RateLowModerate to highLow
False Negative RateLowModerateLow to moderate

Applications of CYP450 Inhibition Screening in Drug Development

CYP450 inhibition screening is a regulatory-mandated component of drug development. Below are representative scenarios where our LC-MS/MS cocktail panel provides high-impact data.

IND/NDA Regulatory Submissions

CYP450 inhibition data is a mandatory component of every IND application. The IND expects IC50 values for at least CYP1A2, 2B6, 2C8, 2C9, 2C19, 2D6, and 3A4, with TDI assessment where warranted. Our report format is designed for direct inclusion in Common Technical Document Modules 2.6.4 and 2.7.2.

Lead Optimization and Candidate Ranking

A compound with potent CYP3A4 inhibition (IC50 < 1 µM) may still be developable if the therapeutic dose is low, but it will carry a DDI risk that must be managed throughout clinical development. Our multi-isoform IC50 panel enables side-by-side comparison of lead candidates across all major CYP isoforms, supporting data-driven candidate nomination.

Drug-Drug Interaction Risk Assessment

The IND recommends a tiered DDI risk framework. If the [I]/IC50 ratio (where [I] is the estimated clinical inhibitor concentration) exceeds 0.02 for a given CYP isoform, a clinical DDI study with a sensitive CYP substrate is recommended. Our panel provides the quantitative IC50 data needed to apply this framework.

Reactive Metabolite Safety Assessment

Early identification of TDI liability — through our ±NADPH pre-incubation design — enables medicinal chemistry teams to modify problematic structural motifs before investing in advanced preclinical development, reducing late-stage attrition risk.

Combination Drug Development

For fixed-dose combination products, assessing CYP inhibition liability of each component is critical to predicting pharmacokinetic interactions and ensuring the safety of co-administered therapies.

Sample Requirements for CYP450 Inhibition Testing

Sample TypeRequired AmountConcentrationSolventPurityNotes
Test Compound (Standard Panel)1–5 mg solid OR 100 µL of 10 mM stock10 mM stockDMSO≥90%Provide MW, LogD, solubility; DMSO final ≤0.1%
Test Compound (TDI Add-on)Additional 1–3 mg OR 50 µL of 10 mM stock10 mM stockDMSO≥90%2× compound for ±NADPH parallel pre-incubations
Test Compound (Poor Solubility)2–5 mg solidAs aboveDMSO or ACN stock≥90%Provide solubility data; ACN co-solvent ≤0.5%
Positive Control InhibitorsNot requiredIn-house reference panel with verified IC50 ranges

Human liver microsomes (pooled, ≥20 donors), NADPH cofactor, probe substrate cocktail, and all buffer components are provided by our laboratory. For plasma protein binding assessment or hepatocyte-based CYP phenotyping beyond this panel, please contact our project management team.

Deliverables and Regulatory Report Format

  • IC50 summary table: IC50, Hill slope, R², and 95% confidence intervals for all CYP isoforms, with TDI shift ratios where applicable
  • Dose-response curves: Individual IC50 plots for each CYP isoform with positive control overlaid for QC verification
  • Positive control QC report: Experimental IC50 values versus published literature reference ranges
  • Representative MRM chromatograms: Extracted ion chromatograms for each probe metabolite at selected concentrations
  • Methods documentation: Complete instrument parameters, incubation conditions, and HLM lot information for regulatory submission
  • Raw data files: LC-MS/MS vendor-format data files (.wiff, .raw, or .d) available upon request

Representative CYP450 Inhibition Data

CYP450 inhibition multi-isoform IC50 panel demo grid — 4×2 dose-response curves across 8 CYP isoforms

Multi-Isoform CYP Inhibition IC50 Panel

After LC-MS/MS analysis across an 8-point concentration series, IC50 values are displayed as a 4×2 dose-response grid. Each panel shows percent CYP activity on the Y-axis against log compound concentration on the X-axis, with the four-parameter logistic fit overlaid and IC50 annotated — enabling rapid visual comparison across all isoforms.

CYP450 inhibition IC50 dose-response curve with positive control overlay

Single CYP Dose-Response with Positive Control

An expanded dose-response plot displays the full sigmoidal curve with Hill slope, IC50, and 95% confidence interval. The positive control inhibitor dose-response is overlaid, with its experimental IC50 compared to the literature reference range — confirming assay performance for that batch.

CYP450 time-dependent inhibition IC50 shift TDI plot — ±NADPH curves

Time-Dependent Inhibition IC50 Shift

For TDI assessment, the ±NADPH dose-response curves are displayed together with the IC50 shift ratio annotated. A ≥1.5-fold leftward shift in the +NADPH curve (lower IC50 after metabolic pre-activation) signals TDI liability, immediately interpretable for medicinal chemistry teams.

FAQ

Frequently Asked Questions About CYP450 Inhibition Testing

Q: What CYP450 isoforms are included in the standard inhibition panel?

Our standard LC-MS/MS cocktail panel simultaneously evaluates seven major hepatic CYP isoforms: CYP1A2, 2B6, 2C8, 2C9, 2C19, 2D6, and 3A4/5 — together accounting for over 90% of marketed drug metabolism. CYP2E1 is available as an optional add-on with optimized DMSO control (≤0.1% v/v).

Q: How does MS-based CYP inhibition compare to fluorometric assays?

MS-based detection measures the probe substrate metabolite directly by its mass-to-charge ratio via MRM, completely bypassing optical interference from autofluorescent or quenching test compounds. The result is an IC50 value reflecting genuine CYP inhibition potency, not the compound's optical properties.

Q: Do I need time-dependent inhibition testing for my compound?

TDI testing is strongly recommended for compounds advancing toward candidate nomination, particularly if they contain structural alerts (terminal alkenes/alkynes, methylenedioxyphenyl, thiophene, furan, hydrazine, alkylamine motifs). The FDA 2020 DDI Guidance recommends TDI when reversible IC50 is ≤10 µM. Our add-on uses a parallel ±NADPH 30-minute pre-incubation with ≥1.5-fold IC50 shift as the TDI risk threshold.

Q: What is the cocktail approach and why use it?

The cocktail approach combines 7-8 FDA-recommended probe substrates into a single incubation with your test compound and pooled HLM. LC-MS/MS MRM distinguishes all metabolites simultaneously by their distinct precursor-to-product ion transitions. This reduces compound consumption by approximately 8-fold while maintaining IC50 accuracy equivalent to individual probe methods.

Q: Are MS-based IC50 results comparable to historical fluorometric data?

For non-interfering compounds, LC-MS/MS and fluorometric IC50 values show strong concordance. For compounds with fluorescence interference, MS-based values may differ substantially — and more accurately reflect genuine inhibitory potency. We include positive control inhibitors in every batch with IC50 verification against literature reference ranges.

Q: How do you handle compounds with poor solubility or high protein binding?

We can optimize the incubation solvent system using acetonitrile or methanol co-solvent at ≤0.5% (v/v). For highly protein-bound compounds, the free fraction in microsomal incubation (0.1–0.5 mg/mL HLM protein) affects apparent IC50, and we can advise on adjusted designs for unbound IC50 determination.

Q: Is the report suitable for IND submission?

Yes. Our report includes IC50 summary tables with 95% confidence intervals, dose-response curves, positive control QC verification, and complete methods documentation — aligned with IND/NDA Module 2.6.4 (Pharmacology Written Summary) and 2.7.2 (Clinical Pharmacology Summary). Raw data files are available upon request.

Q: Why is DMSO concentration critical?

DMSO inhibits CYP enzyme activity at elevated concentrations, with CYP2E1 particularly sensitive at DMSO levels as low as 0.5% (v/v). Our protocol maintains DMSO at ≤0.1% (v/v) final concentration, ensuring reliable data across all CYP isoforms. Many high-throughput fluorometric protocols at 0.5–1% DMSO can generate false-positive CYP2E1 inhibition calls.

References

  1. U.S. Food and Drug Administration. Drug Development and Drug Interactions — Table of Substrates, Inhibitors and Inducers. FDA, Current as of June 2023.
  2. U.S. Food and Drug Administration. Clinical Drug Interaction Studies — Cytochrome P450 Enzyme- and Transporter-Mediated Drug Interactions. Guidance for Industry. FDA, January 2020.
  3. International Council for Harmonisation. ICH M12 Guideline on Drug Interaction Studies. ICH, May 2024.
  4. Valicherla GR, Mishra A, Lenkalapelly S, et al. Investigation of the inhibition of eight major human cytochrome P450 isozymes by a probe substrate cocktail in vitro with emphasis on CYP2E1. Xenobiotica. 2019;49(12):1396-1402.

Plan your CYP screening campaign with the MassTarget™ team

Share your compound details and our scientists will design a tailored CYP450 inhibition panel strategy for your drug development program.

Online Inquiry

Please submit a detailed description of your project. We will provide you with a customized project plan to meet your research requests. You can also send emails directly to for inquiries.

* Email
Phone
* Service & Products of Interest
Services Required and Project Description