Interactome and Network Target Identification Service

Five integrated service lines for comprehensive protein interaction network mapping and druggable target discovery — from AP-MS and BioID through XL-MS, HDX-MS, and LiP-MS.

Your team has a protein of interest — a disease-associated kinase from a GWAS study, a receptor implicated in tumor progression, or a hit from a phenotypic screen. The more important question for drug discovery is: which of its interaction partners represent druggable intervention points in the disease network?

The MassTarget platform addresses this challenge through five complementary interactome service lines — Affinity Purification MS (AP-MS), Proximity-Dependent Biotinylation (BioID/TurboID), Cross-Linking MS (XL-MS), HDX-MS for Epitope Mapping, and Limited Proteolysis MS (LiP-MS) — each designed to answer a specific type of protein interaction question.

Key Advantages:

  • Five integrated interactome methods — AP-MS, BioID, XL-MS, HDX-MS, and LiP-MS
  • Dedicated BioID/TurboID pipeline for membrane proteins and transient interactors
  • XL-MS and HDX-MS for structural interaction details
  • Full bioinformatics with SAINT scoring and network visualization
  • Biophysical validation (BLI/SPR) available as integrated downstream step
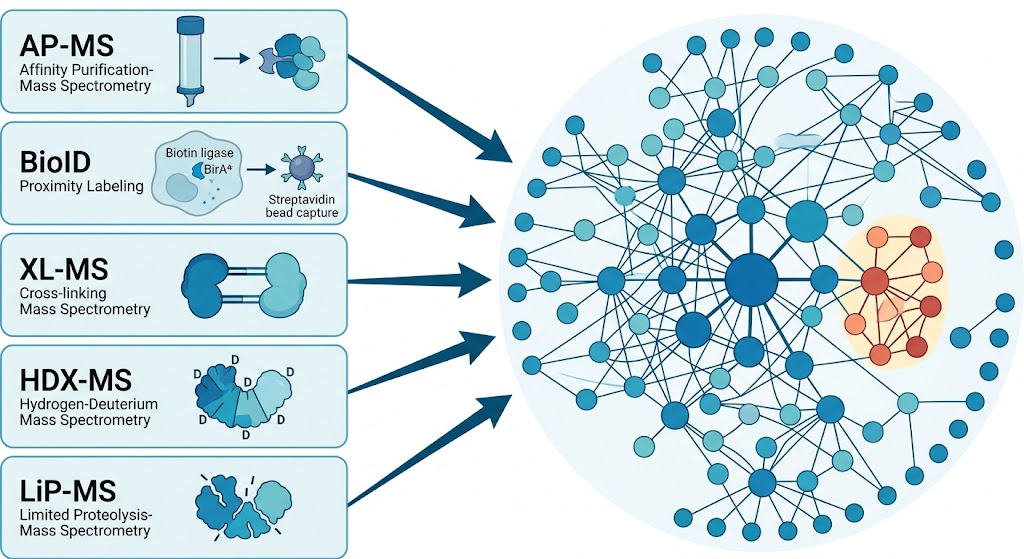
Interactome and network target identification platform showing five service lines converging from AP-MS, BioID, XL-MS, HDX-MS, and LiP-MS through bioinformatics to prioritized druggable targets in a protein interaction network.
Overview Service Lines Workflow Applications Demo Data Sample Bioinformatics Why Choose Case Study FAQ

From Interactome to Actionable Drug Targets

Proteins do not function in isolation. They exist within complex interaction networks where physical contacts between proteins drive signal transduction, subcellular trafficking, metabolic regulation, and disease pathogenesis. Understanding these networks at a mechanistic level is essential for identifying the most therapeutically relevant nodes. A target identified in its network context — with knowledge of its interaction partners, complex composition, and pathway connectivity — is fundamentally different from a target identified as a singleton hit.

The MassTarget platform addresses this challenge through an integrated suite of interactome mapping and network target identification services. We offer five complementary service lines — Affinity Purification MS (AP-MS), Proximity-Dependent Biotinylation (BioID/TurboID), Cross-Linking MS (XL-MS), HDX-MS for Epitope Mapping and Interaction Interfaces, and Limited Proteolysis MS (LiP-MS) — each designed to answer a specific type of protein interaction question. Combined with our biophysical validation capabilities (BLI, SPR) and downstream network analysis pipeline, these service lines enable your team to move from a bait protein to a prioritized list of candidate targets within a single coordinated project engagement.

For broader target discovery support, our thermal proteome profiling (TPP) service provides complementary cellular target engagement data at the proteome scale.

Five Service Lines for Comprehensive Interactome Mapping

No single method captures the full complexity of a protein's interaction network. The MassTarget platform offers five dedicated service lines, each optimized for a specific type of interaction question.

Affinity Purification MS (AP-MS)

The foundational approach for interactome mapping. Bait protein expressed with an affinity tag (FLAG, StrepII, HA) is purified under native conditions and co-purified proteins identified by LC-MS/MS. Captures stable complexes; effective for comparing wild-type vs mutant interaction profiles. Includes stringent washing, LFQ quantification, and SAINT scoring.

Proximity Biotinylation (BioID/TurboID)

A BirA* or TurboID fusion biotinylates proteins within ~10 nm of the bait in living cells. Captures both stable and transient interactions, including those lost during detergent purification. Ideal for membrane proteins, insoluble baits, and organelle contact site mapping. Dedicated pipeline covers construct design, labeling optimization, and background subtraction.

Cross-Linking MS (XL-MS)

Chemical crosslinkers (DSSO, BS3) covalently link interacting proteins, identifying which specific residues mediate each contact. Enables structural modeling of complexes, interaction interface determination, and conformational change mapping. Supports both targeted (single-complex) and proteome-wide applications.

HDX-MS for Epitope Mapping

Hydrogen-deuterium exchange MS maps interaction interfaces by detecting reduced deuterium uptake at protected regions upon complex formation. Provides peptide-level resolution of binding sites for antibody-epitope characterization, protein-protein interface mapping, and conformational change analysis.

Service Line 5 — Limited Proteolysis MS (LiP-MS). LiP-MS probes interaction-induced conformational changes by exploiting differential proteolytic cleavage patterns. When a protein binds a partner, its cleavage fingerprint changes, reporting allosteric effects and conformational rearrangements. Available in both targeted (selected protein pairs) and proteome-wide (LiP-Quant) formats. For orthogonal biophysical validation of identified interactions, our bio-layer interferometry (BLI) and surface plasmon resonance (SPR) services provide label-free kinetic confirmation with affinity measurements.

Our Workflow — From Bait to Prioritized Network Map

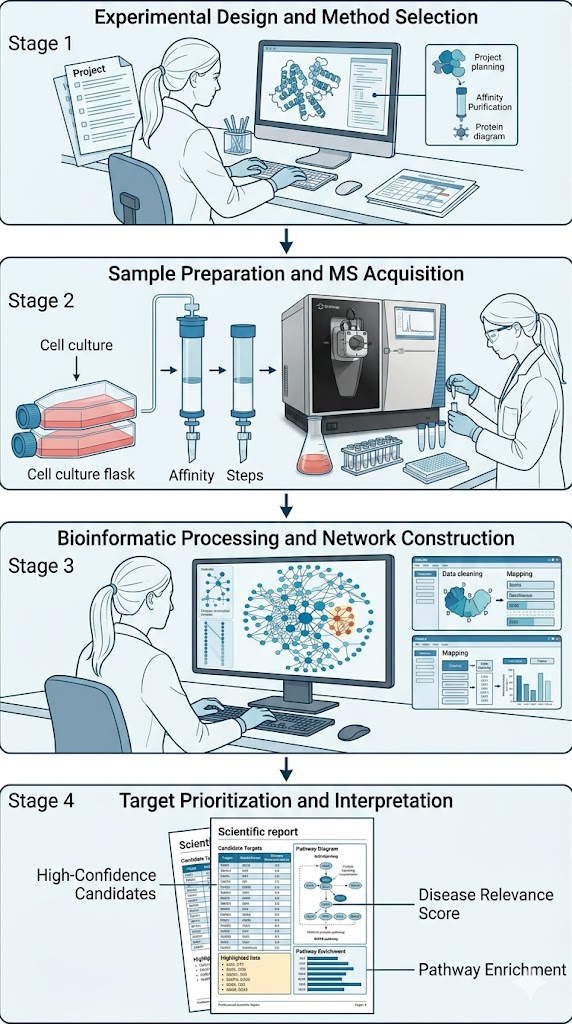
A four-stage process designed to generate high-confidence interaction networks with prioritized candidate targets.

1

Experimental Design and Method Selection

We begin with a structured consultation to understand your bait protein, biological context, and research question. We recommend the optimal combination of service lines — a soluble recombinant protein with well-characterized antibodies might start with AP-MS; an uncharacterized membrane protein would benefit from BioID as the primary method.

2

Sample Preparation and MS Acquisition

Bait constructs are prepared (tagged expression constructs for AP-MS/BioID, or antibody validation for endogenous AP-MS). Samples are processed through the selected workflows under optimized conditions. All MS data is acquired on high-resolution Orbitrap instruments with project-specific gradient lengths.

3

Bioinformatic Processing and Network Construction

Raw data is processed through our integrated bioinformatics pipeline: protein identification (MaxQuant, Proteome Discoverer), SAINT and MiST scoring to distinguish true interactors from background, crosslinked peptide identification for XL-MS, and HDX or LiP difference analysis.

4

Target Prioritization and Interpretation

Network topology analysis identifies hub proteins and disease-associated modules using centrality metrics and community detection. Functional enrichment and disease association analysis annotate each interactor's biological context. We provide a written interpretation with prioritized candidate targets, including rationale for druggability.

Four-stage workflow for interactome mapping: experimental design, sample prep and MS acquisition, bioinformatics and network construction, target prioritization and interpretation.

Key Applications in Drug Discovery

Interactome and network target identification is directly applicable across multiple drug discovery stages and therapeutic modalities.

Target ID for Phenotypic Hits

When a phenotypic screen yields active compounds with unknown mechanisms, interactome mapping identifies the affected protein interaction network. Comparing treated vs untreated interactomes, or using the compound as an affinity bait, reveals engaged targets and affected pathways. For orthogonal compound-centric approaches, our affinity selection MS (AS-MS) service provides complementary label-free binding data.

Output: Engaged protein list with SAINT confidence scores; pathway enrichment of affected network modules.

MoA Deconvolution and Off-Target Profiling

For candidates advancing toward preclinical development, a complete mechanism-of-action understanding is essential. Interactome profiling of the known target, combined with differential interaction analysis across treated vs control conditions, reveals pathway-level effects and off-target interactions that directly inform safety assessment and medicinal chemistry strategy.

Output: Differential interactor table; off-target list with confidence scores; pathway context for each identified off-target.

Oncoprotein Interaction Network Discovery

Cancer driver mutations alter protein interaction networks. Comparing wild-type vs mutant oncoprotein interactomes (KRAS, EGFR, BRAF) identifies mutation-specific interactions as selective therapeutic vulnerabilities. Integration with our phosphoproteomics activation mapping service adds a signaling dimension to the interactome data.

Output: Mutation-specific interactor list; differential network comparison; integrated phospho-interactome map.

Biologics Target and Epitope Discovery

For antibody-based therapeutic programs, HDX-MS epitope mapping directly defines the antibody binding interface on the target protein at peptide resolution. This provides structural rationale for epitope selection, cross-reactivity assessment across species orthologs, and mechanism-of-action differentiation between lead candidates.

Output: HDX difference map with peptide-level protection; epitope residues identified; comparative epitope map across antibody panels.

Drug Repurposing Through Network Analysis

Mapping the interactome of a disease-associated protein can reveal unexpected connections to known drug targets. Network-based approaches integrating interactome data with drug-target databases identify repositioning opportunities for existing drugs to new indications with reduced preclinical risk.

Output: Network-based drug-target connectivity map; repurposing candidate list with supporting evidence.

Neurodegenerative Target Discovery

Proteins implicated in neurodegeneration — tau, alpha-synuclein, TDP-43, huntingtin — function through complex interaction networks that change with disease progression. BioID and AP-MS mapping across disease-relevant conditions reveals aggregation-dependent interaction changes and identifies modifiable network nodes.

Output: Disease-state differential interactome; aggregation-sensitive interactor list; prioritised intervention points.

Representative Results

AP-MS Interactome of a Receptor Tyrosine Kinase

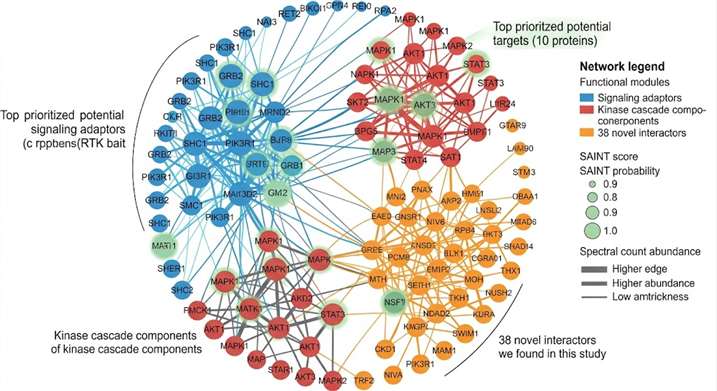
A receptor tyrosine kinase bait expressed with C-terminal FLAG tag in HEK293T cells. After anti-FLAG purification and triplicate LC-MS/MS, 142 high-confidence interactors were identified (SAINT > 0.9, BFDR < 0.05). The interactome included known adaptors (GRB2, SHC1, PIK3R1), downstream signaling components (MAPK1, AKT1, STAT3), and 38 previously unreported interactors. Network analysis revealed enrichment in receptor signaling (FDR = 2.1 x 10⁻⁶), cell migration (FDR = 4.3 x 10⁻⁴), and focal adhesion pathways.

BioID Profiling of a Membrane-Associated Bait

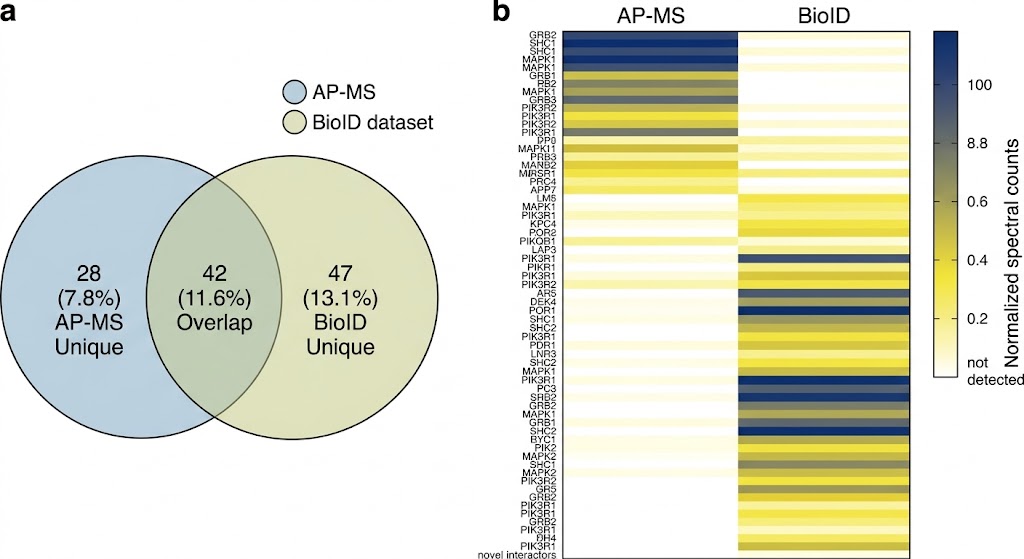
A membrane protein with no soluble domain for AP-MS was profiled by BioID. After biotin labeling, 89 proteins were identified with high confidence (FDR < 0.01). Comparison with AP-MS from a soluble fragment revealed 42 overlapping and 47 uniquely BioID-identified interactors, including transient signaling components and membrane-proximal scaffolds.

XL-MS Topology of a Transcriptional Complex

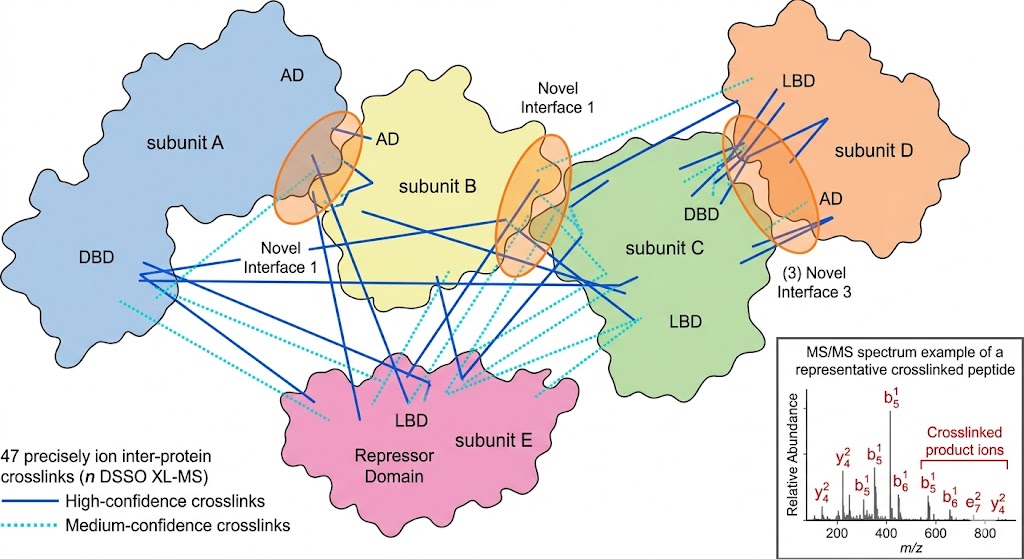
A 5-subunit transcriptional co-regulator complex (~320 kDa) was analyzed by XL-MS with DSSO crosslinking. The analysis identified 47 unique inter-protein crosslinks, revealing the complex's overall topology. Three uncharacterized interaction interfaces were mapped to specific domains, enabling refined structural modeling for mutagenesis studies.

Demo Results — Visualized Interactome Data

AP-MS interactome network visualization for a receptor tyrosine kinase bait showing 142 high-confidence interactors as colored nodes in a Cytoscape-style network layout with hub proteins highlighted and functional modules annotated.

AP-MS interaction network: receptor tyrosine kinase interactome

Cytoscape network visualization of 142 high-confidence interactors for a FLAG-tagged receptor tyrosine kinase. Node size proportional to SAINT probability score; edge thickness represents spectral count. Functional modules color-coded: signaling adaptors (blue), kinase cascade components (red), and novel interactors (orange). Green nodes highlight the top 10 targets prioritized for follow-up validation.

BioID proximity labeling comparison heatmap showing AP-MS and BioID interactor overlap for a membrane protein bait, with Venn diagram and intensity heatmap distinguishing shared, AP-MS-unique, and BioID-unique interactors.

BioID vs AP-MS comparison: method complementarity for membrane proteins

Comparison of AP-MS and BioID datasets for a membrane-associated bait. Left panel: Venn diagram showing 42 overlapping interactors, 28 AP-MS-unique (stable complex members), and 47 BioID-unique (transient and proximity-dependent). Right panel: heatmap of normalized spectral counts for combined interactors across both methods, revealing distinct interaction profiles that together provide a more complete interactome.

XL-MS crosslink map showing 47 inter-protein crosslinks connecting five subunits of a transcriptional co-regulator complex with identified interaction interfaces mapped to specific domain regions.

XL-MS topology map: transcriptional complex interaction interfaces

DSSO crosslinking analysis of a 5-subunit (~320 kDa) transcriptional co-regulator complex. Connecting lines represent 47 identified inter-protein crosslinks with their ±0.5 Da mass accuracy. Three previously uncharacterized interaction interfaces (highlighted in orange) were mapped to specific domain regions, enabling a refined structural model that guided functional validation mutagenesis.

Sample Requirements

Sample TypeMinimum per ConditionRecommendedAmountFormat
Cell pellets (AP-MS/BioID)2 conditions3-5 conditions2 x 107 cellsDry pellet, snap-frozen
Cell pellets (XL-MS)2 conditions3 conditions5 x 107 cellsDry pellet, snap-frozen
Tissue (fresh-frozen, AP-MS)3 per group5 per group50-100 mgCryovial, LN2 frozen
Purified complex (XL-MS/HDX)--50-200 microgBuffer, flash-frozen
Expression construct12-35-10 microgPurified DNA

Note: For BioID, a BirA*-only control is essential. For AP-MS, an untagged or IgG control is recommended. Three or more biological replicates per condition are recommended for SAINT scoring. All samples should be shipped on dry ice in labelled, sealed tubes.

Bioinformatics and Network Analysis

Our bioinformatics pipeline is purpose-built for interactome data, covering the full spectrum from raw spectra to biological interpretation.

Data Processing and Statistical Filtering. Raw MS data is processed using MaxQuant or Proteome Discoverer. SAINT (Significance Analysis of INTeractome) probability scoring and MiST statistics distinguish true interactors from nonspecific background. Only interactions with SAINT probability > 0.9 and BFDR < 0.05 are reported as high-confidence.

Network Construction and Visualization. High-confidence interactors are assembled into interaction networks using STRING, BioGRID, and IntAct. Network visualization in Cytoscape highlights hub proteins, densely connected modules, and bait-centered landscapes. Topological metrics — degree centrality, betweenness, closeness — identify nodes critical for network stability.

Functional and Disease Association. GO enrichment, KEGG and Reactome pathway analysis, and disease association mapping (DisGeNET, OMIM) annotate the functional context of each interactor. Network modules enriched in disease-associated genes are flagged as candidate target modules.

Cross-Method Integration. For projects combining AP-MS and BioID, our integrated analysis classifies each interaction into three categories: (1) high-confidence interactions supported by both methods, (2) transient/proximity-dependent interactions uniquely identified by BioID, and (3) stable complex components preferentially enriched by AP-MS.

Why Choose Our Service

CriterionAcademic Core FacilityStandard MS CROOur Integrated Service
Method coverage1 method (AP-MS typical)1 method5 methods (AP-MS + BioID + XL-MS + HDX-MS + LiP-MS)
Bait construct designUser-managedLimited supportFull support with method selection
BioID/TurboID workflowRarely availableNot typically offeredDedicated pipeline (BirA* and TurboID)
XL-MS capabilityNot typically availablePurified complexes onlyTargeted and proteome-wide XL-MS
HDX-MS epitope mappingNot availableNot offeredFull HDX-MS for interaction interfaces
Biophysical validationSeparate engagementNot offeredBLI and SPR as integrated step
Statistical filteringBasic (user-driven)MinimalSAINT + MiST with FDR control
Network analysisNot includedProtein list onlyFull Cytoscape + topological metrics
Cross-method integrationNot availableNot availableAP-MS + BioID integrated classification

What sets us apart: Five complementary interactome service lines within a single project engagement. Dedicated BioID/TurboID and HDX-MS workflows rarely offered by standard CROs. Full bioinformatics pipeline from raw data through SAINT scoring, network visualization, and target prioritization with disease association context.

Case Study: Combined AP-MS and BioID for Comprehensive Interactome Mapping

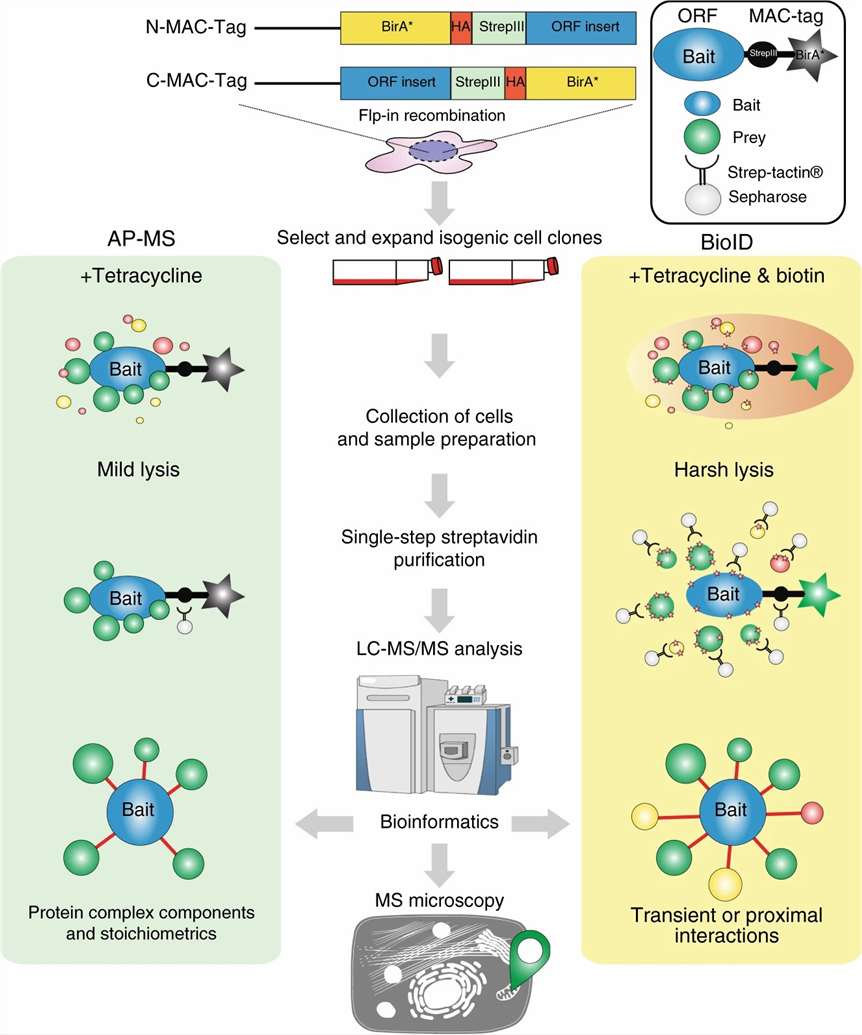
Liu X, Salokas K, Tamene F, et al. "An AP-MS- and BioID-compatible MAC-tag enables comprehensive mapping of protein interactions and subcellular localizations." Nature Communications, 2018, 9, 1188. DOI: 10.1038/s41467-018-03523-2 (CC BY 4.0).

Background

AP-MS and BioID provide complementary information about protein interaction networks. AP-MS captures stable, detergent-resistant complexes, while BioID detects transient and proximity-based interactions that may be lost during purification. However, performing both methods on the same bait traditionally required separate constructs, cell lines, and optimization — a barrier that limited their combined use.

Methods

The team designed the MAC-tag, a single construct incorporating StrepII (AP-MS), HA (detection), and BirA* (BioID) elements (Fig. 1). The tag was validated on 18 bait proteins representing different subcellular compartments. Each bait was analyzed through both AP-MS and BioID workflows in parallel.

  • Construction of MAC-tag vectors for 18 subcellular marker proteins.
  • Parallel AP-MS (StrepII pulldown) and BioID (streptavidin enrichment) from the same tagged baits.
  • Label-free LC-MS/MS with SAINT scoring for confidence assessment.
  • Network visualization and cross-method comparison of identified interactors.

Results

Combined analysis generated comprehensive interaction networks for all 18 baits (Fig. 3). AP-MS identified 5-30 interactors per bait; BioID captured 30-120, with 30-50% overlap. BioID uniquely identified transient signaling complex members and membrane-proximal proteins. For several baits (LMNA, PSA1), integrated AP-MS/BioID data revealed novel interactions that neither method alone would have confidently identified. The approach also enabled "MS microscopy" — predicting subcellular localization from BioID interaction profiles (Fig. 4).

Conclusions

The MAC-tag system demonstrated that combined AP-MS and BioID profiling from a single construct provides a more complete view of protein interaction networks than either method alone. The study directly supports offering multiple complementary interactome methods within a single service platform: integrated approaches substantially exceed the sum of individual methods.

MAC-tag design (Fig. 1) showing StrepII-HA-BirA* construct and combined AP-MS/BioID interaction networks (Fig. 3) for 18 subcellular marker proteins.

Fig. 1 and Fig. 3 from Liu X, et al. 2018 (Nature Communications). MAC-tag construct design and combined AP-MS/BioID interaction networks for 18 subcellular marker proteins. CC BY 4.0.

FAQ

Frequently Asked Questions

Q: Which interactome method should I choose for my protein?

The choice depends on your bait's properties and biological question. AP-MS is best for soluble proteins where stable complex members are of primary interest. BioID/TurboID is recommended for membrane proteins, insoluble proteins, or when transient interactions are important. XL-MS adds structural contact details. HDX-MS maps interaction interfaces. We frequently recommend a combined AP-MS + BioID approach for comprehensive coverage.

Q: How many control samples are needed?

For each AP-MS or BioID experiment, at least one negative control processed in parallel is essential — untagged cells or BirA*-only for BioID, and untagged or IgG control for AP-MS. Three or more biological replicates per condition are recommended for SAINT scoring. For XL-MS, controls without crosslinker are processed to identify endogenous modifications.

Q: Can you work with endogenous proteins without tag expression?

Yes. For AP-MS, we can use validated antibodies targeting the endogenous protein for immunoprecipitation. Success depends on antibody quality and target abundance. For BioID and TurboID, the BirA*-bait fusion must be expressed, so tagged construct expression is required.

Q: What throughput is realistic for a typical interactome project?

A single AP-MS bait in triplicate plus matched control can be completed in 4-6 weeks. BioID projects require 5-8 weeks including labeling optimization. XL-MS varies from 4-10 weeks. Cross-method projects combining AP-MS + BioID + XL-MS typically require 10-14 weeks for full analysis.

Q: How do you distinguish specific interactors from nonspecific background?

We use a three-tier strategy: (1) stringent washing conditions optimized per bait, (2) parallel negative controls processed identically, and (3) SAINT or MiST statistical scoring to calculate probability scores and FDR. Only interactions with SAINT probability > 0.9 and BFDR < 0.05 are reported as high-confidence.

References

  1. Liu X, Salokas K, Tamene F, et al. "An AP-MS- and BioID-compatible MAC-tag enables comprehensive mapping of protein interactions and subcellular localizations." Nature Communications, 2018, 9, 1188. DOI: 10.1038/s41467-018-03523-2
  2. Huttlin EL, et al. "Dual proteome-scale networks reveal cell-specific remodeling of the human interactome." Cell, 2021, 184(11), 3022-3040. DOI: 10.1016/j.cell.2021.04.011
  3. Meissner F, et al. "The emerging role of mass spectrometry-based proteomics in drug discovery." Nature Reviews Drug Discovery, 2022, 21(9), 637-654. DOI: 10.1038/s41573-022-00409-3

Design your interactome mapping strategy with the MassTarget team

Tell us your bait protein, biological system, and target discovery goals — our scientists will recommend the optimal service line combination and provide a detailed project proposal.

For Research Use Only (RUO). Not intended for diagnostic, therapeutic, or clinical decision-making purposes. Creative Proteomics services are designed to support preclinical research, drug discovery, and mechanism of action studies only.

Online Inquiry

Please submit a detailed description of your project. We will provide you with a customized project plan to meet your research requests. You can also send emails directly to for inquiries.

* Email
Phone
* Service & Products of Interest
Services Required and Project Description