Metabolic Pathway Drug-Response Mapping by LC-MS

Elucidating drug mechanism of action through pathway-level metabolomic profiling.

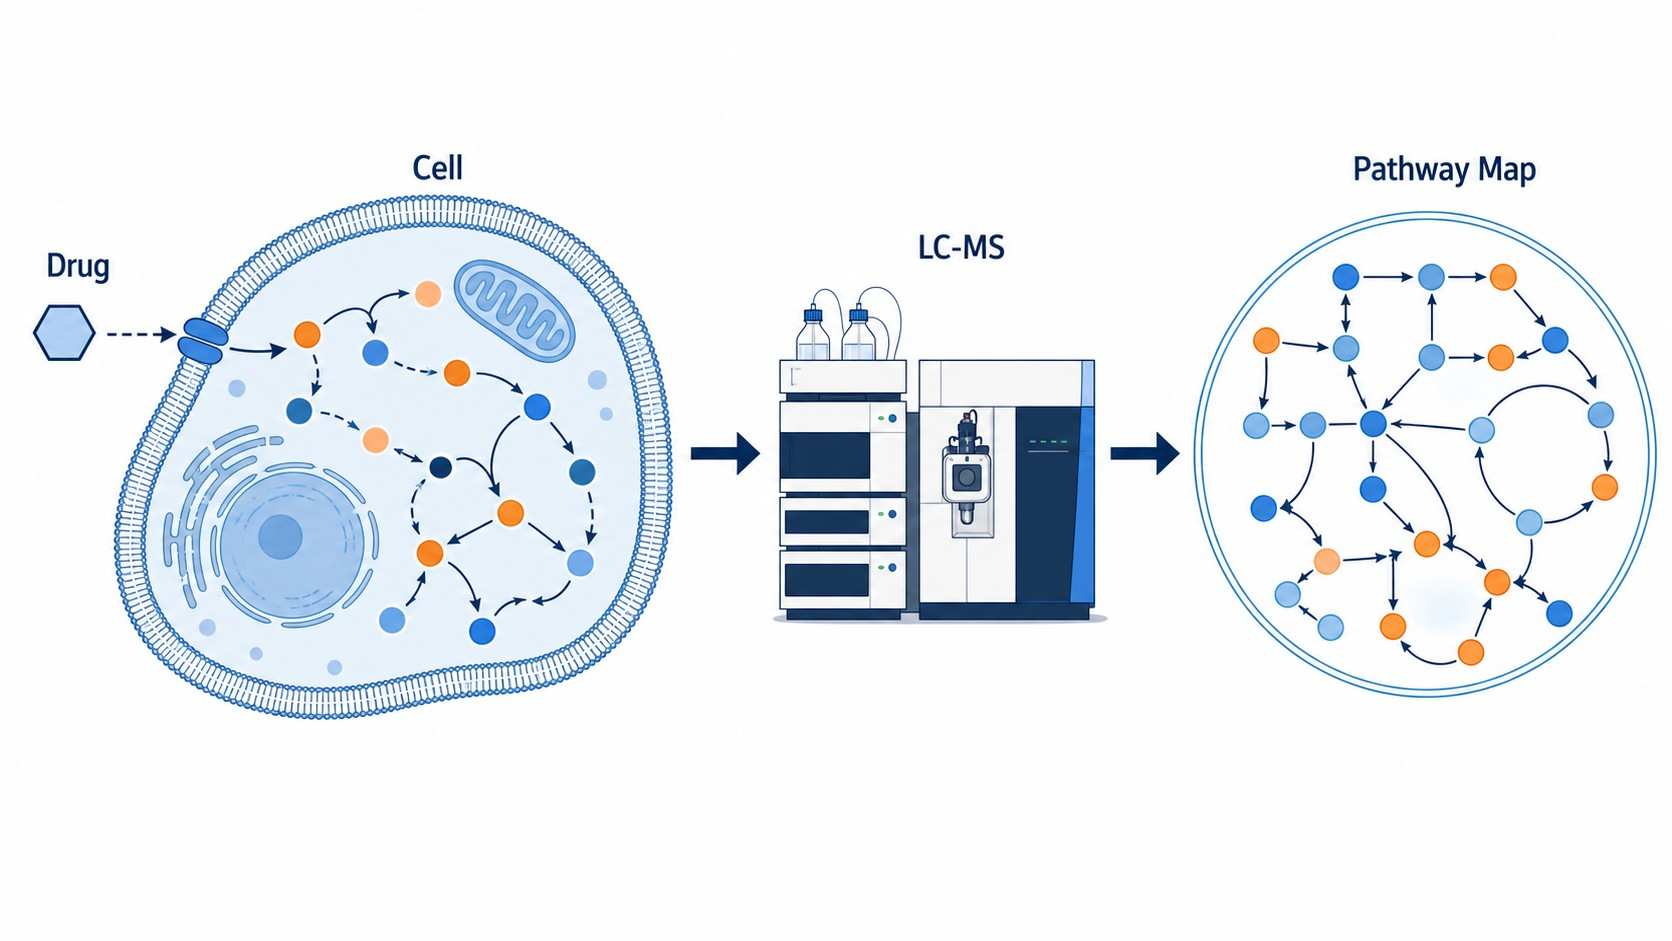
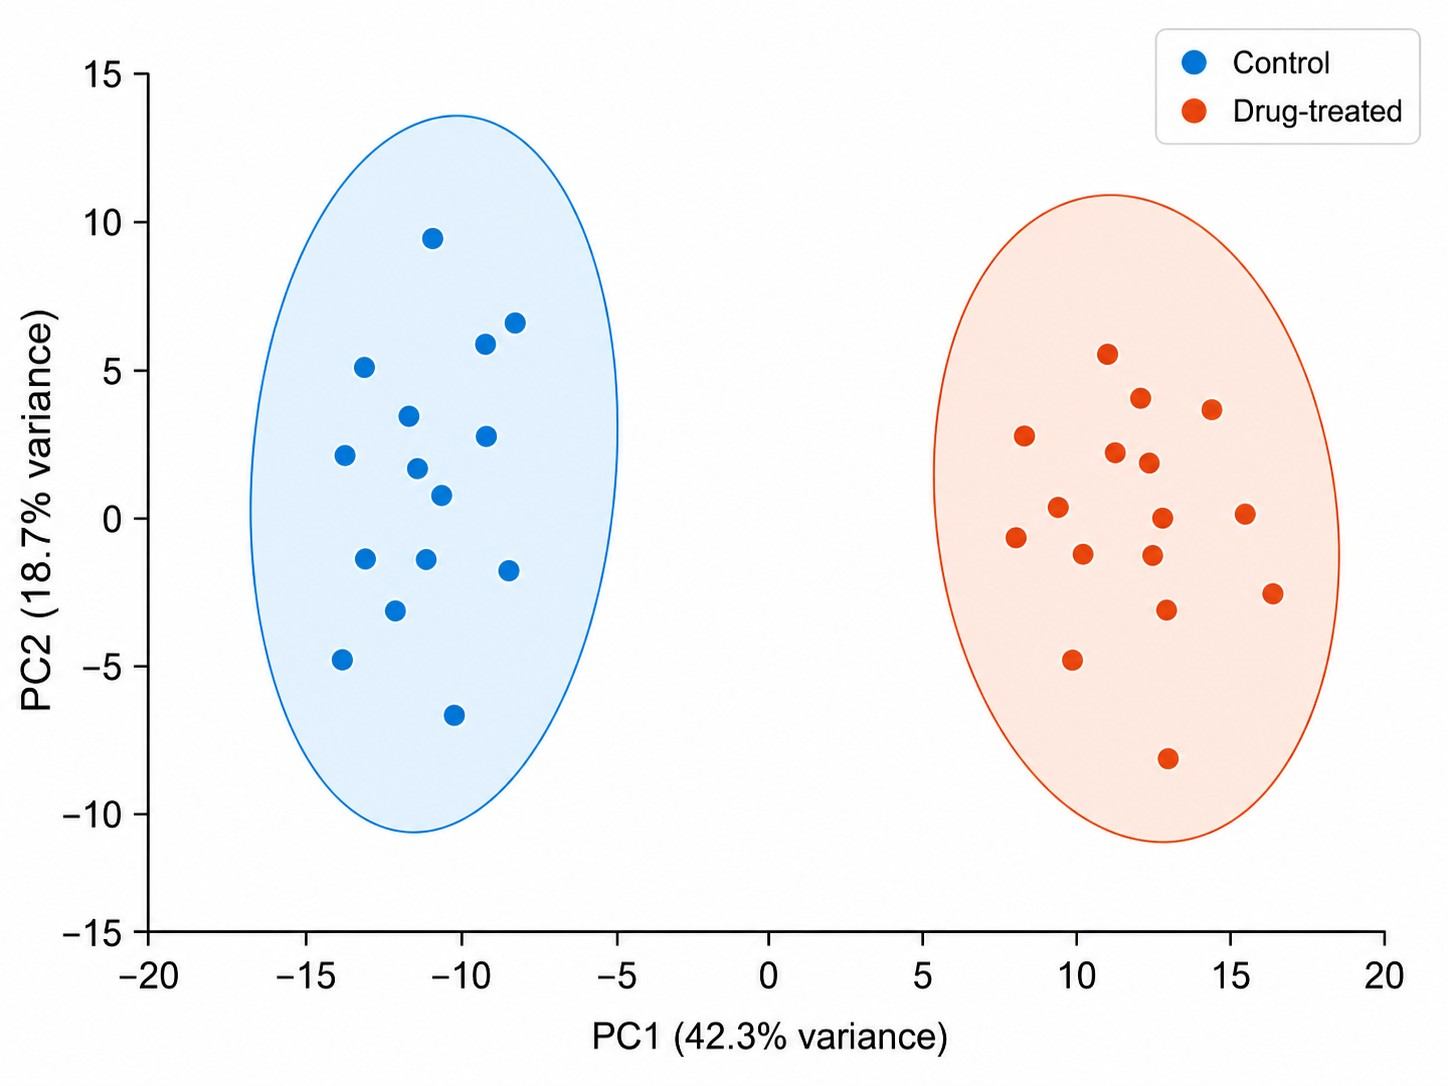
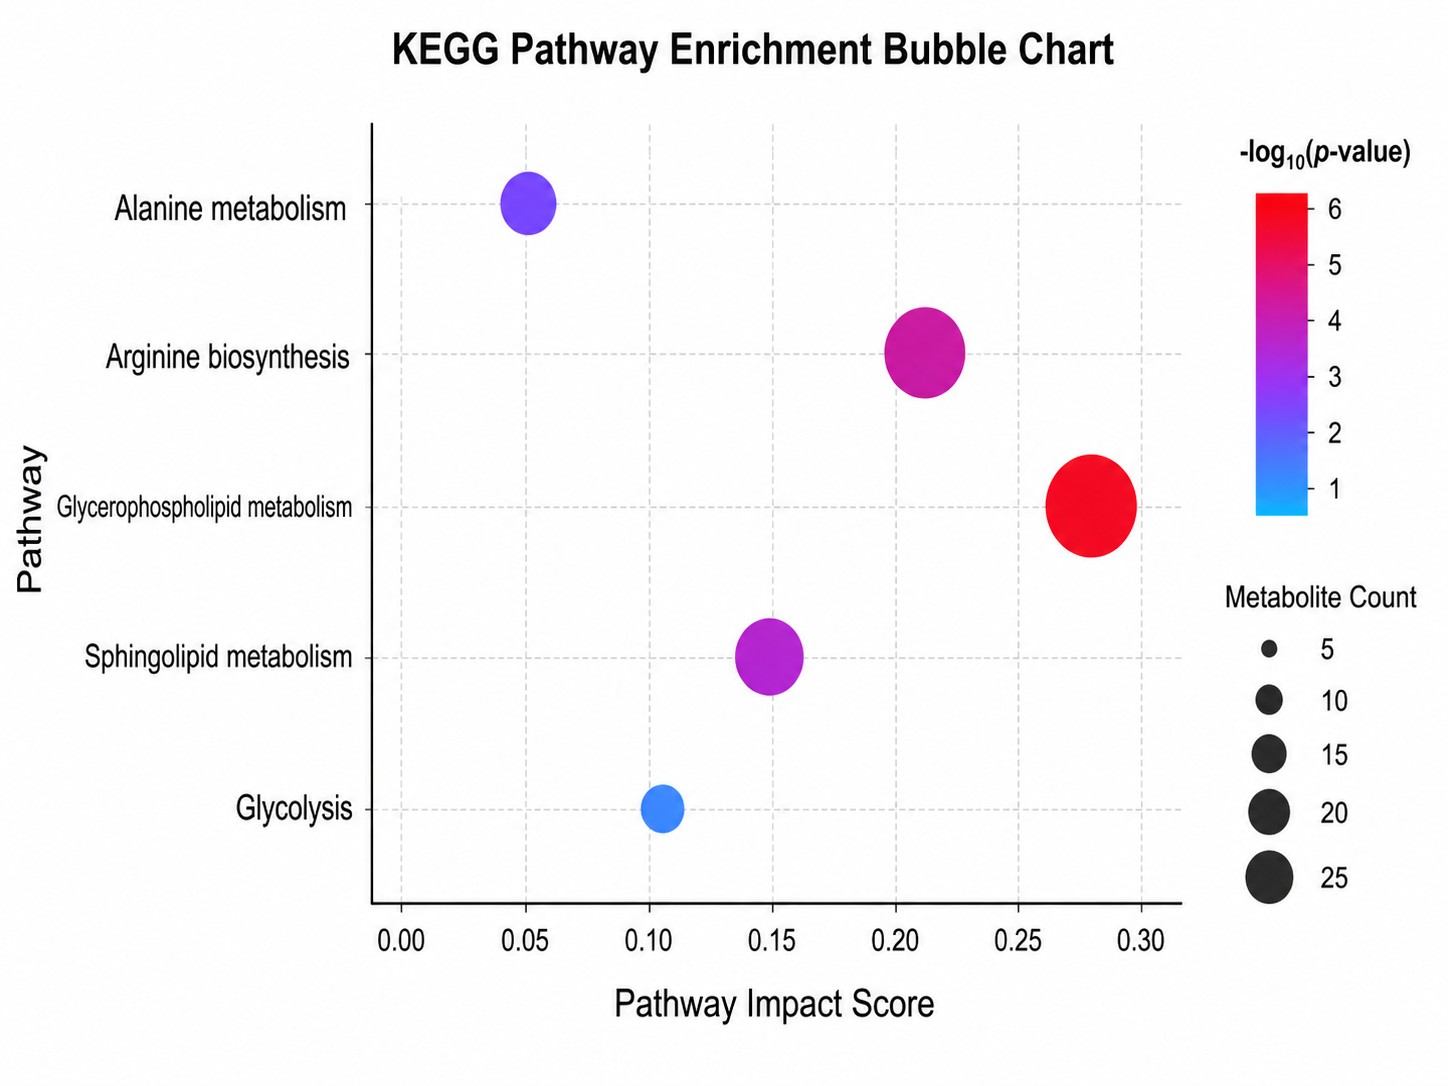
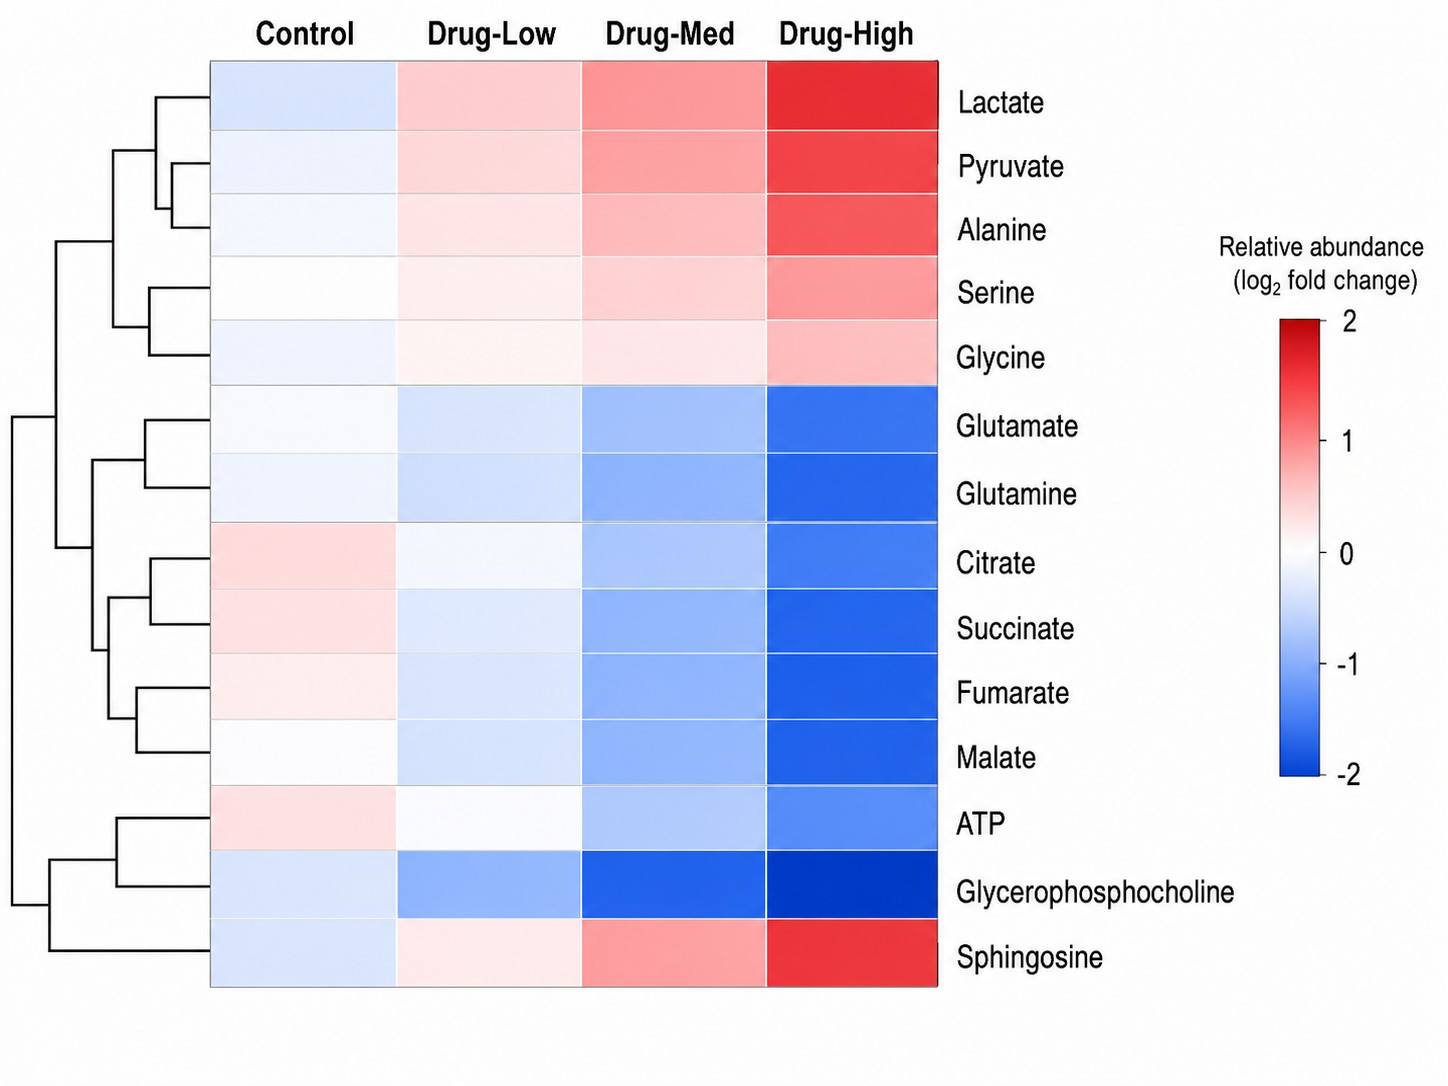
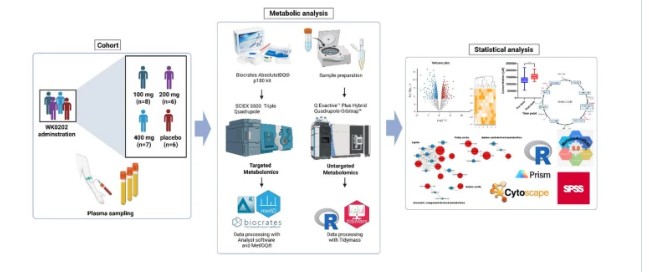
Metabolic Pathway Drug-Response Mapping is an LC-MS-based metabolomics service that profiles global metabolite changes in response to drug treatment, maps these changes onto metabolic pathways, and identifies the specific pathways and metabolites modulated by the compound.

At Creative Proteomics, our MassTarget™ platform integrates high-resolution LC-MS metabolomics with curated pathway analysis pipelines (KEGG, HMDB, MetaboAnalyst) to provide a complete picture of drug-induced metabolic rewiring. Whether you are characterizing a novel compound's MoA, investigating metabolic resistance in oncology models, or screening for off-target metabolic liabilities, our service transforms raw metabolomics data into actionable pathway-level conclusions.

Key Capabilities:

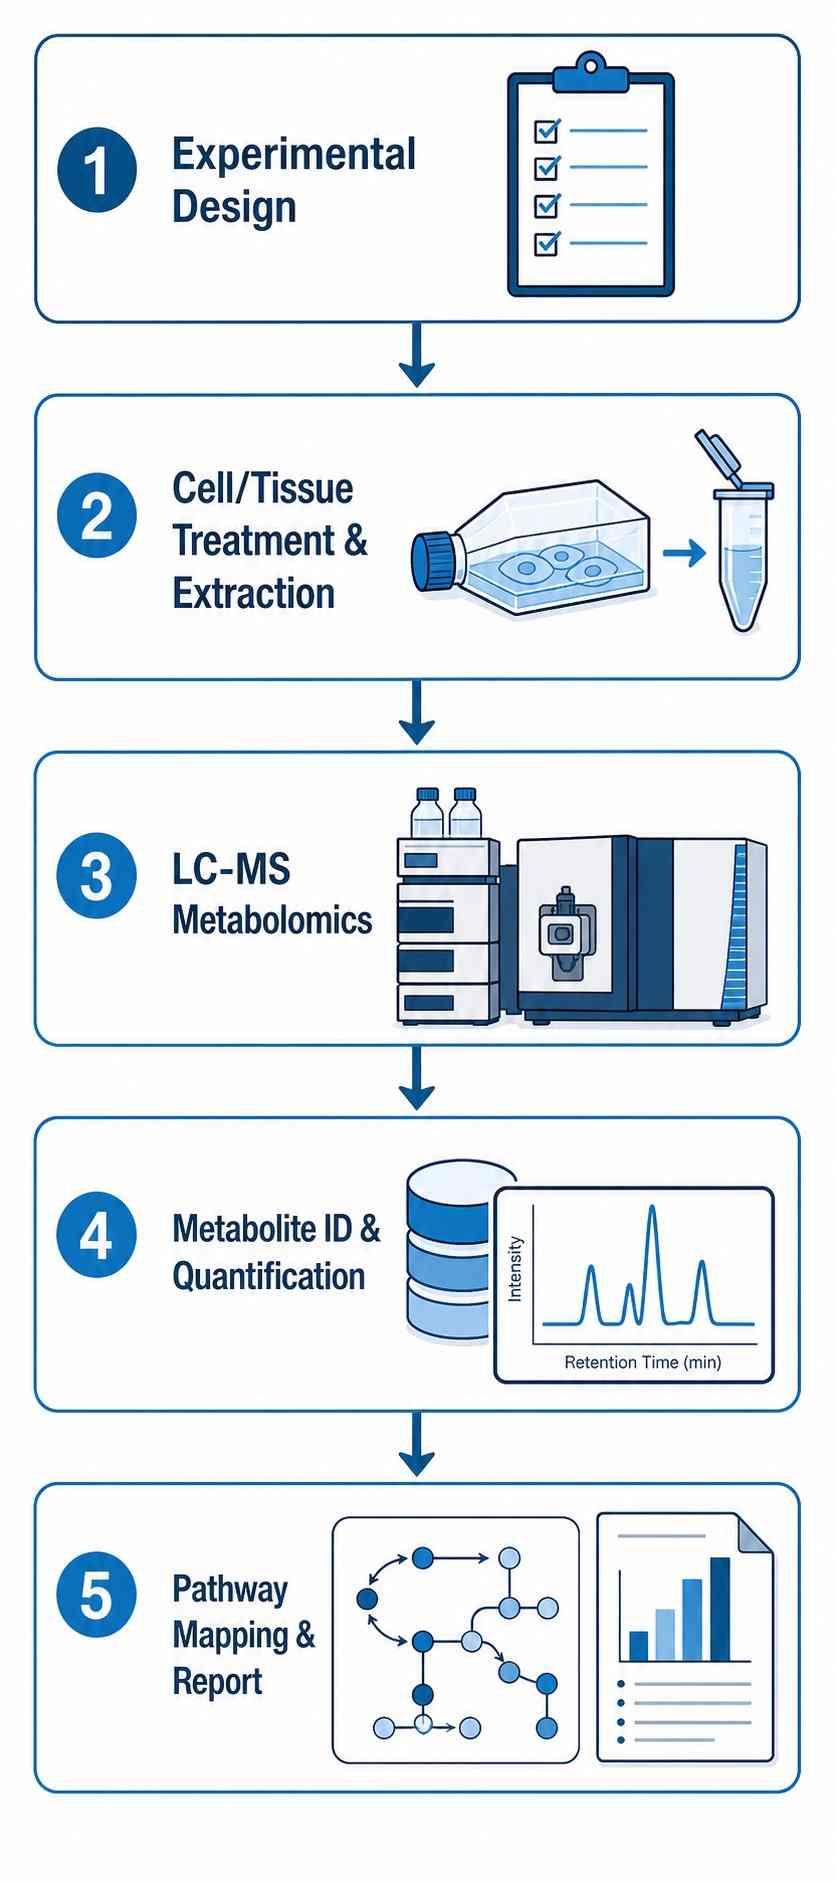
  • Untargeted LC-MS metabolomics covering polar metabolites, central carbon metabolites, amino acids, nucleotides, and lipid species.
  • Comprehensive pathway enrichment analysis with KEGG and HMDB mapping.
  • Time-course and dose-response experimental design expertise.
  • Rigorous QC with pooled QC samples, internal standards, and batch correction.
  • Integration with proteomics and lipidomics for multi-omics pathway analysis.
Metabolic Pathway Drug-Response Mapping platform diagram featuring drug molecule, cellular metabolism perturbation, LC-MS analysis, and KEGG pathway map with color-coded up/down-regulated pathways.
Overview Why Pathway Mapping Workflow Study Design Data Outputs Applications Case Study Sample FAQ

What Is Metabolic Pathway Drug-Response Mapping?

Metabolic Pathway Drug-Response Mapping is a specialized LC-MS-based metabolomics approach designed to characterize how drug treatment alters cellular metabolism at the pathway level. Unlike standard metabolomics, which reports a list of changed metabolites, this service incorporates drug-response experimental design (dose-response, time-course), applies pathway enrichment analysis using curated databases (KEGG, HMDB), and delivers biologically interpretable pathway-level conclusions.

The process begins with treating biological systems (cells, tissues, or biofluids) with the compound of interest, followed by comprehensive LC-MS metabolomic profiling. Significantly altered metabolites are identified through rigorous statistical analysis and mapped onto metabolic pathways to reveal which biological processes are modulated by the drug.

This approach is particularly valuable when conventional pharmacology assays cannot explain a compound's phenotypic effects, when off-target metabolic liabilities need early identification, or when drug resistance involves metabolic rewiring that standard assays fail to capture.

Why Pathway-Level Drug-Response Mapping Matters

MoA elucidation beyond single targets

Conventional pharmacology assays measure single endpoints. Pathway metabolomics reveals the full metabolic network perturbed by a compound, providing mechanistic hypotheses when the molecular target is unknown.

Early detection of off-target metabolic effects

Drugs can modulate metabolic pathways unrelated to the intended target, causing toxicity discovered only late in development. Early pathway-level profiling identifies these liabilities before costly failures.

Drug resistance mechanism discovery

Cancer cells frequently develop resistance by rewiring metabolism — upregulating glycolysis, increasing glutamine dependency, or altering lipid metabolism. Pathway mapping reveals these adaptive changes.

Translational pathway context

Pathway-level data bridges in vitro findings to in vivo relevance, enabling better prediction of clinical efficacy and toxicity compared to single-biomarker or single-pathway approaches.

Conventional Assays vs. Pathway Metabolomics

AspectConventional PharmacologyPathway Metabolomics
ScopeSingle target or pathwayGlobal metabolic network
Mechanism insightDirect target engagementDownstream metabolic consequences
Off-target detectionRequires prior hypothesisUnbiased discovery
Resistance mechanismsNot capturedReveals metabolic rewiring
Translational relevanceLimited to assay conditionsPathway-level context

Service Workflow

Our Metabolic Pathway Drug-Response Mapping service follows a five-stage workflow designed to maximize data quality and biological insight.

STAGE 1

Experimental Design Consultation

We work with your team to define the optimal study design — dose-response, time-course, or full factorial — based on your compound and research question.

STAGE 2

Sample Preparation

Cell lysates, tissue extracts, or biofluids are processed using standardized extraction protocols. Internal standards and pooled QC samples are incorporated for quality control.

STAGE 3

LC-MS Acquisition

Samples are analyzed in randomized order on high-resolution LC-MS platforms (Q Exactive Orbitrap or equivalent) in both positive and negative ionization modes.

STAGE 4

Metabolite Identification & Quantification

Raw data are processed using Compound Discoverer or XCMS. Metabolites are identified by accurate mass (<5 ppm), retention time, MS/MS fragmentation, and database matching.

STAGE 5

Pathway Mapping & Report

Significantly altered metabolites are mapped onto KEGG pathways. Enrichment analysis identifies over-represented pathways, and a comprehensive report with PCA plots, heatmaps, and pathway bubble charts is delivered.

Workflow Overview

The service workflow consists of five essential stages from experimental design to final pathway report:

1

Experimental Design

Define dose-response, time-course, or combination design with appropriate controls.

2

Cell/Tissue Treatment & Extraction

Drug treatment under optimized conditions; quench metabolism and extract metabolites.

3

LC-MS Metabolomics

High-resolution LC-MS acquisition in positive and negative ionization modes with QC interleaving.

4

Metabolite ID & Quantification

Feature detection, alignment, identification, and statistical analysis.

5

Pathway Mapping & Report

KEGG/HMDB pathway enrichment, biological interpretation, and comprehensive report delivery.

Study Design Options

Design TypeDescriptionRecommended For
Single-dose, single time pointOne drug concentration at one time pointPreliminary MoA screening
Dose-response (3–5 doses)Multiple concentrations at one time pointIdentifying dose-dependent pathway effects
Time-course (3–5 time points)Single dose at multiple time pointsCapturing dynamic metabolic rewiring
Full factorial (dose × time)Multiple doses × multiple time pointsComprehensive drug-response characterization
Combination therapyTwo or more drugs alone and in combinationSynergy mechanism studies
Drug resistance comparisonSensitive vs resistant isogenic cell linesResistance mechanism elucidation

Key Data Outputs & Interpretation

DeliverableDescription
Raw LC-MS dataFull MS and MS/MS data files in standard formats (.raw, .mzML)
Processed metabolite tableIdentified metabolites with retention time, m/z, fold change, p-value, and FDR-adjusted q-value
Multivariate analysisPCA score plots, PLS-DA score plots with VIP scores
Univariate analysisVolcano plots, box plots, and bar charts for individual metabolites
Pathway enrichment analysisBubble plot showing enriched KEGG pathways with -log10(p-value) and pathway impact scores
HeatmapsHierarchical clustering heatmaps of significantly altered metabolites across all groups
Pathway reportCurated summary of affected pathways with biological interpretation
Methods sectionComplete experimental details suitable for publication or regulatory submission

Representative Data Visualizations

PCA score plot showing clear separation between drug-treated and control groups in metabolic pathway drug-response mapping.

PCA score plot — drug-treated vs control group separation

KEGG pathway enrichment bubble chart showing significantly enriched metabolic pathways with -log10(p-value) and pathway impact scores.

Pathway enrichment bubble chart — KEGG pathway impact analysis

Hierarchical clustering heatmap of significantly altered metabolites across drug-treated and control groups.

Hierarchical clustering heatmap — significantly altered metabolites

Applications

Metabolic pathway drug-response mapping provides critical insights across multiple stages of the drug discovery and development pipeline.

Drug MoA Elucidation

When a novel compound shows phenotypic activity but the molecular target is unknown, pathway metabolomics identifies the metabolic pathways perturbed by treatment, providing mechanistic hypotheses for follow-up validation.

Related service: Cell-based MS drug screening

Off-Target Metabolic Profiling

Drugs can modulate metabolic pathways beyond their intended target, leading to unanticipated toxicity. Early pathway-level profiling identifies these liabilities before costly late-stage failures.

Related service: CYP450 inhibition panel

Drug Resistance Mechanism Analysis

Cancer cells frequently develop resistance by rewiring their metabolism. Comparing the metabolomes of sensitive vs resistant isogenic cell lines after drug treatment reveals the specific pathways that enable resistance.

Related service: Drug resistance mechanism MS analysis

Combination Therapy Optimization

Understanding the metabolic pathways modulated by each drug in a combination regimen enables rational design of synergistic pairs and identification of antagonistic metabolic interactions.

Toxicity Mechanism Investigation

Drug-induced metabolic toxicity — hepatotoxicity, cardiotoxicity, nephrotoxicity — often involves perturbation of specific metabolic pathways. Pathway mapping identifies the affected pathways, enabling structure-activity optimization.

Biomarker Discovery

Drug-induced metabolite changes can serve as pharmacodynamic biomarkers for clinical development. Pathway-level analysis identifies the most robust and biologically interpretable biomarker candidates.

Related service: Cellular metabolomics screening

Case Study: Pharmacometabolomics Reveals Drug-Induced Metabolic Pathway Changes

Jang Y, Kang J, et al. "Pharmacometabolomics uncovers key metabolic changes in the first-in-human study of β-lapachone derivative." Metabolomics 21:122 (2025). https://doi.org/10.1007/s11306-025-02332-1

Background

β-Lapachone derivatives are a class of anticancer agents that exert their effects through NQO1-mediated oxidative stress. The authors conducted a first-in-human study of WK0202, a novel β-lapachone derivative, and used a pharmacometabolomics approach to characterize drug-induced alterations in endogenous metabolic pathways.

Methods

Both targeted (UPLC-MS/MS) and untargeted (UPLC-Orbitrap MS) metabolomics were performed on plasma samples collected from healthy volunteers before and after WK0202 administration. Multivariate statistical analysis (PCA, OPLS-DA) was used to identify significantly altered metabolites, which were then mapped onto KEGG pathways for enrichment analysis.

Results

WK0202 treatment induced significant changes in multiple metabolic pathways, including alanine, aspartate, and glutamate metabolism; arginine biosynthesis; and glycerophospholipid and sphingolipid metabolism. The study demonstrated that pharmacometabolomics can identify pathway-level metabolic signatures of drug action in human subjects, providing insights into both on-target (NQO1/Nrf2 activation) and broader metabolic effects.

Conclusions

This case study exemplifies how LC-MS-based metabolomics with pathway enrichment analysis can reveal the metabolic mechanisms of drug action in humans, directly demonstrating the value of metabolic pathway drug-response mapping for translational pharmacology.

Schematic representation of the pharmacometabolomics workflow used for drug-induced metabolic pathway analysis in the β-lapachone derivative first-in-human study.

Pharmacometabolomics workflow for drug-induced metabolic pathway analysis. Adapted from Jang et al. (2025), CC BY 4.0.

Sample Requirements

Sample TypeRecommended AmountPreparationStorage & Shipping
Cell lysates≥1 × 10⁷ cells per conditionQuench with cold MeOH; scrape and collect-80 °C storage; dry ice shipping
Tissue samples≥20 mg (wet weight) per conditionSnap-freeze in liquid N₂; homogenize in extraction solvent-80 °C storage; dry ice shipping
Biofluids≥50 µL per replicateCentrifuge at 13,000 g, 4 °C, 10 min; collect supernatant-80 °C storage; dry ice shipping
Conditioned media≥200 µL per replicateCentrifuge to remove cell debris; add internal standards-80 °C storage; dry ice shipping
Replicates≥5 biological replicates per group (recommended)Randomized block designN/A
Turnaround4–6 weeks (standard project)Depending on study size and sample complexityN/A
FAQ

Frequently Asked Questions

Q: What is metabolic pathway drug-response mapping and how is it different from standard metabolomics?

Standard metabolomics identifies and quantifies metabolites in a biological sample. Metabolic pathway drug-response mapping goes further by specifically focusing on how drug treatment alters metabolic pathways — it incorporates drug-response experimental design (dose-response, time-course), applies pathway enrichment analysis, and delivers biologically interpretable pathway-level conclusions rather than just a list of changed metabolites.

Q: What type of experimental design do you recommend for drug MoA studies?

For initial MoA characterization, we recommend a dose-response design (3 doses) at a single optimized time point. For comprehensive characterization, a full factorial design (3 doses × 3 time points) provides the most complete picture. We will consult with your team to select the optimal design based on your specific compound and research question.

Q: How many metabolites can you detect and identify?

In a typical untargeted metabolomics experiment, we detect 3,000–8,000 metabolic features, of which 300–800 are confidently identified at MSI level 1 or 2 (authentic standard match or MS/MS library match). Coverage includes amino acids, central carbon metabolites, nucleotides, polar lipids, and signaling molecules.

Q: What pathway databases do you use for interpretation?

We use KEGG (Kyoto Encyclopedia of Genes and Genomes) as the primary pathway database for enrichment analysis, supplemented by HMDB (Human Metabolome Database) for metabolite annotation and WikiPathways for complementary pathway coverage. Pathway impact analysis is performed using MetaboAnalyst-integrated algorithms.

Q: What is the minimum number of replicates needed for statistical power?

We recommend a minimum of 5 biological replicates per experimental group for untargeted metabolomics studies. Fewer replicates (3–4) may be acceptable for pilot or exploratory studies, but statistical power will be reduced. Technical replicates are not required as we use pooled QC samples for technical variation assessment.

Q: Can you integrate metabolomics data with proteomics or lipidomics?

Yes. Our MassTarget™ platform includes complementary cellular metabolomics screening, cellular lipidomics profiling, and proteomics services. We offer integrated multi-omics pathway analysis that combines data from multiple omics layers for a systems-level understanding of drug effects.

Q: How do you ensure data quality and reproducibility?

We implement multiple QC measures: pooled QC samples injected every 10–15 study samples for signal drift correction, isotope-labeled internal standards in every sample for normalization, blank extraction controls for contamination monitoring, randomized sample injection order, and batch correction using QC-based algorithms. Typical CV for pooled QC samples is <20% for the majority of detected metabolites.

Q: What sample types can you process?

We accept cell lysates (adherent and suspension), tissue samples (snap-frozen), biofluids (plasma, serum, CSF, urine), conditioned media, and microbial cultures. For specialized sample types (e.g., organoid lysates, exosomes, biopsy samples), please contact us to discuss feasibility and minimum sample requirements.

Q: How long does a typical project take?

Standard projects are completed within 4–6 weeks from sample receipt, including LC-MS acquisition, data processing, metabolite identification, pathway analysis, and report generation. Expedited timelines (2–3 weeks) are available for smaller studies or urgent projects.

Q: Can you detect both polar and lipid metabolites in the same run?

For comprehensive coverage, we typically use two complementary LC-MS methods: HILIC-MS for polar metabolites (amino acids, central carbon metabolites, nucleotides) and RP-MS for lipid species. Alternatively, we offer a single-run approach with broad coverage if sample quantity is limited.

References

  1. Jang Y, Kang J, et al.Pharmacometabolomics uncovers key metabolic changes in the first-in-human study of β-lapachone derivative. Metabolomics 21:122 (2025).
  2. Wishart DS, et al.HMDB 5.0: the Human Metabolome Database for comprehensive metabolomics research. Nucleic Acids Res. 2022;50(D1):D622-D631.
  3. Pang Z, et al.MetaboAnalyst 6.0: towards a unified platform for metabolomics data processing, analysis and interpretation. Nucleic Acids Res. 2024;52(W1):W398-W406.
  4. Kanehisa M, et al.KEGG: integrating viruses and cellular organisms. Nucleic Acids Res. 2021;49(D1):D545-D551.

Plan a Drug-Response Pathway Mapping Study with the MassTarget™ Team

Share your compound and study goals — our scientists will design a tailored metabolic pathway drug-response mapping strategy for your drug discovery program.

Online Inquiry

Please submit a detailed description of your project. We will provide you with a customized project plan to meet your research requests. You can also send emails directly to for inquiries.

* Email
Phone
* Service & Products of Interest
Services Required and Project Description