Cell-Based MS Drug Screening
Label-free, direct measurement of drug effects in living cells — metabolomics, drug uptake, single-cell profiling, organoid models, and resistance mechanism analysis from a single service platform.
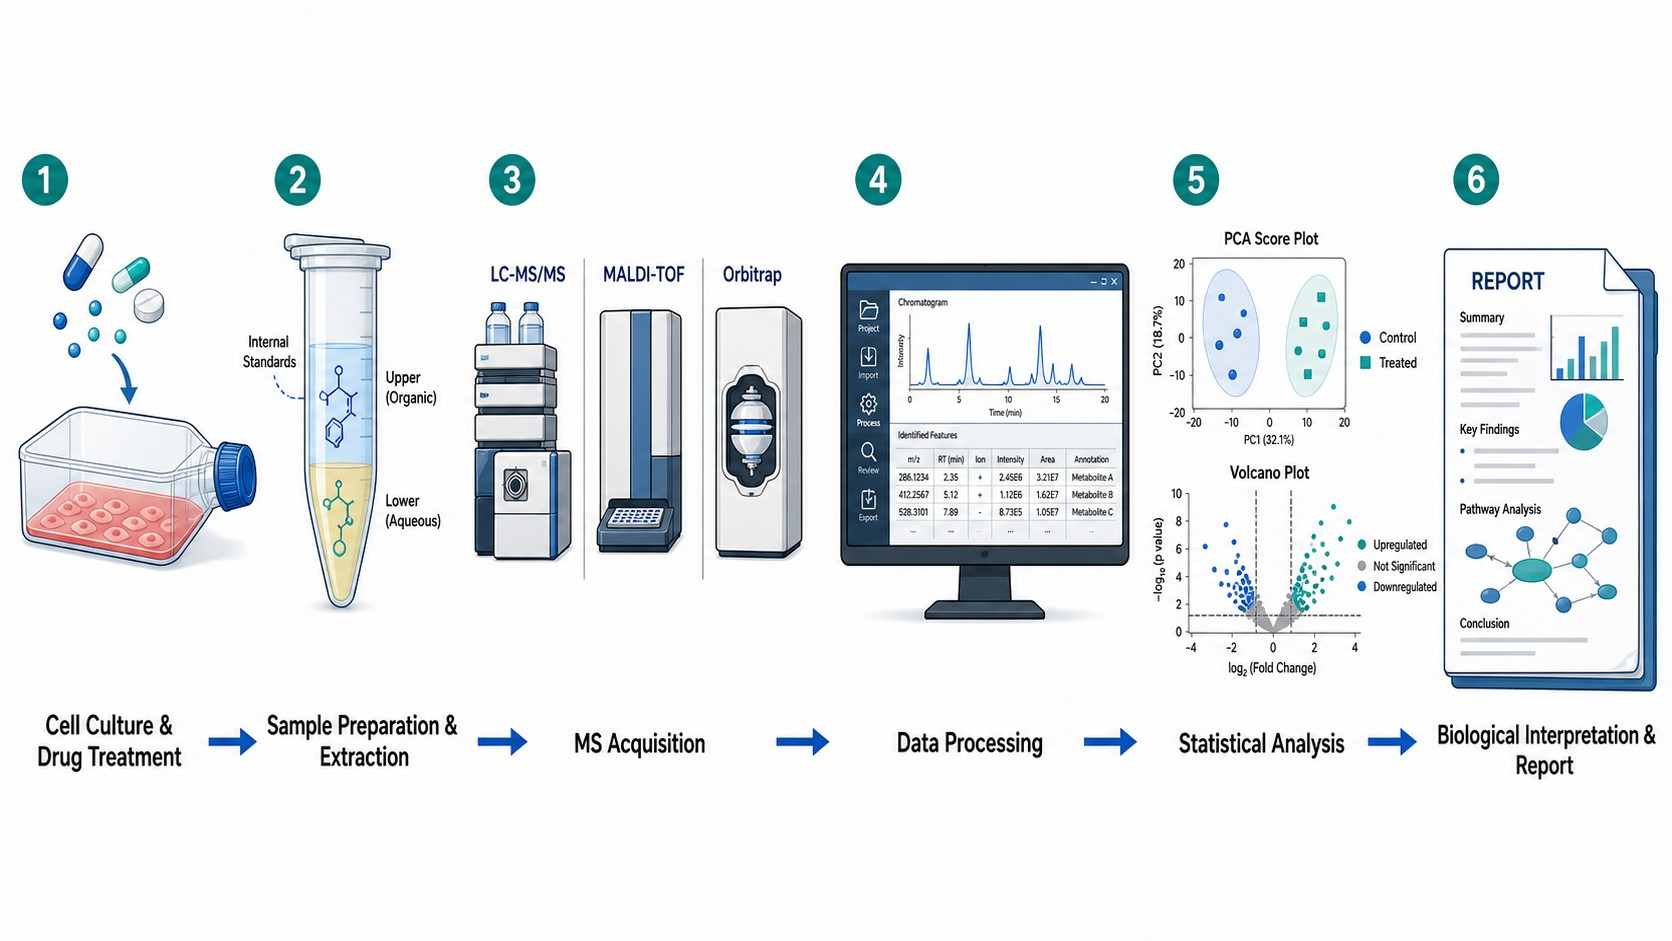
Cell-based mass spectrometry (MS) drug screening is a label-free analytical approach that directly measures drug effects in living cellular systems, providing physiologically relevant pharmacology data that bridges in vitro biochemistry and in vivo efficacy. Unlike conventional biochemical assays that use purified targets in artificial buffer systems, cell-based MS captures the full biological context of drug action — including cell permeability, intracellular metabolism, target engagement, and downstream pathway modulation — from a single experimental workflow.
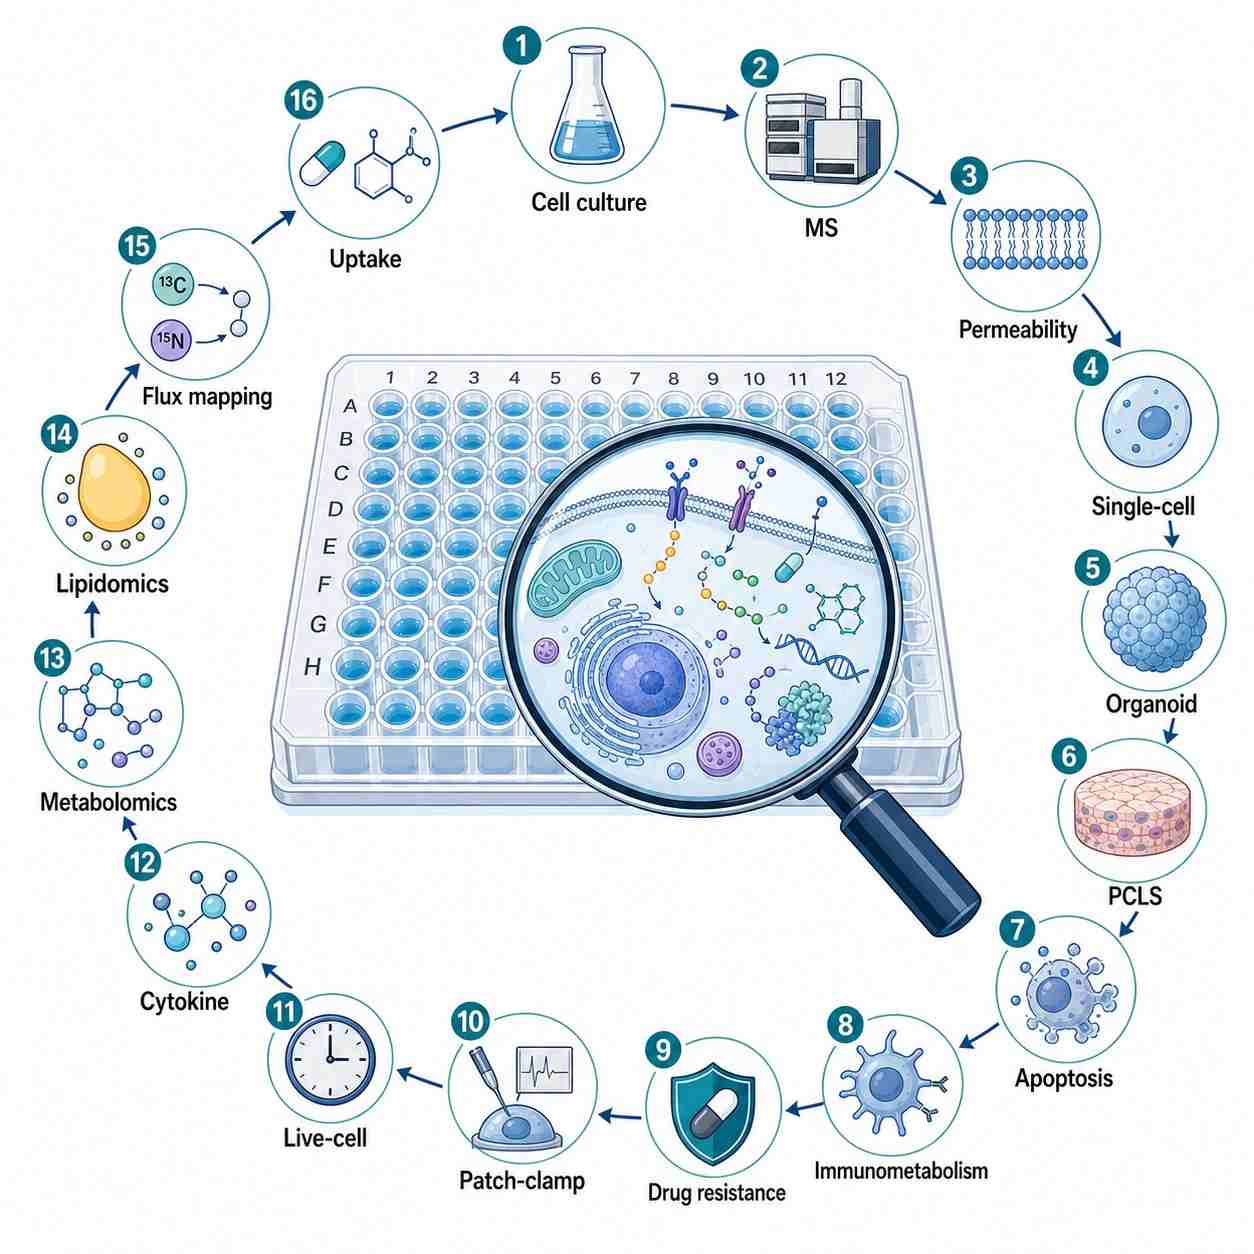
Our platform integrates 16 specialized service modules covering the entire spectrum of cellular pharmacology: cellular metabolomics and lipidomics screening, drug uptake and retention measurement, intracellular accumulation quantification, metabolic pathway drug-response mapping, organoid and precision-cut tissue slice (PCLS) MS analysis, single-cell drug profiling, patch-clamp MS coupling, apoptosis and cell death pathway MS signatures, immunometabolism profiling, cytokine quantification, drug-resistance mechanism elucidation, and live-cell MS analysis.
Key capabilities of our cell-based MS drug screening platform:
- 16 specialized service modules covering the full cellular pharmacology spectrum
- Label-free detection — no fluorescent tags, antibodies, or radioactive isotopes required
- Simultaneous drug quantitation + metabolomic/lipidomic response from a single sample
- Support for cell lines, primary cells, 3D spheroids, organoids, and tissue slices
- Validated protocols for over 50 cell types with full method development support
- From early hit profiling through lead optimization and mechanism-of-action studies