PROTAC Complex Profiling Service — From Ternary Complex Confirmation to Degradation Selectivity

Your PROTAC was designed to bring a target and an E3 ligase together. The critical question — did it work, and what happened next?

PROTACs (proteolysis-targeting chimeras) are bifunctional molecules that simultaneously engage a protein of interest (POI) and an E3 ubiquitin ligase, forming a ternary complex that triggers ubiquitination and subsequent proteasomal degradation of the target. The two central questions in every PROTAC programme are: does the ternary complex form, and what are the proteome-wide consequences of degradation? Mass spectrometry is uniquely positioned to answer both, providing direct molecular evidence at every step — from complex formation to degradation outcome.

At Creative Proteomics MassTarget, we deploy an integrated MS-based PROTAC complex profiling platform combining native MS, affinity purification-MS (AP-MS) interactomics, ubiquitinomics, and quantitative proteomics to characterize ternary complex formation, confirm degradation mechanism, and assess proteome-wide selectivity. Our service is purpose-built for targeted protein degradation (TPD) teams who need to understand not just whether their degrader works, but precisely how it engages the target-E3 system. For dedicated native MS characterization of small-molecule:protein complexes, our small-molecule/protein complex native MS service provides the direct detection platform for intact ternary complexes under non-denaturing conditions.

Key Advantages:

  • Multi-platform PROTAC characterization — native MS + AP-MS + ubiquitinomics + quantitative proteomics under one project.
  • Direct detection of intact ternary POI-PROTAC-E3 complexes by native MS — no labels, no probes, no immobilization.
  • Proteome-wide degradation selectivity profiling to identify off-target degradation liabilities before candidate advancement.
  • Ubiquitination site mapping to confirm on-mechanism degradation via the ubiquitin-proteasome pathway.
  • Low compound consumption: sub-µM PROTAC concentrations sufficient for ternary complex detection by native MS.
  • Turnaround: 3–6 weeks depending on platform scope.
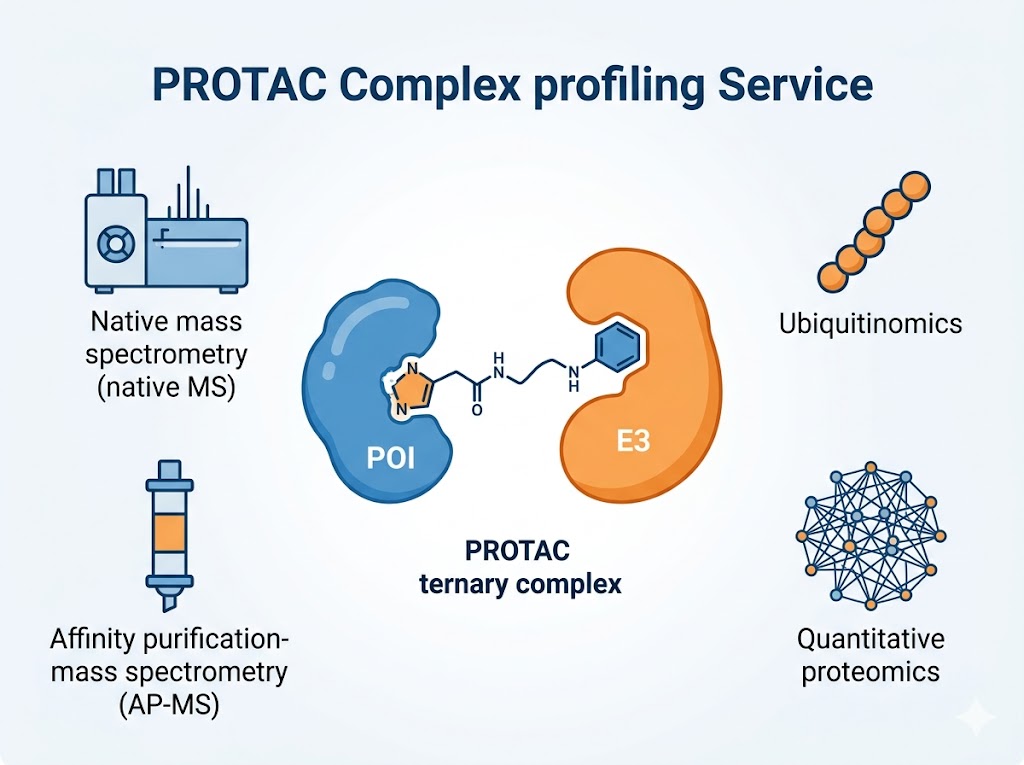
PROTAC complex profiling service overview: PROTAC bifunctional molecule bridging target protein (POI) and E3 ubiquitin ligase to form a ternary complex, analysed by native MS, AP-MS interactomics, ubiquitinomics, and quantitative proteomics for comprehensive degrader characterization.
What Is PROTAC Profiling Platform Suite Tech Comparison Sample Demo Case Study FAQ

What Is PROTAC Complex Profiling?

PROTAC complex profiling is the systematic MS-based characterization of the molecular cascade triggered by a PROTAC compound: ternary complex assembly between the POI, PROTAC, and E3 ligase; PROTAC-induced ubiquitination of the target; the proteome-wide landscape of protein degradation; and the downstream cellular consequences. Unlike conventional binary binding measurements that evaluate one interaction at a time, MS-based profiling covers the entire sequence from complex formation to functional cellular outcome within an integrated analytical framework.

The defining analytical challenge in PROTAC drug discovery is that ternary complex formation does not automatically follow from binary binding affinity. A PROTAC that binds both POI and E3 ligase with high affinity may fail to adopt the geometry required for productive ubiquitination — or may form higher-order complexes that consume components without degrading the intended target. Native MS resolves this uncertainty by measuring the intact ternary complex mass directly, providing unambiguous evidence of which molecular species form and in what stoichiometry.

Beyond complex formation, PROTAC development demands a system-level view of degradation consequences. A selective degrader should eliminate only the intended target. Unintended off-target degradation produces unpredictable pharmacology and is among the most common safety liabilities in degrader programmes. Quantitative proteomics across the entire expressed proteome provides the unbiased selectivity fingerprint that Western blotting and targeted proteomic assays cannot deliver, enabling informed candidate selection before the investment into in vivo studies.

Our integrated PROTAC complex profiling platform addresses the full characterization pipeline: ternary complex detection and stoichiometry by native MS, cellular engagement validation by AP-MS, mechanism confirmation by ubiquitinomics, and selectivity assessment by deep quantitative proteomics — with each platform providing a distinct and orthogonal layer of evidence.

Why MS-Based Profiling Is the Analytical Backbone of PROTAC Development

Resolves ternary complex stoichiometry directly from mass

Binary binding assays — SPR, ITC, AlphaLISA — report that binding occurred but cannot determine how many molecules of each component are present in the complex. Native MS measures the intact assembly mass, resolving free POI, free E3, binary complexes, and the full 1:1:1 ternary complex simultaneously in a single spectrum — without labelling, immobilization, or antibody reagents that could alter the binding equilibrium.

Measures cooperativity without fluorescent tags

Cooperativity — whether PROTAC binding to one protein enhances or suppresses binding to the other — is a critical parameter determining degradation efficiency at sub-saturating concentrations. Native MS measures cooperativity directly from the relative abundance of ternary versus binary species across a PROTAC concentration gradient, with no requirement for fluorescent tags, affinity handles, or surface immobilization.

Profiles degradation selectivity across thousands of proteins

Unbiased proteome-wide selectivity assessment is the single most important safety readout for PROTAC candidates. Quantitative DIA or TMT proteomics across treated and vehicle control cells quantifies abundance changes for 5,000–8,000 proteins, identifying every protein depleted by the degrader — intended or not. This selectivity fingerprint is simply unobtainable by antibody-based methods. Our cell-based MS drug screening platform supports cellular degradation studies across multiple cell lines and treatment conditions for selectivity interpretation.

Confirms degradation mechanism through ubiquitination evidence

A decrease in target protein abundance is consistent with PROTAC-mediated degradation — but could theoretically result from transcriptional suppression, translational inhibition, or secretion. Ubiquitinomics (K-ε-GG peptide enrichment followed by LC-MS/MS) provides direct evidence that ubiquitin was conjugated to the target prior to degradation, confirming the intended mechanism of action. Our ubiquitinomics for PROTAC evaluation service identifies ubiquitination sites across the target protein and quantifies their PROTAC-dependent regulation.

Captures cellular context beyond purified systems

Ternary complex behaviour in buffer may not reflect the cellular environment — where competing endogenous proteins, post-translational modifications, and subcellular compartmentalization influence complex formation and stability. AP-MS from live-treated cells captures the PROTAC-recruited E3 ligase in the native cellular proteome, providing engagement data with full biological context. For downstream phenotypic readouts, our MS-based apoptosis markers service adds functional cell death pathway confirmation for degrader programmes targeting oncogenic drivers.

Delivers integrated data packages for candidate advancement

An integrated PROTAC characterization report — combining native MS ternary complex evidence, AP-MS cellular engagement, ubiquitination confirmation, and proteome-wide selectivity data — provides the comprehensive evidence package required for lead candidate selection, patent claims supporting degrader mechanism, and preclinical documentation. Each data layer can be presented independently or within the integrated narrative.

Our PROTAC Complex Profiling Platform Suite

We deploy four primary MS platforms for PROTAC ternary complex characterization, each producing a distinct layer of evidence about the degrader's mechanism and selectivity. Platform selection is matched to the development stage — from early ternary complex confirmation through lead optimization selectivity profiling. Our scientists recommend the optimal combination during project design.

PLATFORM 1

Native MS — Direct Ternary Complex Detection

Native electrospray ionization mass spectrometry under non-denaturing conditions preserves non-covalent protein-protein and protein-ligand interactions in the gas phase, enabling direct detection of intact ternary POI-PROTAC-E3 complexes. The PROTAC is incubated with purified POI and E3 ligase at defined concentrations; the equilibrated mixture is introduced directly into the mass spectrometer via nano-ESI. The resulting mass spectrum resolves every species present — free POI, free E3, binary complexes, and the ternary complex — by their intact molecular masses.

  • MoA metric: ternary complex mass and stoichiometry; relative abundance of binary vs ternary species
  • Detects: intact POI-PROTAC-E3 ternary complex; binary intermediates; free unbound components
  • Sample: purified POI and E3 ligase (µM concentrations in volatile buffer); PROTAC at 0.1–10 µM
  • Data output: deconvoluted mass spectrum with species assignment; cooperativity factor (α) from ternary/binary ratio across a concentration series; CID dissociation profiles for complex stability assessment
  • Best for: unambiguous ternary complex confirmation, stoichiometry assignment, cooperativity measurement, PROTAC library rank-ordering by complex stability
  • Our small-molecule/protein complex native MS service provides the dedicated platform for intact complex detection under native conditions
PLATFORM 2

AP-MS Interactomics — Ternary Complex Mapping in Cells

Affinity purification-mass spectrometry captures the POI and its PROTAC-recruited interaction partners from cellular lysates. A tagged POI (FLAG, GFP, or streptavidin-binding protein) is expressed in cells, treated with PROTAC or vehicle, affinity-purified, and co-purifying proteins are identified and quantified by LC-MS/MS. The PROTAC-dependent appearance of the E3 ligase in the purified complex confirms ternary complex formation with full cellular context — including the influence of endogenous binding partners and post-translational modifications.

  • MoA metric: PROTAC-dependent E3 ligase enrichment ratio in POI purification (TMT or spectral count)
  • Detects: E3 ligase co-purification with POI; PROTAC-recruited additional interactors; competition from endogenous binding partners
  • Sample: tagged POI-expressing cell lines (HEK293T, HCT116, or customer-provided); PROTAC at 0.1–10 µM; 2 × 10⁷ cells per condition
  • Data output: protein interaction list with quantitative TMT ratios across PROTAC concentration series; dose-response enrichment curve for E3 ligase recruitment; interaction network comparison vs vehicle control
  • Best for: ternary complex confirmation in the cellular environment; optimal PROTAC concentration determination; E3 ligase recruitment validation with endogenous competition
  • Our interactomics (AP-MS / proximity) service provides the AP-MS workflow, bait optimization, and downstream data analysis for PROTAC interaction studies
PLATFORM 3

Ubiquitinomics — Degradation Signature Confirmation

To confirm that target degradation proceeds through the intended ubiquitin-proteasome pathway, ubiquitinated peptides are enriched from PROTAC-treated versus control cells using an anti-K-ε-GG antibody (diglycine remnant) following tryptic digestion. LC-MS/MS quantifies the ubiquitination status of every lysine residue on the target protein, providing direct evidence that PROTAC treatment induced site-specific ubiquitination — the essential mechanistic step preceding proteasomal degradation.

  • MoA metric: ubiquitination site occupancy on target protein; fold-change in site-specific ubiquitination upon PROTAC treatment vs vehicle
  • Detects: ubiquitin-modified lysine residues on POI with site localization; global ubiquitinome changes across the proteome
  • Sample: PROTAC-treated cells (2 × 10⁷ per condition); 3–5 mg total protein input for K-ε-GG enrichment
  • Data output: ubiquitinated peptide list with site localization probability scores; site-level fold-change quantification across treatment conditions; comparison of ubiquitination efficiency across PROTAC concentrations and time points
  • Best for: degradation mechanism confirmation; ubiquitination site mapping for structure-based design; PROTAC vs molecular glue mechanism differentiation
PLATFORM 4

Quantitative Proteomics — Degradation Selectivity Profiling

Proteome-wide selectivity is the most critical safety assessment for any PROTAC candidate advancing towards preclinical development. Quantitative proteomics (DIA or TMT) compares the global proteome of PROTAC-treated versus vehicle-treated cells across biological triplicates, quantifying thousands of proteins. Proteins that decrease significantly in abundance upon PROTAC treatment represent degradation targets — intended and unintended — providing an unbiased selectivity fingerprint for each candidate.

  • MoA metric: protein abundance fold-change per PROTAC concentration; statistical significance (FDR-adjusted p-value per protein)
  • Detects: degraded target protein (intended); off-target degraded proteins (unintended); compensatory abundance changes in response to target loss
  • Coverage: 5,000–8,000 quantified proteins per experiment
  • Data output: proteome-wide quantification table with fold-changes and significance values; ranked degradation selectivity list; multi-condition comparison across PROTAC series for SAR guidance
  • Best for: selectivity assessment at lead optimization stage; off-target degradation liability identification; candidate comparison and ranking

For PROTAC library screening at earlier stages — where binary binding is assessed across larger panels before ternary complex characterization — our automated compound-target binding HT-MS screening service provides the higher-throughput binary binding assessment compatible with focused PROTAC library rank-ordering.

Integrated PROTAC Complex Profiling Workflow

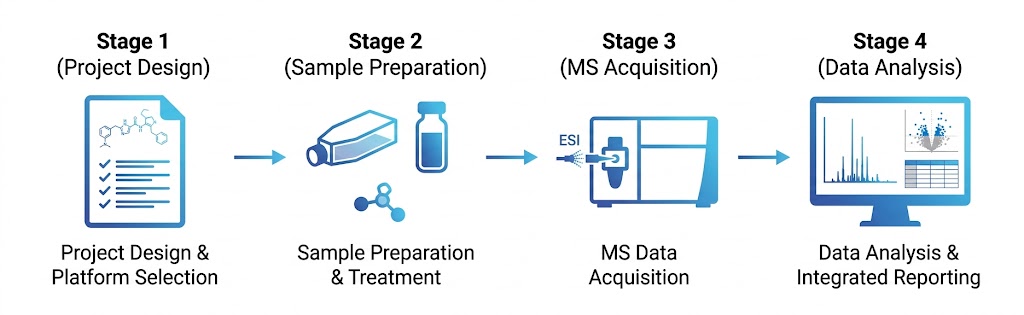
Four stages from compound receipt to comprehensive PROTAC characterization report:

1

Project design and platform selection

PROTAC properties (molecular weight, linker composition, E3 warhead identity), known POI and E3 ligase characteristics, and the programme stage are assessed. The optimal platform combination is selected — early-stage programmes begin with native MS for ternary complex confirmation; later-stage programmes add ubiquitinomics and proteome-wide selectivity profiling. Reference degraders (e.g., MZ1 for VHL-recruiting PROTACs) are selected as positive controls. The project plan, concentration ranges, controls, and acceptance criteria are defined in approximately one week.

2

Sample preparation and treatment

For native MS: purified POI and E3 ligase proteins are buffer-exchanged into 50–200 mM ammonium acetate (pH 7.0–7.5) at defined concentrations. PROTAC is added across an 8-point concentration series (0.01–100 µM) and incubated to equilibrium. For cellular platforms: POI-expressing cell lines are treated with PROTAC at specified concentrations and time points (4–24 h depending on known degradation kinetics). DMSO vehicle control and a reference degrader positive control are included in every experiment. Triplicate biological replicates are prepared for all quantitative comparisons.

3

MS data acquisition

Native MS: nano-ESI on high-resolution Q-TOF or Orbitrap instruments with source parameters optimized for non-covalent complex transmission — low collision energy, elevated backing pressure, gentle desolvation conditions. AP-MS: GFP-Trap or streptavidin pull-down from cellular lysates followed by LC-MS/MS with TMT labelling for quantitative accuracy. Ubiquitinomics: tryptic digestion, K-ε-GG antibody enrichment, single-shot or fractionated LC-MS/MS. Proteomics: DIA acquisition on Orbitrap Exploris 480 with 4–6 m/z windows or TMT acquisition with multi-notch MS3 for accurate quantification.

4

Data analysis and integrated reporting

Native MS spectra are deconvoluted (MaxEnt or UniDec) and species assigned by mass matching to known component masses. AP-MS data are processed for protein identification and TMT quantification. Ubiquitinomics data are searched for K-ε-GG modifications with site localization scoring (class I sites, probability > 0.75). Proteomics data are processed for protein abundance quantification with statistical testing (Limma or t-test with FDR correction). The integrated PROTAC characterization report synthesizes findings across all deployed platforms into a unified mechanistic narrative with supporting data tables and visualizations for each evidence layer.

PROTAC complex profiling workflow: project design and platform selection, sample preparation with PROTAC treatment across concentration series, MS data acquisition across native MS/AP-MS/ubiquitinomics/proteomics platforms, and integrated data analysis with species assignment and statistical testing.

Applications Across the PROTAC Discovery Pipeline

MS-based PROTAC complex profiling is most impactful where understanding the molecular details of ternary complex formation and degradation selectivity determines programme direction and investment decisions.

Ternary Complex Formation Confirmation

A PROTAC that binds both POI and E3 in isolation may fail to form a productive ternary complex due to steric incompatibility, linker geometry constraints, or unfavourable binding site orientation. Native MS provides the definitive answer by detecting the intact POI-PROTAC-E3 complex mass — confirming all three components are simultaneously engaged with the correct 1:1:1 stoichiometry.

Output: Native mass spectrum with assigned species; ternary complex stoichiometry confirmation; cooperativity factor (α) calculation across the PROTAC concentration range.

Linker and Warhead Optimization Screening

PROTAC medicinal chemistry systematically varies linker length, composition, and E3 warhead identity. Native MS across a PROTAC panel (10–50 compounds) identifies which linker geometry and warhead combination produces the most abundant and stable ternary complex — directly guiding synthetic prioritization without requiring cellular assays for each variant.

Output: Ternary complex abundance ranking across PROTAC series; structure-complex stability relationships; prioritized PROTAC candidates for cellular validation.

Proteome-Wide Selectivity for Lead Candidate Selection

Before committing to a PROTAC lead candidate, unbiased proteome-wide selectivity data is essential. Quantitative proteomics identifies all proteins depleted upon PROTAC treatment, distinguishing on-target degradation from off-target liabilities. This is particularly critical for PROTACs targeting kinase families or epigenetic readers where closely related paralogues may be inadvertently degraded.

Output: Proteome-wide degradation selectivity profile; ranked off-target list with quantitative fold-changes; selectivity comparison across competing lead candidates.

E3 Ligase Recruitment Validation in Cells

Ternary complex formation demonstrated in purified systems requires cellular confirmation — the E3 ligase must be recruited to the POI in living cells, where the target exists within its native interaction network and competing endogenous proteins are present. AP-MS from PROTAC-treated cells provides this confirmation by quantifying PROTAC-dependent E3 ligase enrichment in POI pull-downs.

Output: PROTAC-dependent E3 ligase enrichment; dose-response recruitment curve with hook effect characterization; optimal concentration recommendation for maximal degradation.

Ubiquitination Site Mapping for Mechanism Confirmation

PROTAC-mediated ubiquitination can target multiple lysine residues with different efficiencies and degradation outcomes. Ubiquitinomics identifies which sites are modified, enabling structure-based optimization of degrader-POI geometry to position the POI surface for optimal ubiquitination by the recruited E3 ligase.

Output: Ubiquitinated lysine map on POI with site-level quantification; correlation between specific ubiquitination events and degradation efficiency; PROTAC concentration-ubiquitination relationship.

Downstream Cell Death Confirmation for Oncology Programmes

For PROTACs targeting oncogenic drivers, confirmation that target degradation translates to functional cell death is a critical translatability checkpoint. MS-based apoptosis markers and cell death pathway signatures provide the downstream phenotypic readout connecting degradation to biological effect, supporting candidate advancement decisions.

Output: Apoptosis marker activation profile; cell death pathway signature; quantitative correlation between degradation extent and functional cellular response.

Technology Comparison: MS-Based PROTAC Profiling vs Alternative Approaches

ApproachDetection PrincipleTernary Complex StoichiometryCooperativityProteome CoverageLabel-FreeCellular Context
MS-Based PROTAC Profiling (this service)Direct — intact ternary complex mass by native MSYes — from intact complex massYes — from ternary/binary species ratio5,000–8,000 proteinsYesAP-MS and cellular platforms
Surface Plasmon Resonance (SPR)Refractive index change upon bindingNo — cannot resolve complex compositionMulti-cycle fitting requiredSingle interactionYesPurified only
Isothermal Titration Calorimetry (ITC)Heat change upon bindingNo — thermodynamic data aloneComplex multi-site fittingSingle interactionYesPurified only
AlphaLISA / AlphaScreenProximity-mediated luminescenceNo — proximity signal cannot resolve stoichiometryLimited — indirect inferenceSingle interactionRequires antibody reagentsLysate or purified
Western Blot (degradation readout)Antibody signal intensityNoNo1–3 proteins per blotRequires specific antibodyYes
Cryo-Electron Microscopy3D reconstruction from particle imagesYes from 3D densityNo — static structural dataSingle complexYesPurified only

Sample Requirements

ComponentFormat OptionsRecommended InputMinimum InputKey Notes
PROTAC compoundPowder or DMSO stock5–10 mg (or 10 mM stock, 50 µL)1 mg (or 5 mM stock, 20 µL)Provide MW, purity, known E3 ligase recruited; note any light/oxygen sensitivity; DMSO stocks preferred for cellular assays
Target protein (POI) — native MSPurified in MS-compatible volatile buffer50–200 µg at 5–20 µM10 µg at 2 µMProvide sequence, MW, oligomeric state; avoid glycerol >5%; ammonium acetate buffer (50–200 mM, pH 7.0–7.5) preferred; buffer exchange available
E3 ligase complex — native MSPurified in MS-compatible volatile buffer50–200 µg at 5–20 µM10 µg at 2 µMProvide known activity status; note if reconstituted from multiple subunits (e.g., VHL-ElonginB-ElonginC); confirm active complex formation
Cell line — cellular platformsAdherent or suspension; frozen pellet2 × 107 cells per condition5 × 106 cells per conditionConfirm POI and E3 expression levels; provide cell type, passage number, and culture conditions
Tagged POI cell line — AP-MSStable or transient expression; frozen pellet2 × 107 cells per condition1 × 107 cells per conditionProvide tag identity (FLAG, GFP, Strep); transient transfection protocols available if stable line is unavailable
Reference degrader (positive control)10 mM DMSO stock≥ 30 µL10 µLKnown degrader (e.g., MZ1 for VHL-recruiting, dBET1 for CRBN-recruiting) recommended; provide known DC50 if available

All samples should be shipped on dry ice with completed sample submission forms. Biological triplicates are recommended for all quantitative comparisons; minimum two independent biological replicates for publication-grade selectivity data. For native MS workflows, purified proteins should be provided in MS-compatible volatile buffer — our team can perform buffer exchange if needed.

Deliverables

  • Native MS report: deconvoluted mass spectra with assigned species (free POI, free E3, binary complexes, ternary complex); cooperativity factor (α) calculated from ternary/binary species ratios across the concentration series; CID dissociation profiles for complex stability assessment
  • AP-MS interactomics data: full protein identification list with TMT ratios; PROTAC-dependent E3 ligase enrichment curve; interaction network visualization comparing PROTAC-treated vs vehicle control
  • Ubiquitinomics data: K-ε-GG modified peptide list with site localization scores (class I sites, probability > 0.75); site-level fold-change quantification; PROTAC concentration-ubiquitination relationship
  • Quantitative proteomics data: proteome-wide abundance table with protein-level fold-changes and FDR-adjusted p-values; ranked selectivity list showing intended target position relative to all other quantified proteins; multi-PROTAC comparison table where applicable
  • Raw MS data: full .raw or .mzML files for independent re-analysis or regulatory submission
  • Processed quantification tables for each platform with all statistical metrics
  • QC report: protein coverage depth, CV distribution across replicates, replicate correlation heatmap, platform-specific quality metrics
  • Written interpretation report: integrated PROTAC characterization narrative summarizing ternary complex findings, degradation selectivity assessment, ubiquitination confirmation, and recommended follow-up experiments

Representative Results

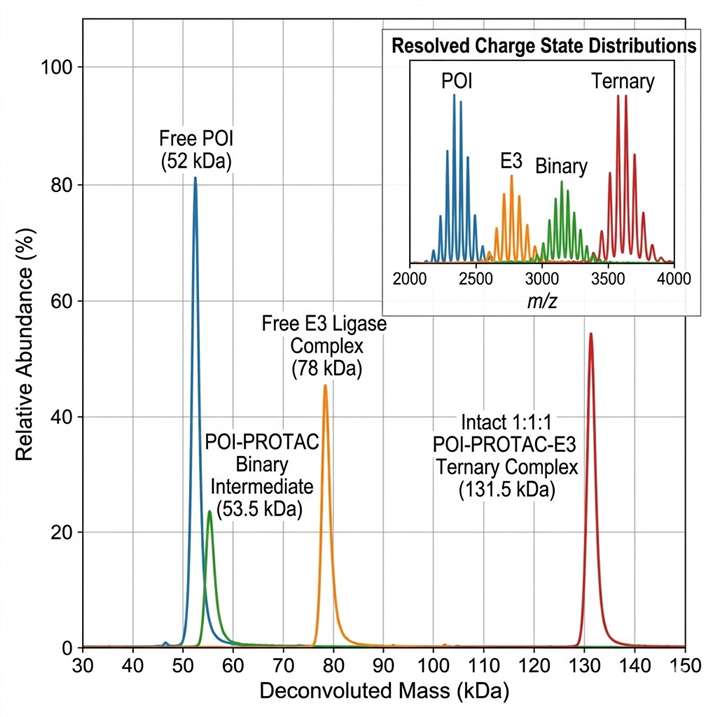
Native mass spectrometry spectrum showing intact ternary POI-PROTAC-E3 complex formation with deconvoluted masses for free POI at 52 kDa, free E3 ligase complex at 78 kDa, POI-PROTAC binary complex at 53.5 kDa, and intact ternary complex at 131.5 kDa.

Native MS spectrum: direct detection of intact ternary complex formation

Native ESI-MS analysis of a PROTAC-mediated ternary complex between a target POI (52 kDa), VHL-ElonginB-ElonginC E3 ligase complex (78 kDa), and the PROTAC compound (1.5 kDa). The deconvoluted mass spectrum resolves four species: free POI, free E3 complex, POI-PROTAC binary intermediate, and the intact 1:1:1 POI-PROTAC-E3 ternary complex at 131.5 kDa. The presence of both binary and ternary species in equilibrium enables cooperativity calculation. Triplicate measurements at each PROTAC concentration; the ternary complex is detectable at PROTAC concentrations as low as 250 nM.

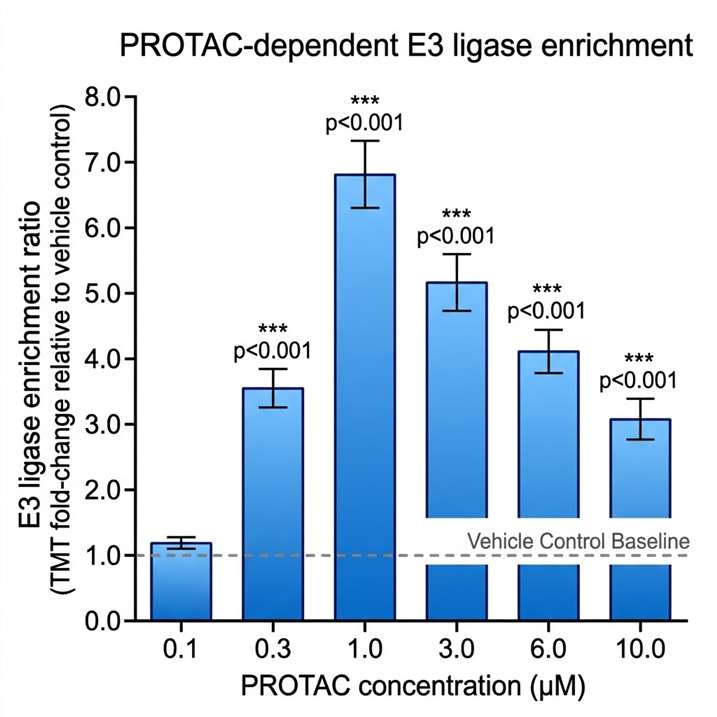
AP-MS dose-response bar chart showing PROTAC-dependent VHL E3 ligase enrichment in POI pull-down across a 6-concentration PROTAC series from 0.1 to 10 µM, with maximal enrichment at 1 µM and hook effect at 10 µM.

AP-MS E3 recruitment: PROTAC-dependent ternary complex formation in cells

AP-MS quantification of VHL E3 ligase co-purification with GFP-tagged BRD4 across a 6-concentration PROTAC MZ1 series (0.1–10 µM, 6 h treatment) in HEK293T cells. TMT ratios reveal concentration-dependent E3 recruitment: VHL enrichment increases from 1.2-fold at 0.1 µM to 6.8-fold at the optimal concentration of 1 µM. At 10 µM, VHL enrichment decreases to 3.1-fold — the characteristic hook effect observed at supra-optimal PROTAC concentrations.

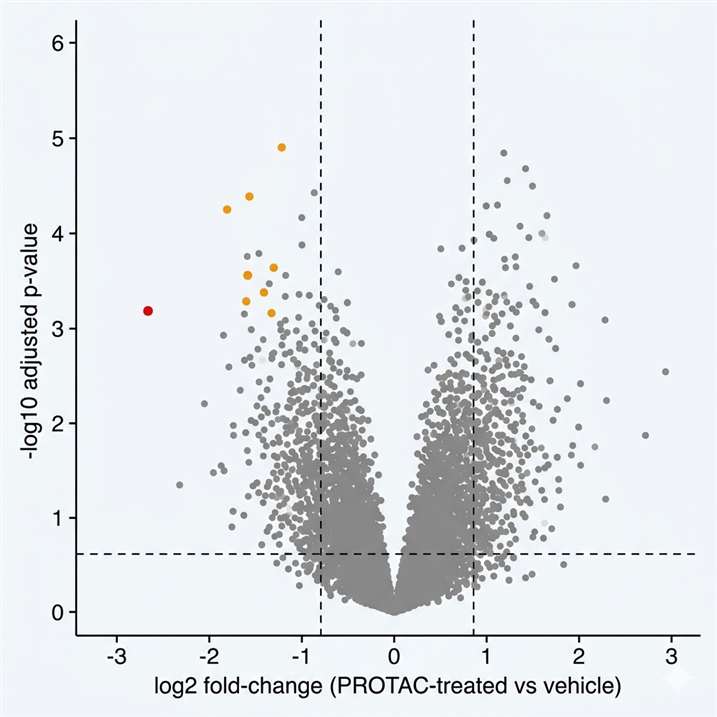
Volcano plot from quantitative proteomics of PROTAC-treated vs vehicle-treated cells showing log2 fold-change on x-axis versus -log10 p-value on y-axis, with intended degraded target in red and off-target depleted proteins in orange across approximately 6,500 quantified proteins.

Proteome-wide selectivity profiling: degradation fingerprint of a PROTAC candidate

Quantitative DIA proteomics comparison of PROTAC-treated (1 µM, 24 h) versus vehicle-treated HCT116 cells. Approximately 6,500 proteins were quantified across biological triplicates. The intended target (red) shows the largest abundance decrease (log2 fold-change −2.8, p < 0.001). Three off-target proteins (orange) show significant depletion (log2 fold-change < −1.5, FDR < 0.05) — representing potential off-target degradation liabilities. The remaining 6,496 proteins (grey) are unchanged. This unbiased selectivity fingerprint enables data-driven candidate comparison and risk assessment before preclinical advancement.

Case Study: ProtacID — Proximity Labeling MS Characterizes PROTAC Specificity and Endogenous Protein Interactomes in Living Cells

Nat Commun. 2025;16:8089. https://doi.org/10.1038/s41467-025-63357-7 (Open Access).

Background

A fundamental challenge in PROTAC development is determining not just whether a ternary complex can form in a purified system, but whether the PROTAC productively engages its intended target and E3 ligase within the complex cellular environment — where the POI exists at endogenous expression levels, within its native interaction network, and subject to cellular regulation. Traditional AP-MS approaches require overexpressed tagged proteins that may not reflect endogenous stoichiometry, and antibody-based methods depend on the availability of high-quality reagents for each target.

Methods

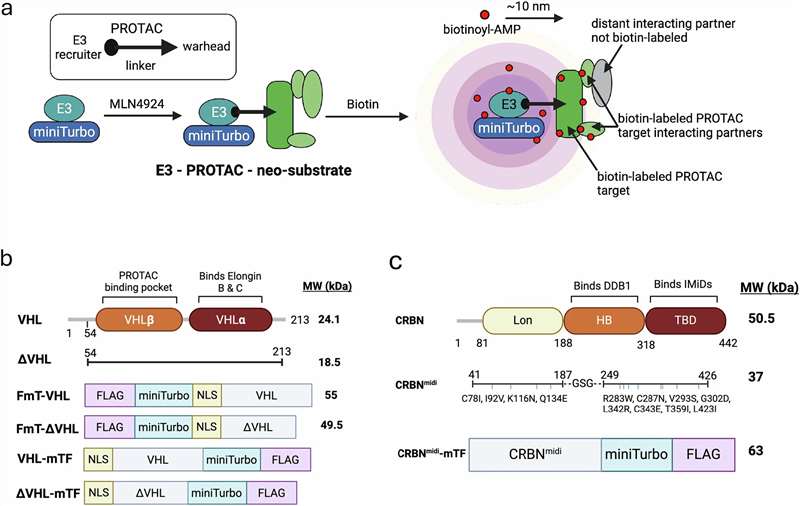
The authors developed ProtacID, a method that fuses a promiscuous biotin ligase (BirA*) to the target POI. Upon PROTAC treatment and biotin supplementation, BirA* biotinylates proteins within approximately 10 nm of the POI — capturing the recruited E3 ligase and the entire PROTAC-proximal interaction network in living cells. Biotinylated proteins are enriched by streptavidin pull-down and identified by LC-MS/MS. The method was validated across six human cell lines using VHL-recruiting PROTACs (MZ1 targeting BRD4) and CRBN-recruiting PROTACs (dBET1 targeting BRD4, dTAG-13 targeting FKBP12-F36V). Bioinformatic filtering distinguished background proximity labeling from PROTAC-dependent signals.

Results

ProtacID robustly identified PROTAC-dependent recruitment of both VHL and CRBN E3 ligases to their respective targets, with signal-to-background ratios exceeding 20-fold for productive degrader-proximal interactions. The method successfully distinguished productive ternary complexes (where the PROTAC recruited the E3 ligase and triggered measurable degradation) from non-productive binding events (where the PROTAC bound the POI but did not recruit E3 ligase or did not lead to ubiquitination). By comparing BioID labeling patterns across multiple PROTACs targeting the same POI, the authors ranked PROTACs by their E3 recruitment efficiency in living cells — producing a cellular ranking that correlated with degradation efficacy measured by quantitative proteomics and Western blot.

Significance for PROTAC Complex Profiling

This study establishes several principles directly relevant to our PROTAC complex profiling service. First, it demonstrates that proximity labeling MS captures PROTAC-induced ternary complex formation in living cells under endogenous expression conditions — providing translatability evidence that purified native MS alone cannot achieve. Second, the ability to distinguish productive from non-productive PROTAC engagement enables early triage of compounds that bind their target but fail to recruit the E3 ligase in the cellular environment. Third, the unbiased capture of the entire PROTAC-proximal proteome reveals off-target proximity interactions that could lead to unintended degradation — a critical safety assessment that no targeted assay can deliver.

Case study workflow diagram from the ProtacID study (Nat Commun 2025), showing the BioID-based proximity labeling strategy with BirA* fused to the target POI, PROTAC treatment, biotinylation of proximal proteins including the recruited E3 ligase, streptavidin enrichment, and LC-MS/MS identification of PROTAC-dependent interactors.

Figure from ProtacID study (Nat Commun, 2025, DOI: 10.1038/s41467-025-63357-7). BioID-based proximity labeling workflow for characterizing PROTAC-induced ternary complex formation and E3 ligase recruitment in living cells. CC BY 4.0.

FAQ

Frequently Asked Questions

Q: What is the difference between native MS and AP-MS for ternary complex detection?

Native MS detects intact ternary complexes directly from purified proteins under non-denaturing conditions, providing unambiguous mass evidence of complex formation and stoichiometry — including which specific molecular species exist in solution (free components, binary intermediates, ternary complex). AP-MS captures the complex from cellular lysates via affinity purification of a tagged POI, identifying co-purifying E3 ligase by LC-MS/MS as evidence of ternary complex formation. Native MS gives definitive complex confirmation and stoichiometry; AP-MS provides cellular context. The two methods are complementary and are often deployed in sequence — native MS for initial confirmation, AP-MS for cellular validation.

Q: How much PROTAC compound is required for a full multi-platform profiling campaign?

A native MS-only ternary complex assessment typically requires 1–2 mg. Adding AP-MS or ubiquitinomics increases the requirement to 3–5 mg. A full campaign including proteome-wide selectivity profiling requires 5–10 mg. We optimize experimental design to extract maximum characterization data from available material and can advise on the minimum viable platform combination for early-stage programmes with limited compound.

Q: Can PROTAC complex profiling distinguish on-target from off-target degradation?

Yes — this is the central deliverable of the proteome-wide selectivity profiling platform. Quantitative proteomics across PROTAC-treated versus control cells quantifies abundance changes for every protein, distinguishing the intended target from all other depleted proteins. Off-target degradation of closely related protein family members is routinely observed and quantified. The output includes a ranked selectivity table showing where each off-target falls relative to the intended target in terms of degradation potency and magnitude.

Q: What E3 ligases are compatible with your PROTAC profiling platforms?

All major E3 ligase families used in PROTAC development are compatible. The MS detection is E3-agnostic — any E3 that can be purified (native MS) or is expressed in the cellular system (AP-MS, ubiquitinomics, proteomics) is detectable. We have established protocols for VHL, CRBN, MDM2, cIAP1, and RNF4-recruiting PROTACs, and routinely adapt to novel E3 ligases as new warheads emerge.

Q: How is the hook effect handled in ternary complex analysis?

The hook effect — decreased ternary complex abundance at supra-optimal PROTAC concentrations — is routinely observed and characterized as a normal feature of PROTAC binding equilibria. We assay PROTACs across an 8-point concentration series covering 0.01–100 µM to capture the full ternary complex titration curve, identify the optimal concentration for maximal ternary complex formation, and calculate the cooperativity factor. The hook effect concentration is reported alongside the optimal concentration as part of the native MS data package.

Q: What cell lines are recommended for cellular PROTAC profiling studies?

HEK293T is the most commonly used line for AP-MS and ubiquitinomics due to high transfection efficiency and protein expression. For degradation selectivity profiling, the cell line should express the POI at levels comparable to the intended therapeutic target tissue — HCT116, K562, U2OS, and patient-derived lines are common choices. We assess POI expression levels and recommend the most appropriate cell line during project design. For PROTACs targeting endogenously expressed proteins, we recommend using a cell line with known endogenous target expression.

Q: Can you work with novel E3 ligases that have not been previously characterized for PROTAC recruitment?

Yes. For novel E3 ligases, we recommend starting with native MS using purified POI, E3 ligase, and PROTAC components to confirm ternary complex formation before advancing to cellular platforms. The native MS workflow requires only that the E3 ligase complex can be expressed and purified in active form — no prior PROTAC experience with that specific E3 is necessary. Once ternary complex formation is confirmed in the purified system, AP-MS and ubiquitinomics can be deployed for cellular validation.

Q: What is the turnaround time for a typical PROTAC complex profiling project?

A native MS-only study (ternary complex confirmation plus cooperativity measurement across a concentration series) takes 2–3 weeks. Adding AP-MS or ubiquitinomics extends the timeline to 3–4 weeks. A full multi-platform campaign (native MS + AP-MS + ubiquitinomics + proteome-wide selectivity profiling) takes 4–6 weeks. Timelines are confirmed during project design and depend on cell culture requirements, number of PROTAC compounds, and platform scope.

Advance Your PROTAC Programme with MS-Based Complex Profiling

Submit your PROTAC compound and project background — our scientists will recommend the optimal platform combination and design a characterization strategy matched to your degrader's development stage, target class, and decision timeline.

For Research Use Only (RUO). Not intended for diagnostic, therapeutic, or clinical decision-making purposes. Creative Proteomics services are designed to support preclinical research, drug discovery, and targeted protein degradation studies only.

Online Inquiry

Please submit a detailed description of your project. We will provide you with a customized project plan to meet your research requests. You can also send emails directly to for inquiries.

* Email
Phone
* Service & Products of Interest
Services Required and Project Description