GNPS Molecular Networking Service

Transform complex MS/MS data into actionable chemical insights with expert GNPS molecular networking — from raw spectra to publication-ready molecular networks.

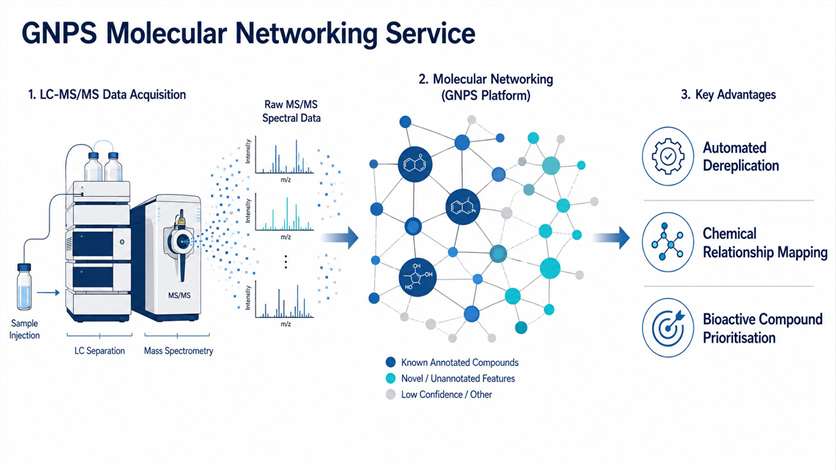
Natural product extracts, microbial fermentation broths, and complex biological mixtures routinely generate thousands of MS/MS spectra that are impractical to annotate manually. GNPS (Global Natural Products Social Molecular Networking) organises this data into molecular networks based on spectral similarity, giving you a visual map of every compound in your sample — and how they relate to each other.

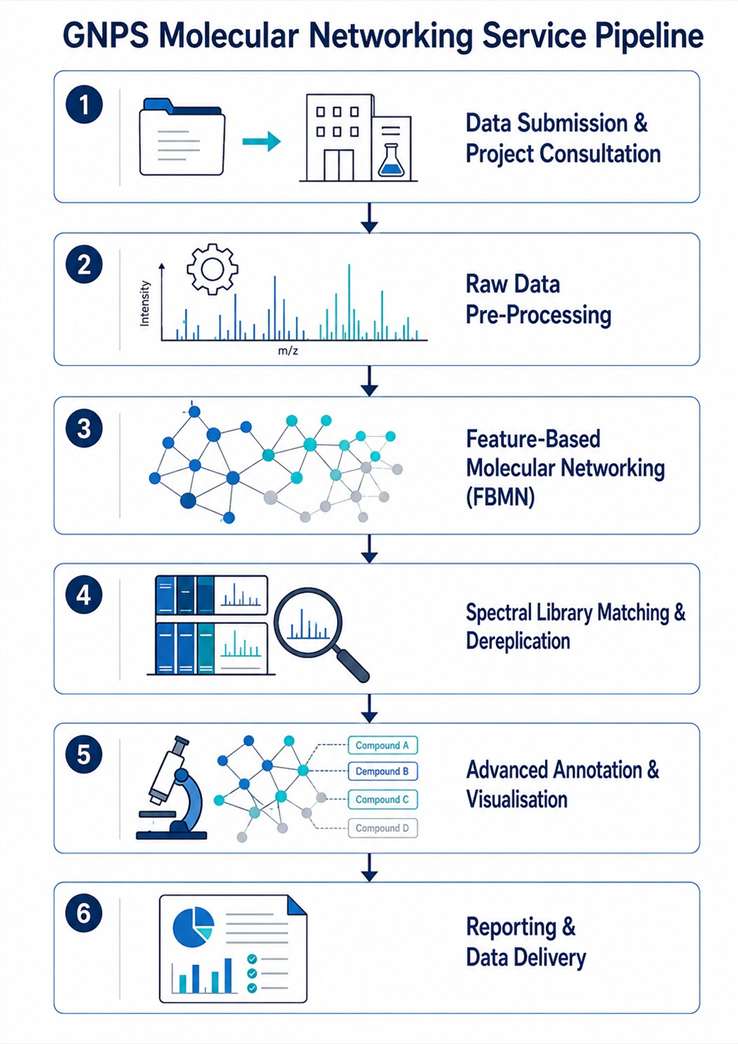
We handle the full computational pipeline: raw data pre-processing, feature-based molecular networking (FBMN), spectral library matching against GNPS and in-house databases, and expert interpretation of the resulting networks. The output is a fully annotated molecular network with a comprehensive dereplication report — no software installation or bioinformatics expertise required on your end. We work with plant extracts, microbial cultures, marine organism samples, fractionated libraries, and bioassay-guided fractionation sets, across Orbitrap, Q-TOF, and timsTOF platforms.

For deeper dereplication capabilities, explore our dedicated LC-HRMS/MS dereplication service. For a complete discovery pipeline, see our Natural Product MS Discovery Service.

GNPS molecular networking service overview with spectra and network
What Is GNPS Advantages Workflow Capabilities Sample Comparison Case Study FAQ

What Is GNPS Molecular Networking?

GNPS (Global Natural Products Social Molecular Networking) is an open-access, web-based mass spectrometry ecosystem that enables community-wide organisation, sharing, and analysis of tandem mass spectrometry (MS/MS) data. At its core, molecular networking organises MS/MS spectra into a visual network where each node represents a unique compound (or feature) and edges connect nodes with similar fragmentation patterns. Compounds with related structures cluster together, allowing researchers to rapidly identify known compounds, discover structural analogues, and prioritise potentially novel molecules — all without manual spectral interpretation.

Feature-based molecular networking (FBMN), an advanced extension of the GNPS workflow, integrates quantitative feature tables from popular LC-MS pre-processing tools (e.g., MZmine, MS-DIAL, OpenMS) with molecular networking. This preserves quantitative information — peak area, retention time, ion mobility drift time — and enables direct correlation of chemical space with sample metadata, bioactivity data, or statistical group comparisons.

Our pipeline covers the full GNPS workflow: raw data pre-processing, feature detection and alignment, FBMN analysis, spectral library searching against GNPS and in-house libraries, MS2LDA substructure discovery, and expert interpretation of molecular network results. We deliver publication-ready network visualisations and comprehensive dereplication tables.

Key Advantages of Our GNPS Molecular Networking Service

End-to-End Computational Pipeline

From raw LC-MS/MS data to annotated molecular networks — we handle all pre-processing, feature detection, alignment, FBMN analysis, and library matching. No software installation or bioinformatics expertise required on your end.

Integration with Advanced Workflows

Beyond standard molecular networking, we offer feature-based molecular networking (FBMN), MS2LDA substructure discovery, SIRIUS/CSI:FingerID in silico annotation, and MolNetEnhancer for automated chemical class assignment.

Multi-Sample Comparative Analysis

Compare chemical profiles across multiple samples, conditions, or time points within a single molecular network. Statistical correlation with bioactivity data enables rapid identification of bioactive features directly from complex mixtures.

Publication-Ready Deliverables

Receive interactive molecular network visualisations (Cytoscape format), high-resolution publication-ready figures, annotated feature tables with identification confidence levels, and comprehensive dereplication summaries.

Broad Sample Compatibility

Our workflow is optimised for plant extracts, microbial fermentation broths, marine organism samples, fractionated libraries, and bioassay-guided fractionation sets. We also support data from multiple MS platforms (Orbitrap, Q-TOF, timsTOF).

Expert Bioinformatics Support

Our team has extensive experience in GNPS workflow optimisation, parameter tuning, and result interpretation. We provide detailed methods sections suitable for inclusion in manuscripts and grant applications.

Our GNPS Molecular Networking Workflow

Our standard GNPS molecular networking workflow comprises six stages, from data submission to final reporting:

1

Data Submission & Project Consultation

Submit your raw LC-MS/MS data (.raw, .mzXML, .mzML, or .d formats) along with project objectives. We review your sample types, experimental design, and desired outcomes to optimise the analysis parameters.

2

Raw Data Pre-Processing

Raw data is processed using MZmine or MS-DIAL for feature detection, deisotoping, alignment, and gap-filling. Parameters are optimised for your specific data type and instrument platform.

3

Feature-Based Molecular Networking (FBMN)

Processed feature tables and MS/MS spectra are uploaded to the GNPS platform for FBMN analysis. Molecular networks are generated using optimised cosine score thresholds and minimum matched fragment settings.

4

Spectral Library Matching & Dereplication

All MS/MS spectra are searched against GNPS spectral libraries, MoNA, and our in-house natural product database. Known compounds are annotated with identification confidence levels following Metabolomics Standards Initiative (MSI) guidelines.

5

Advanced Annotation & Visualisation

Additional computational tools (SIRIUS/CSI:FingerID, MS2LDA, MolNetEnhancer) provide deeper structural characterisation. Molecular networks are visualised and annotated in Cytoscape for publication-ready output.

6

Reporting & Data Delivery

A comprehensive report is delivered, including annotated molecular network figures, feature tables with identification results, dereplication summaries, and all processed data files.

GNPS molecular networking workflow with six analysis steps

Service Capabilities

Our GNPS molecular networking platform supports a wide range of natural product discovery applications:

Rapid Dereplication of Known Compounds

Identify and eliminate known compounds early in the discovery pipeline. Molecular networking clusters known compounds by spectral similarity, enabling rapid flagging of previously characterised metabolites across entire sample sets.

Novel Compound Discovery & Prioritisation

Unannotated clusters in molecular networks often represent potentially novel chemotypes. We prioritise these features for downstream isolation and structural elucidation, accelerating the discovery of new natural products.

Bioactivity Correlation

Correlate MS features with bioactivity data (MIC, IC50, % inhibition) directly within the molecular network. Bioactive features are highlighted and prioritised, enabling targeted isolation of active compounds. For integrated workflows, see our bioassay-guided fractionation + LC-MS service.

Comparative Metabolomics

Compare chemical profiles across treatment groups, time series, or sample types. Statistical analysis (PCA, PLS-DA) is integrated with molecular networking to identify discriminatory features.

Substructure Discovery with MS2LDA

Apply MS2LDA substructure discovery to identify shared fragmentation motifs (Mass2Motifs) across your dataset, providing orthogonal structural context beyond spectral library matching.

Multi-Platform Data Integration

We accept data from Orbitrap, Q-TOF, timsTOF, and other high-resolution MS platforms. Ion mobility data can be integrated for additional separation and annotation confidence.

Sample Requirements

Sample TypeRecommended Data FormatMinimum Data SizeRecommended ReplicatesNotes
LC-MS/MS raw data (Orbitrap).raw (Thermo)1 file per sample3–5 per groupDDA preferred; DIA data requires additional processing
LC-MS/MS raw data (Q-TOF).d (Agilent), .wiff (Sciex), .raw (Waters)1 file per sample3–5 per groupProvide instrument method details
Pre-processed data.mzXML, .mzML, .mgf1 file per sample3–5 per groupInclude processing parameters
Feature table + MS/MS spectra.csv (feature table) + .mgf (spectra)1 pair per sample setN/AFor FBMN direct upload
Bioactivity data (optional).csv or .xlsxN/AN/AFor bioactivity correlation analysis

Deliverables

  • Annotated molecular network visualisation (Cytoscape .cys + high-resolution .png/.svg)
  • Feature table with retention time, m/z, molecular formula, identification confidence level, and spectral library match scores
  • Dereplication summary listing known compounds, their sources, and bioactivity context (if applicable)
  • FBMN results with quantitative feature abundance across all samples
  • MS2LDA substructure annotation report (if requested)
  • SIRIUS/CSI:FingerID in silico annotation results (if requested)
  • Raw data processing report detailing all software parameters, versions, and database versions used
  • Publication-ready figures including molecular networks, MS/MS mirror plots, and chromatographic data
  • Interactive HTML molecular network for data exploration

Technology Comparison — GNPS Molecular Networking vs Alternative Approaches

ApproachCore PrincipleThroughputDereplication SpeedNovel Compound DetectionQuantitative InformationBioinformatics Expertise Required
GNPS Molecular Networking (FBMN)MS/MS spectral similarity-based clustering with quantitative feature integrationHigh — hundreds of samples per networkRapid — automated library matching across entire datasetExcellent — unannotated clusters flag novel chemotypesYes — feature abundance preserved across samplesModerate — our service eliminates this requirement
Manual MS/MS InterpretationIndividual spectral inspection and database searchingLow — one spectrum at a timeSlow — requires expert analystModerate — depends on analyst expertiseNoHigh
Molecular Networking (classic, non-FBMN)MS/MS spectral clustering without quantitative feature alignmentModerateModerateGoodLimited — no feature abundance dataModerate
Molecular Formula Assignment OnlyAccurate mass-based formula predictionHighLimited — no structural contextPoor — cannot distinguish isomers or analoguesYesLow
LC-UV-Based DereplicationUV spectral matching against compound librariesModerateModeratePoor — limited to UV-active compoundsSemi-quantitativeLow

Case Study — GNPS Molecular Networking Accelerates Bioactive Metabolite Discovery via the nanoRAPIDS Pipeline

Nuñez Santiago I., Machushynets N.V., Mladic M., van Bergeijk D.A., Elsayed S.S., Hankemeier T., van Wezel G.P. "nanoRAPIDS as an analytical pipeline for the discovery of novel bioactive metabolites in complex culture extracts at the nanoscale." Communications Chemistry. 2024;7:71. https://doi.org/10.1038/s42004-024-01153-y

Background

Microbial natural product extracts are chemically complex, containing hundreds to thousands of metabolites at varying concentrations. Traditional bioassay-guided discovery workflows are slow and often re-isolate known compounds. Nuñez Santiago et al. (2024) developed nanoRAPIDS (Reliable Analytical Platform for Identification and Dereplication of Specialized Metabolites based on Nanofractionation), an integrated analytical pipeline that combines nanoscale fractionation, bioactivity screening, and GNPS feature-based molecular networking for rapid identification of bioactive metabolites from complex culture extracts.

Methods

The nanoRAPIDS workflow begins with high-resolution nanofractionation of just 10 µL of crude microbial extract into 384 fractions (6-second resolution). Each fraction is subjected to a resazurin reduction bioassay against target microorganisms, and bioactive fractions are identified. Active fractions are then analysed by LC-MS/MS, and the resulting data is processed through GNPS feature-based molecular networking (FBMN) for dereplication and compound annotation. The pipeline was validated using a Bacillus sp. 90A-23 extract and subsequently applied to discover novel metabolites from Streptomyces sp. MBT84.

Results

In the validation experiment, GNPS molecular networking of the Bacillus sp. 90A-23 extract revealed two major compound clusters: iturins (Iturin A1–A7) and surfactins (Surfactin Leu/Ile7 C13–C15), both confirmed as the bioactive agents against Escherichia coli, Bacillus subtilis, and Aspergillus niger. The molecular network clearly separated these two compound families into distinct clusters, demonstrating the power of GNPS for rapid chemical family identification. In the discovery phase, the pipeline was applied to Streptomyces sp. MBT84 cultured with and without catechol induction. GNPS molecular networking (Fig. 2c) identified an angucycline family cluster, within which a previously unknown N-acetylcysteine conjugate — saquayamycin N — was discovered alongside the known compound fridamycin A. Both compounds showed MIC values of 125 µg/mL against Bacillus subtilis 168.

Conclusions

This study demonstrates how GNPS feature-based molecular networking, when integrated with nanoscale fractionation and bioactivity screening, enables rapid dereplication of known compounds and prioritisation of novel bioactive metabolites from complex microbial extracts. The nanoRAPIDS pipeline required only 10 µL of crude extract per analysis and completed the full screening-to-identification workflow in approximately 24 hours — a dramatic acceleration over traditional methods. This approach is directly applicable to our GNPS molecular networking service, where we combine expert FBMN analysis with comprehensive dereplication to accelerate natural product discovery for our clients.

GNPS molecular network of iturin and surfactin clusters

GNPS molecular network of Bacillus sp. 90A-23 extract showing iturin and surfactin families (adapted from Nuñez Santiago et al., 2024, Fig. 2c).

FAQ

Frequently Asked Questions

Q: What is GNPS molecular networking and how does it work?

GNPS (Global Natural Products Social Molecular Networking) is a web-based platform that organises MS/MS data into molecular networks based on spectral similarity. Each node represents a compound, and connected nodes share similar fragmentation patterns, indicating structural relatedness. This enables rapid visual identification of compound families, known metabolites, and potentially novel chemistry across entire sample sets.

Q: What types of samples can be analysed by GNPS molecular networking?

GNPS molecular networking is suitable for any sample analysed by LC-MS/MS, including plant extracts, microbial fermentation broths, marine organism extracts, fractionated libraries, bioassay fractions, and pure compound libraries. Data from Orbitrap, Q-TOF, and timsTOF platforms are all compatible. DDA (data-dependent acquisition) data is preferred, though DIA data can be accommodated with additional processing.

Q: How does GNPS molecular networking differ from traditional LC-MS/MS analysis?

Traditional LC-MS/MS analysis typically involves manual inspection of individual MS/MS spectra or targeted database searching. GNPS molecular networking provides a global view of all detected compounds simultaneously, revealing structural relationships between compounds that would be impossible to discern from individual spectra. This network-based approach dramatically accelerates dereplication and enables discovery of structural analogues that might otherwise be missed.

Q: What software and tools are used in the GNPS workflow?

Our standard workflow uses MZmine or MS-DIAL for data pre-processing, the GNPS platform for FBMN analysis and spectral library searching, Cytoscape for network visualisation, and additional tools including SIRIUS/CSI:FingerID for in silico annotation, MS2LDA for substructure discovery, and MolNetEnhancer for automated chemical class annotation.

Q: Can GNPS molecular networking identify novel compounds?

Yes. Compounds that do not match any known spectral library entry appear as unannotated nodes in the molecular network. Clusters of unannotated nodes often represent potentially novel chemotypes. Combined with in silico annotation tools (SIRIUS/CSI:FingerID, CANOPUS), molecular formula assignment, and MS2LDA substructure analysis, we can provide deep structural characterisation of potentially novel compounds directly from MS/MS data.

Q: What deliverables can I expect from a GNPS molecular networking service?

You will receive annotated molecular network visualisations (Cytoscape format and high-resolution figures), comprehensive feature tables with identification results, dereplication summaries, processed data files, and a detailed methods report. All deliverables are formatted for direct use in manuscripts, presentations, and grant applications.

References

  1. Nuñez Santiago I., Machushynets N.V., Mladic M., et al. nanoRAPIDS as an analytical pipeline for the discovery of novel bioactive metabolites in complex culture extracts at the nanoscale. Communications Chemistry. 2024;7:71.
  2. Nothias L.F., Petras D., Schmid R., et al. Feature-based molecular networking in the GNPS analysis environment. Nature Methods. 2020;17:905–908.
  3. Wang M., Carver J.J., Phelan V.V., et al. Sharing and community curation of mass spectrometry data with Global Natural Products Social Molecular Networking. Nature Biotechnology. 2016;34:828–837.

For Research Use Only. Not for use in diagnostic or clinical procedures.

Accelerate Your Natural Product Discovery with GNPS

Ready to transform your complex LC-MS/MS data into actionable chemical insights? Share your project details and our bioinformatics team will design a tailored GNPS molecular networking analysis for your research program.

Online Inquiry

Please submit a detailed description of your project. We will provide you with a customized project plan to meet your research requests. You can also send emails directly to for inquiries.

* Email
Phone
* Service & Products of Interest
Services Required and Project Description