Cellular Lipidomics Drug Profiling

Decode drug-induced lipid remodeling at cellular resolution — comprehensive LC-MS/MS lipidomics profiling of drug-treated cells for MOA elucidation, lipid toxicity assessment, and resistance mechanism discovery.

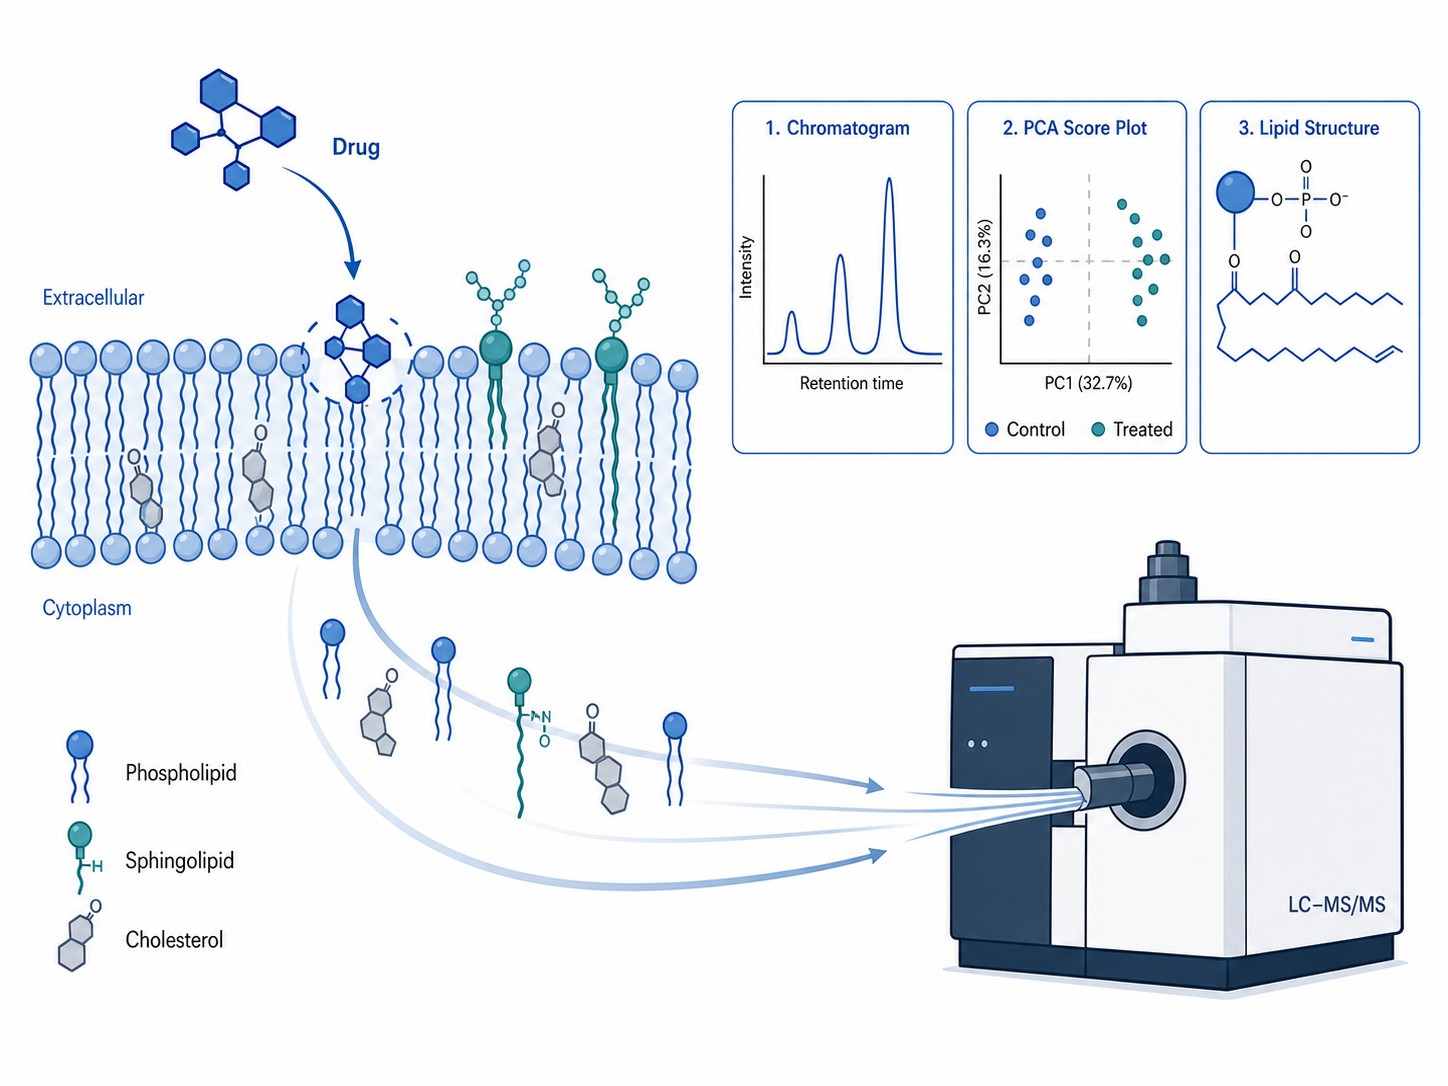
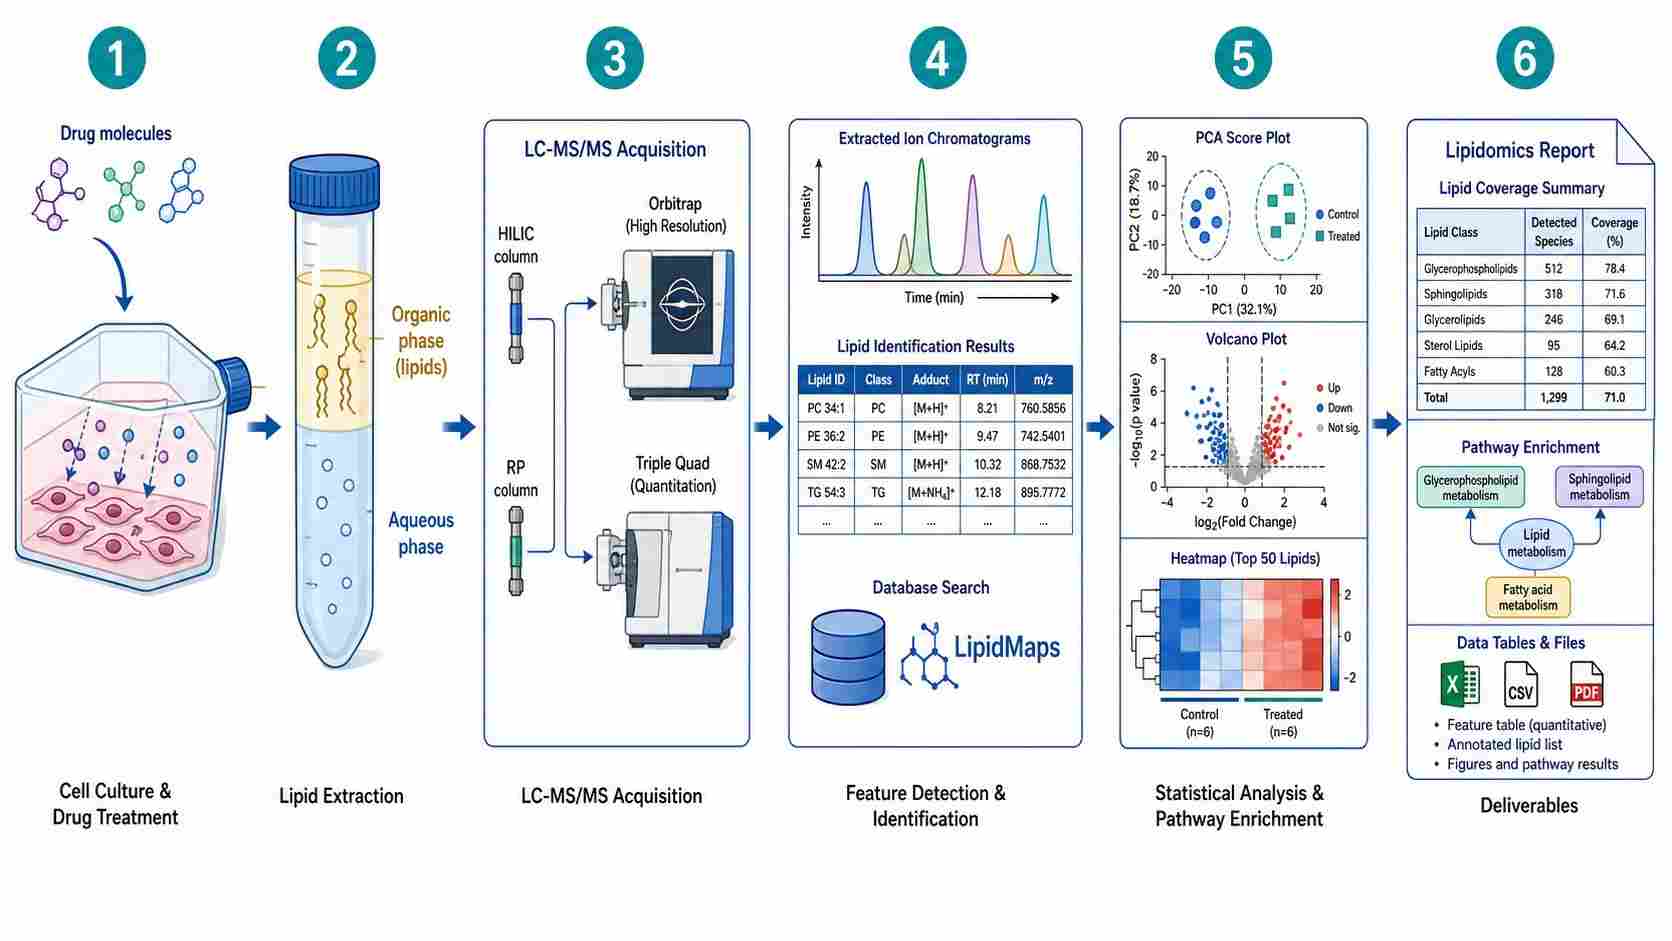
Cellular lipidomics drug profiling is a mass spectrometry-based analytical approach that comprehensively characterizes lipid remodeling in living cells following drug treatment. Unlike conventional biochemical assays that measure single lipid targets or bulk lipid content, cellular lipidomics captures the full lipid landscape — hundreds of individual lipid species across multiple structural classes — providing a systems-level view of how drugs perturb cellular lipid homeostasis.

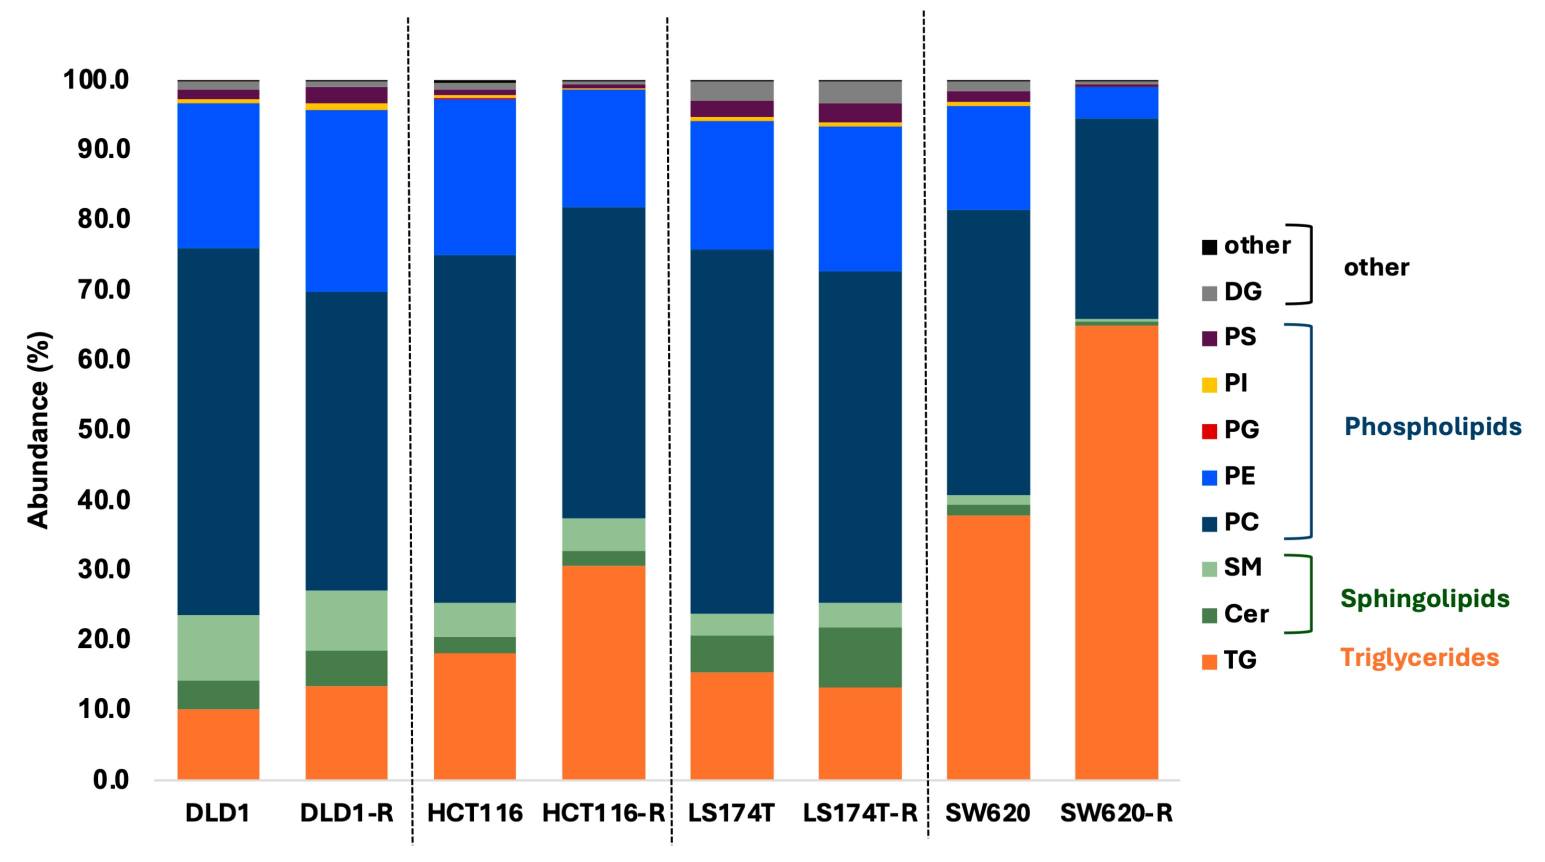
Lipids are not merely structural components of cell membranes. They function as signaling molecules, energy storage reservoirs, and mediators of protein localization and activity. Drug-induced alterations in lipid composition can reveal mechanism of action (MOA), predict toxicity liabilities such as phospholipidosis and steatosis, and uncover adaptive resistance mechanisms that cancer cells deploy to survive chemotherapy. Despite this biological significance, lipidomics remains underutilized in early-stage drug discovery, largely because of the analytical complexity and the lack of CRO partners with dedicated drug-centric lipidomics workflows.

Key Capabilities:

  • 500+ lipid species across 15+ classes per project
  • Isomer-level resolution for major phospholipid and sphingolipid classes
  • Relative (untargeted) and absolute (targeted, pmol/10⁶ cells) quantification
  • Validated for cell lines, primary cells, 3D spheroids, and organoids
  • Pathway-centric bioinformatics with lipid-specific KEGG and Reactome mapping
  • Integrated with Cell-based MS Drug Screening platform (16 sub-services)
Cellular lipidomics drug profiling platform overview showing drug molecule interacting with cell membrane, lipid species being released and analyzed by a stylized mass spectrometer with lipid structural icons and data visualization overlay.
Overview Workflow Lipid Coverage Specifications Applications Case Study Sample Requirements FAQ

Why Cellular Lipidomics for Drug Discovery?

Lipid metabolism responds rapidly to pharmacological intervention. Within hours of drug exposure, cells can remodel their membrane lipid composition, alter lipid droplet dynamics, and shift bioactive lipid signaling profiles. These changes often precede transcriptional responses and can serve as early biomarkers of drug efficacy or toxicity. Cellular lipidomics captures this early metabolic response, providing a sensitive readout that complements transcriptomic and proteomic data.

Creative Proteomics addresses this gap with an integrated cellular lipidomics drug profiling platform that combines high-resolution LC-MS/MS instrumentation, broad lipid coverage (500+ species across 15+ classes), isomer-level structural resolution, and pathway-centric bioinformatics. Our service is designed for pharmaceutical R&D scientists, cancer metabolism researchers, and drug discovery teams who need actionable lipidomic insights from drug-treated cell models — including adherent cell lines, suspension cultures, primary cells, 3D spheroids, and organoids.

Why It Matters for Drug Discovery

Drug-Induced Phospholipidosis & Steatosis Screening

Drug-induced phospholipidosis — excessive phospholipid accumulation in lysosomes — is a major safety concern in drug development. Many cationic amphiphilic drugs (CADs) trigger phospholipidosis by inhibiting lysosomal phospholipase activity. Similarly, drug-induced steatosis involves triglyceride accumulation in hepatocytes. Regulatory agencies increasingly expect early in vitro screening for these liabilities. Cellular lipidomics provides a direct, quantitative readout: phospholipid species accumulation for phospholipidosis and TAG/DAG elevation for steatosis, enabling early go/no-go decisions.

Lipid Metabolic Vulnerabilities in Cancer

Cancer cells exhibit profound lipid metabolic reprogramming to support proliferation, membrane biosynthesis, and redox balance. Key enzymes such as FASN, SCD1, and LPCAT1 are frequently upregulated in tumors and represent emerging drug targets. Cellular lipidomics directly quantifies the impact of inhibitors targeting these enzymes — measuring changes in saturated vs. monounsaturated fatty acid ratios (SCD1 inhibition), PC species remodeling (LPCAT1 inhibition), or de novo lipogenesis suppression (FASN inhibition).

Sphingolipid & Ceramide Signaling in Drug Resistance

Sphingolipids, particularly ceramides and sphingosine-1-phosphate (S1P), constitute a rheostat that determines cell fate. Pro-apoptotic ceramides accumulate in response to chemotherapy, while pro-survival S1P promotes resistance. Cancer cells can shift this balance by upregulating ceramidase or sphingosine kinase activity. Cellular lipidomics profiling of the sphingolipidome — including Cer, HexCer, SM, and S1P species — reveals how resistant cells rewire sphingolipid metabolism to evade apoptosis.

Bioactive Lipid Profiling for Inflammation Targets

Bioactive lipids — eicosanoids, endocannabinoids, lysophospholipids — are potent signaling molecules that regulate inflammation, pain, and immune function. Drug candidates targeting COX, LOX, phospholipase A2, or cannabinoid receptors directly modulate these lipid mediators. Cellular lipidomics provides quantitative profiling of this bioactive lipid network in drug-treated immune cells or inflamed tissue models, offering a functional readout of target engagement and pathway modulation.

For a comprehensive overview of our cell-based drug screening capabilities, visit our cell-based MS drug screening hub page. For complementary metabolomics analysis, see our cellular metabolomics screening service.

Service Modes — Cellular Lipidomics Drug Profiling Capabilities

Our cellular lipidomics platform is designed to support drug discovery programs across multiple analytical modes. Whether you need broad lipidome discovery or precise quantification of specific lipid species, we offer flexible workflows tailored to your research question.

We offer multiple analytical modes to accommodate diverse drug screening requirements and lipid class coverage:

MODE 1

Untargeted Lipidomics Discovery

Comprehensive profiling of the entire cellular lipidome without pre-selection bias.

  • 500+ lipid species across 15+ classes per project
  • HILIC + RP dual-chromatography for maximum coverage
  • Relative quantification with internal standard normalization
  • Ideal for MOA elucidation and biomarker discovery
MODE 2

Targeted Lipid Quantification

High-precision absolute quantification of pre-selected lipid species.

  • MRM-based quantification on Triple Quad 6500+
  • Absolute concentrations in pmol/10⁶ cells or pmol/μg protein
  • Class-specific internal standards (SPLASH LIPIDOMIX)
  • Ideal for target validation and dose-response studies
MODE 3

Phospholipidosis & Steatosis Screening

Dedicated toxicity screening for drug-induced lipid accumulation.

  • Quantitative readout of phospholipid species accumulation
  • TAG/DAG elevation monitoring for steatosis assessment
  • Validated for hepatocytes, neuronal cells, and cell lines
  • Supports regulatory non-clinical safety submissions
MODE 4

Cancer Lipid Metabolic Vulnerability Profiling

Targeted assessment of lipid metabolic enzyme inhibition in cancer cells.

  • FASN inhibition: 13C-palmitate tracing for de novo lipogenesis
  • SCD1 inhibition: MUFA/SFA ratio changes in membrane phospholipids
  • LPCAT1 inhibition: PC species distribution profiling
  • ACSL/ACOT modulation: activated fatty acid pool analysis
MODE 5

Sphingolipid & Ceramide Signaling Profiling

Focused analysis of sphingolipid metabolism in drug resistance and apoptosis.

  • Cer, HexCer, SM, S1P species quantification
  • Ceramide-S1P rheostat balance assessment
  • Isomer-level resolution of ceramide N-acyl chain length
  • Ideal for resistance mechanism and combination therapy studies
MODE 6

Bioactive Lipid & Eicosanoid Profiling

Quantitative profiling of lipid mediators in inflammation and immune targets.

  • Eicosanoids, endocannabinoids, lysophospholipids (LPA, LPC)
  • COX, LOX, PLA2 pathway modulation readout
  • Sub-nM detection limit for bioactive lipids
  • Ideal for anti-inflammatory drug development programs
MODE 7

Custom Method Development & Multi-Omics Integration

For specialized cell models or integrated multi-dimensional drug profiling.

  • Custom extraction protocol optimization for rare cell types
  • Multi-omics integration with transcriptomics, proteomics, metabolomics
  • Correlation networks and pathway-level concordance analysis
  • Mechanistic modeling of lipid metabolic flux

Our Cellular Lipidomics Workflow

A standardized, quality-controlled process from cell culture to final report. Each project is tailored to your specific cell model, drug compound, and research question.

1

Cell Culture & Drug Treatment Optimization

We work with your cell model of choice: adherent cell lines, suspension cultures, primary cells (hepatocytes, neurons, immune cells), 3D spheroids, or patient-derived organoids. Drug treatment conditions are optimized for your specific compound — including dose range (3-5 concentrations), time course (0-48 hours recommended), and vehicle control standardization (DMSO ≤0.1%). Biological replicates (3-6 per condition) are included to ensure statistical power.

2

Lipid Extraction

Method selection is guided by cell type and lipid classes of interest. We offer three validated extraction protocols: Folch extraction (chloroform/methanol/water, 2:1:0.75, v/v/v) for comprehensive lipidome coverage; MTBE extraction (methyl tert-butyl ether/methanol/water) for cleaner MS-compatible extracts; and BUME extraction (butanol/methanol) for high-throughput processing. For precious samples, microextraction protocols are optimized for as few as 1×10⁶ cells. All extractions include class-specific internal standards (SPLASH LIPIDOMIX) for absolute quantification.

3

LC-MS/MS Acquisition

We employ a dual-chromatography strategy: HILIC separates lipids by head group class (PC, PE, PI, PS, SM, Cer), while Reversed-Phase LC separates by fatty acyl chain length and unsaturation for species-level resolution. Detection is performed on Thermo Scientific Q Exactive HF-X or Orbitrap Fusion Lumos Tribrid mass spectrometers (full scan + data-dependent MS/MS, positive and negative ionization modes). For targeted quantification, we deploy a Sciex Triple Quad 6500+ system with multiple reaction monitoring (MRM).

4

Feature Detection & Lipid Identification

Raw data processing uses MS-DIAL for feature detection, deconvolution, and alignment, with LipidMaps and LipidBlast for MS/MS spectral matching. Our in-house lipid library provides curated retention time and MS/MS spectra for 500+ lipid species. Identifications are reported at LipidMaps confidence levels 1 (retention time + MS/MS match to authentic standard) and 2 (MS/MS match to library spectrum), with mass accuracy <5 ppm, isotope pattern matching, and MS/MS fragment coverage.

5

Statistical Analysis & Pathway Enrichment

Multivariate analysis: PCA (unsupervised), PLS-DA and OPLS-DA (supervised) for group separation. Univariate analysis: volcano plots (fold change vs. adjusted p-value), box plots, bar charts. Lipid pathway enrichment: custom lipid-centric pathway mapping using KEGG lipid metabolism pathways, Reactome lipid signaling, and curated lipid maps (sphingolipid metabolism, eicosanoid biosynthesis, glycerophospholipid remodeling). Multi-omics integration with transcriptomics, proteomics, or metabolomics data from the same samples.

6

Deliverables

Raw MS data (.raw/.d format), processed feature table (.csv/.xlsx with m/z, RT, intensity, annotation, MS/MS score), lipid identification report (PDF, LipidMaps confidence levels), statistical analysis report (PDF with PCA, PLS-DA, volcano plots, heatmaps), pathway enrichment report (PDF with bubble charts, pathway maps), targeted quantification table (.csv/.xlsx, absolute concentration in pmol/10⁶ cells), and comprehensive project summary report. Typical turnaround: 4-6 weeks from sample receipt.

Cellular lipidomics workflow diagram showing six steps from cell culture and drug treatment through lipid extraction, LC-MS/MS acquisition, feature detection, statistical analysis, and deliverable report generation.

Lipid Coverage

Our platform provides comprehensive coverage across six major lipid classes, with isomer-level structural resolution for key phospholipid and sphingolipid species.

Lipid ClassExamplesCoverage
GlycerophospholipidsPC, PE, PS, PI, PA, PG, CL200+ species
SphingolipidsSM, Cer, HexCer, LacCer, S1P100+ species
SterolsCholesterol, Cholesteryl esters, Oxysterols30+ species
GlycerolipidsTAG, DAG, MAG150+ species
Fatty AcidsSFA, MUFA, PUFA, Oxylipins, Eicosanoids50+ species
Bioactive LipidsEndocannabinoids, LPA, LPC, S1P30+ species

Isomer-Level Resolution: Our platform resolves lipid isomers indistinguishable by mass alone — sn-position isomers via diagnostic MS/MS fragment ion ratios for PC, PE, PS, and PI classes; double bond position isomers via ozolysis or Paterno-Büchi derivatization; and ceramide species by N-acyl chain length and saturation. For targeted quantification of specific lipid species, see our targeted lipid quantification service.

Technical Specifications

Our cellular lipidomics platform combines high-resolution mass spectrometry with optimized chromatography for maximum lipid coverage and quantification accuracy.

ParameterSpecification
PlatformQ Exactive HF-X / Orbitrap Fusion Lumos / Triple Quad 6500+
IonizationHESI (positive & negative mode, polarity switching)
ChromatographyHILIC (class separation) + RP (species separation)
Mass resolution70,000–240,000 (FWHM at m/z 200)
Mass accuracy<3 ppm (internal calibration)
Detection limitSub-nM for bioactive lipids
QuantificationRelative (untargeted) + Absolute (targeted, pmol/10⁶ cells)
Dynamic range>4 orders of magnitude
Cell inputFrom 1×10⁶ cells (microextraction)
Turnaround time4-6 weeks (standard project)

Applications

Cellular lipidomics drug profiling is most impactful when researchers need to understand how drug candidates affect the complete lipid landscape of living cells. Below are representative research scenarios where our platform provides a clear technical advantage.

Drug MOA Elucidation

Lipid remodeling is a sensitive and early indicator of drug target engagement. Kinase inhibitors, epigenetic modulators, and metabolic drugs all produce characteristic lipid signatures that can classify compounds by MOA.

Cellular lipidomics provides: a functional readout that complements target-based assays, particularly for drugs with polypharmacology or unknown targets.

Phospholipidosis & Steatosis Screening

Early identification of phospholipidosis and steatosis liabilities is critical for compound progression.

Cellular lipidomics provides: direct quantification of lipid accumulation patterns — phospholipid enrichment in lysosomes (phospholipidosis) and triglyceride accumulation (steatosis) — with quantitative endpoints that support regulatory submissions and candidate selection.

Cancer Metabolic Vulnerability Profiling

Tumors exhibit addiction to specific lipid metabolic pathways that can be therapeutically targeted.

Cellular lipidomics enables: FASN inhibition profiling (13C-palmitate tracing), SCD1 inhibition profiling (MUFA/SFA ratio changes), LPCAT1 inhibition profiling (altered PC species distribution), and ACSL/ACOT modulation analysis.

Resistance Mechanism Discovery

Drug resistance frequently involves lipid-mediated adaptive mechanisms: altered membrane fluidity, enhanced sphingolipid metabolism, and increased lipid droplet formation.

Cellular lipidomics reveals: lipid signatures of resistance through profiling of parental vs. resistant isogenic cell lines, informing combination therapy strategies.

Neurodegenerative Disease Drug Development

Lipid raft composition is increasingly implicated in Alzheimer's, Parkinson's, and Huntington's disease pathogenesis.

Cellular lipidomics assesses: how drug candidates affect raft lipid composition, amyloid precursor protein processing, and synaptic lipid signaling in neuronal cell models or iPSC-derived neurons.

Metabolic Disease Target Validation

Drugs targeting lipid metabolism enzymes (DGAT, ACC, SCD, FASN, HMGCR, CETP) require direct evidence of target engagement at the lipid product level.

Cellular lipidomics provides: the definitive readout — does the inhibitor actually reduce the expected lipid product in the relevant cell type?

Data Analysis & Bioinformatics

Our bioinformatics pipeline transforms raw lipidomics data into biologically interpretable results through a structured analytical workflow.

Data Processing & QC

Raw MS data undergo feature detection, retention time alignment, and missing value imputation using MS-DIAL. Features are filtered by signal-to-noise ratio (>10), blank subtraction, and coefficient of variation (<30% in QC samples). Pooled QC samples are injected every 10 analytical runs, with CV monitoring for internal standards and endogenous features.

Statistical Analysis

Tiered statistical approach: exploratory PCA for overall group separation, supervised PLS-DA and OPLS-DA for discriminating lipid feature identification, volcano plots combining fold change (≥1.5 or ≤0.67) with statistical significance (adjusted p-value <0.05, Benjamini-Hochberg correction), and hierarchical clustering of top differentially regulated lipid species with z-score normalization.

Lipid Pathway Enrichment

Significantly altered lipids are mapped to lipid-centric KEGG pathways (glycerophospholipid metabolism, sphingolipid metabolism, glycerolipid metabolism, fatty acid biosynthesis, steroid biosynthesis), Reactome lipid signaling pathways (sphingolipid signaling, phospholipid signaling, eicosanoid metabolism), and custom pathway maps (phospholipidosis pathway, ceramide-S1P rheostat, Lands cycle remodeling).

Multi-Omics Integration

For projects with matched transcriptomics, proteomics, or metabolomics data, we offer correlation networks between lipid species and gene/protein expression, pathway-level concordance analysis (e.g., does FASN upregulation correlate with increased PC and TAG levels?), and mechanistic modeling of lipid metabolic flux based on enzyme expression and lipid product profiles.

For multi-omics integration projects, see our multi-omics integration service. For dedicated phospholipidosis assessment, visit our phospholipidosis screening assay page.

Case Study: Lipid Species Signatures in FOLFOXIRI-Resistant Colorectal Cancer Cells

Ramzy GM, Meister I, Rudaz S, Boccard J, Nowak-Sliwinska P. Identification of Lipid Species Signatures in FOLFOXIRI-Resistant Colorectal Cancer Cells. International Journal of Molecular Sciences 2025;26(3):1169. https://doi.org/10.3390/ijms26031169 (CC BY 4.0)

Background

Colorectal cancer (CRC) remains the third most common cancer worldwide, and acquired chemoresistance to multi-drug regimens such as FOLFOXIRI (5-fluorouracil + oxaliplatin + irinotecan) is a major clinical challenge. Lipid metabolism reprogramming is increasingly recognized as a hallmark of chemoresistance, but the specific lipid species signatures associated with FOLFOXIRI resistance across different CRC cell lines had not been systematically characterized.

Study Design

Ramzy et al. (2025) profiled the lipidomes of four CRC cell lines — DLD1, HCT116, LS174T, and SW620 — before and after chronic FOLFOXIRI exposure. Using an untargeted LC-MS lipidomics workflow, they identified and quantified lipid species across multiple classes to determine whether a common lipid signature of FOLFOXIRI resistance exists across genetically diverse CRC models.

Key Findings

FOLFOXIRI-resistant cells showed consistent lipid subclass redistribution across all four cell lines, with glycerophospholipids (particularly PC and PE) and sphingolipids (particularly SM and Cer) being the most significantly altered classes. While some lipid changes were shared (e.g., increased saturated PC species), each cell line also exhibited unique lipid adaptations, reflecting the genetic heterogeneity of CRC. AMOPLS analysis revealed that the resistance-associated lipid signature was partially independent of cell line identity, suggesting a core lipid remodeling program common to FOLFOXIRI resistance. The observed lipid changes — increased saturation of membrane phospholipids, altered ceramide/S1P balance, and shifts in cholesterol ester content — are consistent with known resistance mechanisms including reduced membrane permeability, enhanced anti-apoptotic signaling, and altered lipid droplet dynamics.

Relevance

This case study demonstrates the power of cellular lipidomics to uncover lipid-mediated resistance mechanisms that are not apparent from genomic or transcriptomic data alone. The same analytical approach can be applied to your drug candidates — whether profiling acquired resistance in isogenic cell line pairs, identifying predictive lipid biomarkers of response, or characterizing the lipid remodeling effects of novel therapeutic agents.

Scientific illustration showing four CRC cell lines (DLD1, HCT116, LS174T, SW620) with FOLFOXIRI treatment, highlighting lipid subclass redistribution with PCA plot and lipid species icons indicating up/down regulation (adapted from Ramzy et al. 2025, International Journal of Molecular Sciences, CC BY 4.0).

Adapted from Ramzy et al. (2025): Lipid species signatures in FOLFOXIRI-resistant colorectal cancer cells. Untargeted LC-MS lipidomics revealed consistent lipid subclass redistribution across four CRC cell lines, with glycerophospholipids and sphingolipids most significantly altered.

Sample Requirements for Cellular Lipidomics Drug Profiling

Our protocols are optimized for a wide range of cell culture formats. The table below provides recommended starting conditions for common cell types.

ParameterRequirement
Minimum cell number1×10⁶ cells (microextraction protocol)
Recommended cell number5×10⁶ cells (standard protocol)
Biological replicates3-6 per condition (6 recommended for robust statistics)
Control groupsVehicle-treated control (same DMSO/solvent concentration)
Drug concentration3-5 doses (dose-response) or IC50 equivalent
Time points2-4 time points (0h, 6h, 24h, 48h recommended)
Cell formatAdherent (T25/T75), suspension (1×10⁶/mL), 3D spheroids, organoids
Sample storageSnap-freeze in liquid N₂, store at -80°C
ShippingDry ice, ≥5 kg per shipment

For rare or precious samples, we offer optimized microextraction protocols that reduce minimum cell requirements. Contact our scientific team to discuss your specific sample type and project requirements.

FAQ

Frequently Asked Questions

Q: What types of lipid classes can you detect in drug-treated cells?

We detect and quantify lipid species across six major classes: glycerophospholipids (PC, PE, PS, PI, PA, PG, CL — 200+ species), sphingolipids (SM, Cer, HexCer, LacCer, S1P — 100+ species), sterols (cholesterol, cholesteryl esters, oxysterols — 30+ species), glycerolipids (TAG, DAG, MAG — 150+ species), fatty acids (SFA, MUFA, PUFA, oxylipins, eicosanoids — 50+ species), and bioactive lipids (endocannabinoids, LPA, LPC — 30+ species). Total coverage exceeds 500 lipid species per project.

Q: What is the minimum cell number required for lipidomics analysis?

Our microextraction protocol requires as few as 1×10⁶ cells. For standard analysis with absolute quantification, we recommend 5×10⁶ cells per sample. For precious samples such as organoids or primary cells, we can optimize protocols for lower cell numbers — please contact our scientific team to discuss your specific sample constraints.

Q: Can you distinguish between different lipid isomers (sn-position, double bond)?

Yes. Our platform provides isomer-level resolution for major lipid classes. We distinguish sn-position isomers (e.g., PC 16:0/18:1 vs. PC 18:1/16:0) using diagnostic MS/MS fragment ion ratios. For double bond position isomers, we offer ozolysis or Paterno-Büchi derivatization workflows. Ceramide species are resolved by N-acyl chain length and saturation.

Q: Do you provide absolute quantification or only relative abundance?

Both. Our untargeted workflow provides relative quantification (fold change between conditions) with internal standard normalization. For targeted quantification of specific lipid species, we deploy class-specific internal standards (SPLASH LIPIDOMIX) and external calibration curves to report absolute concentrations in pmol/10⁶ cells or pmol/μg protein.

Q: How do you handle batch effects in large-scale lipidomics studies?

We implement a comprehensive QC strategy: pooled QC samples injected every 10 analytical runs, CV monitoring for internal standards and endogenous features, batch correction using QC-based normalization (LOESS or support vector regression), and randomized injection order. Typical technical CV is <20% for 80% of detected lipid species.

Q: Can you integrate lipidomics data with other omics (transcriptomics, proteomics)?

Yes. Our multi-omics integration pipeline correlates lipid species abundance with gene expression (RNA-seq), protein abundance (TMT or DIA proteomics), and metabolite levels from the same biological system. We provide correlation networks, pathway-level concordance analysis, and mechanistic models linking enzyme expression to lipid product profiles.

Q: What is the typical turnaround time for a cellular lipidomics project?

Standard projects are completed within 4-6 weeks from sample receipt. Expedited timelines (2-3 weeks) are available for targeted quantification projects or smaller sample sets. The timeline includes lipid extraction, LC-MS/MS acquisition, data processing, bioinformatics analysis, and report generation.

Q: Do you offer customized lipid extraction protocols for specific cell types?

Yes. We optimize extraction protocols based on cell type, lipid classes of interest, and sample format. For example: organoids and 3D spheroids require modified Folch extraction with mechanical disruption; primary hepatocytes benefit from MTBE extraction for cleaner lipid profiles; and adipocytes require special handling for TAG-rich samples. We will work with you to select and validate the optimal protocol.

Q: How do you ensure reproducibility across replicate experiments?

Reproducibility is ensured through: (1) standardized cell culture and drug treatment protocols with documented conditions, (2) internal standard normalization for each sample, (3) pooled QC sample injection throughout the analytical run, (4) CV-based feature filtering (<30% in QC samples), (5) biological replicates (minimum 3, recommended 6), and (6) batch correction when samples are analyzed across multiple runs.

Q: Can you analyze lipids from 3D spheroid or organoid cultures?

Yes. We have validated protocols for 3D spheroid and organoid cultures, including tumor organoids, hepatocyte organoids, and intestinal organoids. The microextraction protocol is particularly well-suited for these sample types, as it requires minimal cell input while maintaining comprehensive lipid coverage. Please contact us to discuss your specific 3D culture model.

References

  1. Ramzy GM, Meister I, Rudaz S, Boccard J, Nowak-Sliwinska P. Identification of Lipid Species Signatures in FOLFOXIRI-Resistant Colorectal Cancer Cells. Int J Mol Sci. 2025;26(3):1169. doi:10.3390/ijms26031169. https://doi.org/10.3390/ijms26031169 (CC BY 4.0)
  2. Ni Z, Angelidou G, Lange M, Hoffmann N, Fedorova M. Guiding the choice of informatics software and tools for lipidomics research applications. Nat Methods. 2023;20(2):193-204. doi:10.1038/s41592-022-01710-0. https://doi.org/10.1038/s41592-022-01710-0
  3. Astarita G, Kelly RS, Lasky-Su J. Metabolomics and lipidomics strategies in modern drug discovery and development. Drug Discov Today. 2023;28(10):103751. doi:10.1016/j.drudis.2023.103751. https://doi.org/10.1016/j.drudis.2023.103751
  4. Kostidis S, Sánchez-López E, Giera M. Lipidomics analysis in drug discovery and development. Curr Opin Chem Biol. 2023;72:102256. doi:10.1016/j.cbpa.2022.102256. https://doi.org/10.1016/j.cbpa.2022.102256

Plan your cellular lipidomics drug profiling study with the MassTarget™ team

Tell us about your cell model, drug compound, and research questions — our scientists will design a tailored cellular lipidomics study for your drug discovery program.


For research use only. Not for use in diagnostic procedures. Creative Proteomics provides cellular lipidomics drug profiling services exclusively for research and development purposes. Results are not intended for clinical diagnosis or medical decision-making.

Online Inquiry

Please submit a detailed description of your project. We will provide you with a customized project plan to meet your research requests. You can also send emails directly to for inquiries.

* Email
Phone
* Service & Products of Interest
Services Required and Project Description