Organoid Metabolomics by LC-MS
Profiling drug-induced metabolic changes in 3D organoid models with validated low-input LC-MS workflows.
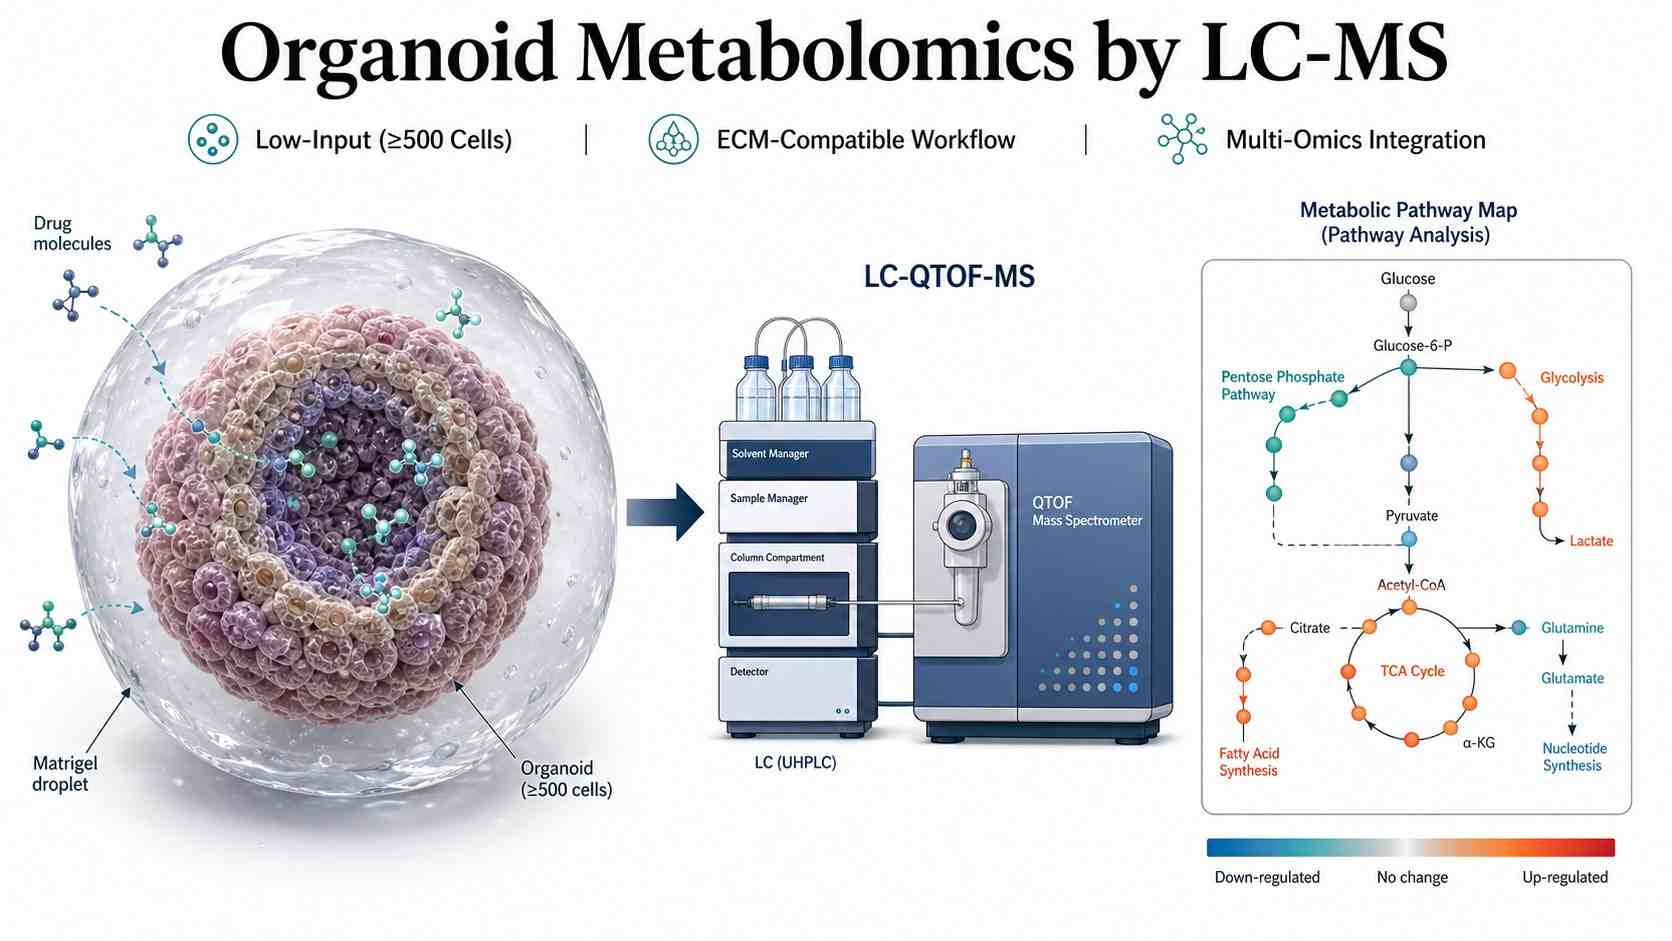
Organoid Metabolomics by LC-MS is a specialized service that combines 3D organoid culture with high-resolution LC-MS metabolomics and lipidomics to profile the metabolic state of patient-derived or stem cell-derived organoids. Unlike conventional 2D cell metabolomics, our service captures the full metabolic response of organoids to drug treatment, disease modeling, or genetic perturbation in a physiologically relevant, three-dimensional context that more faithfully recapitulates in vivo tissue architecture.
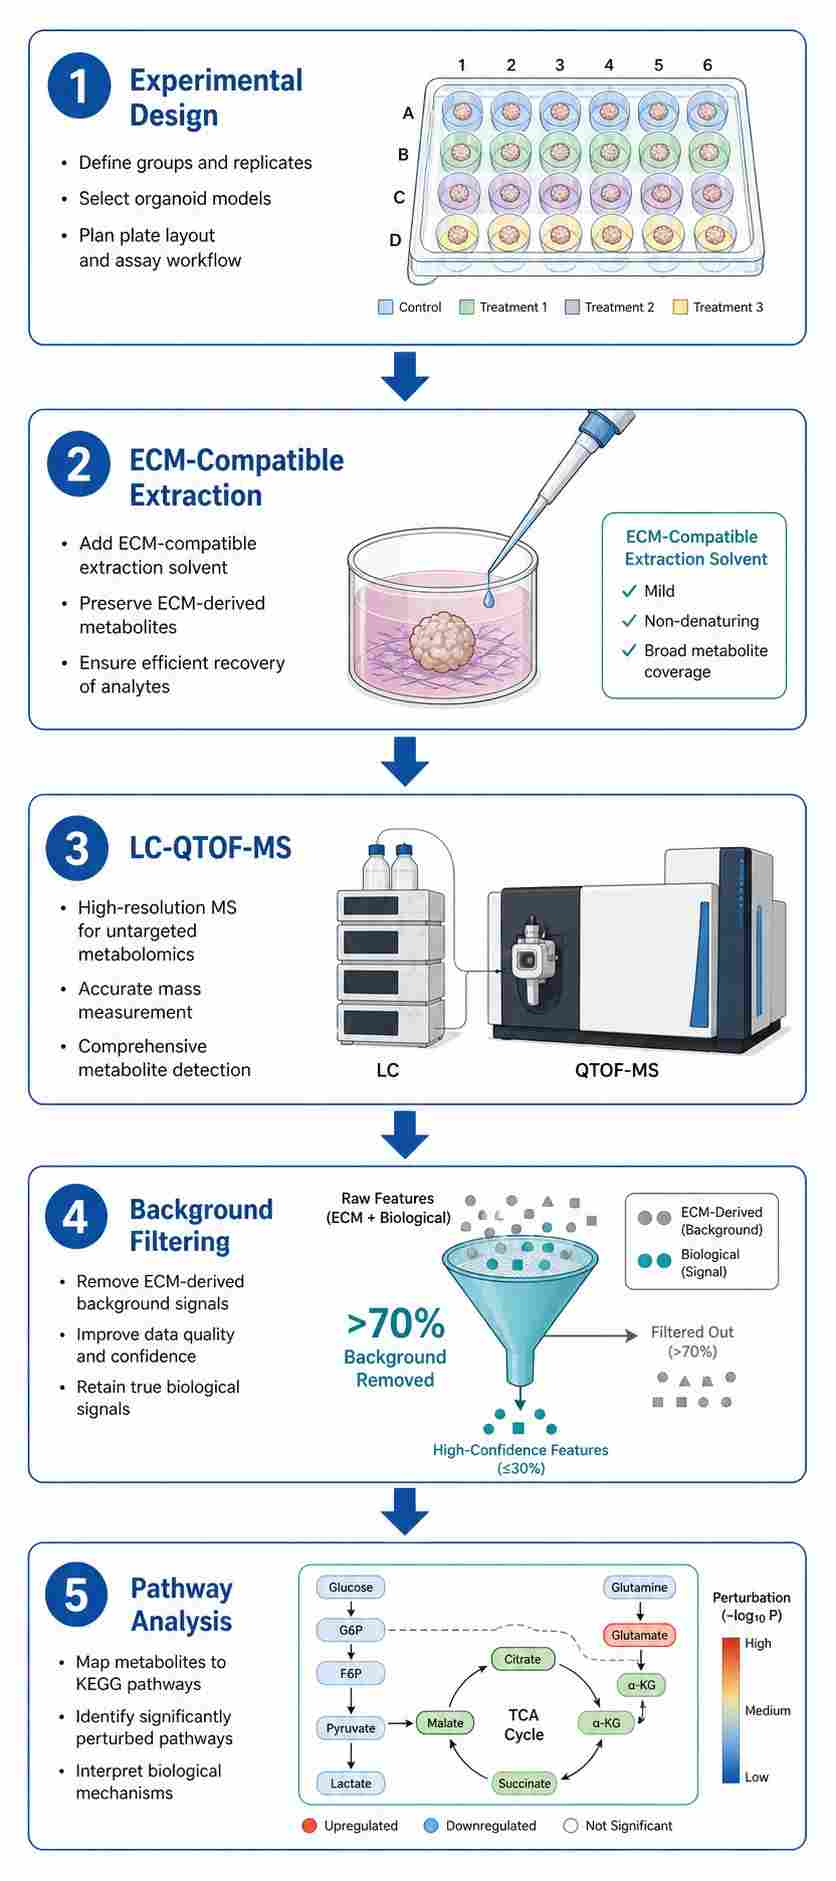
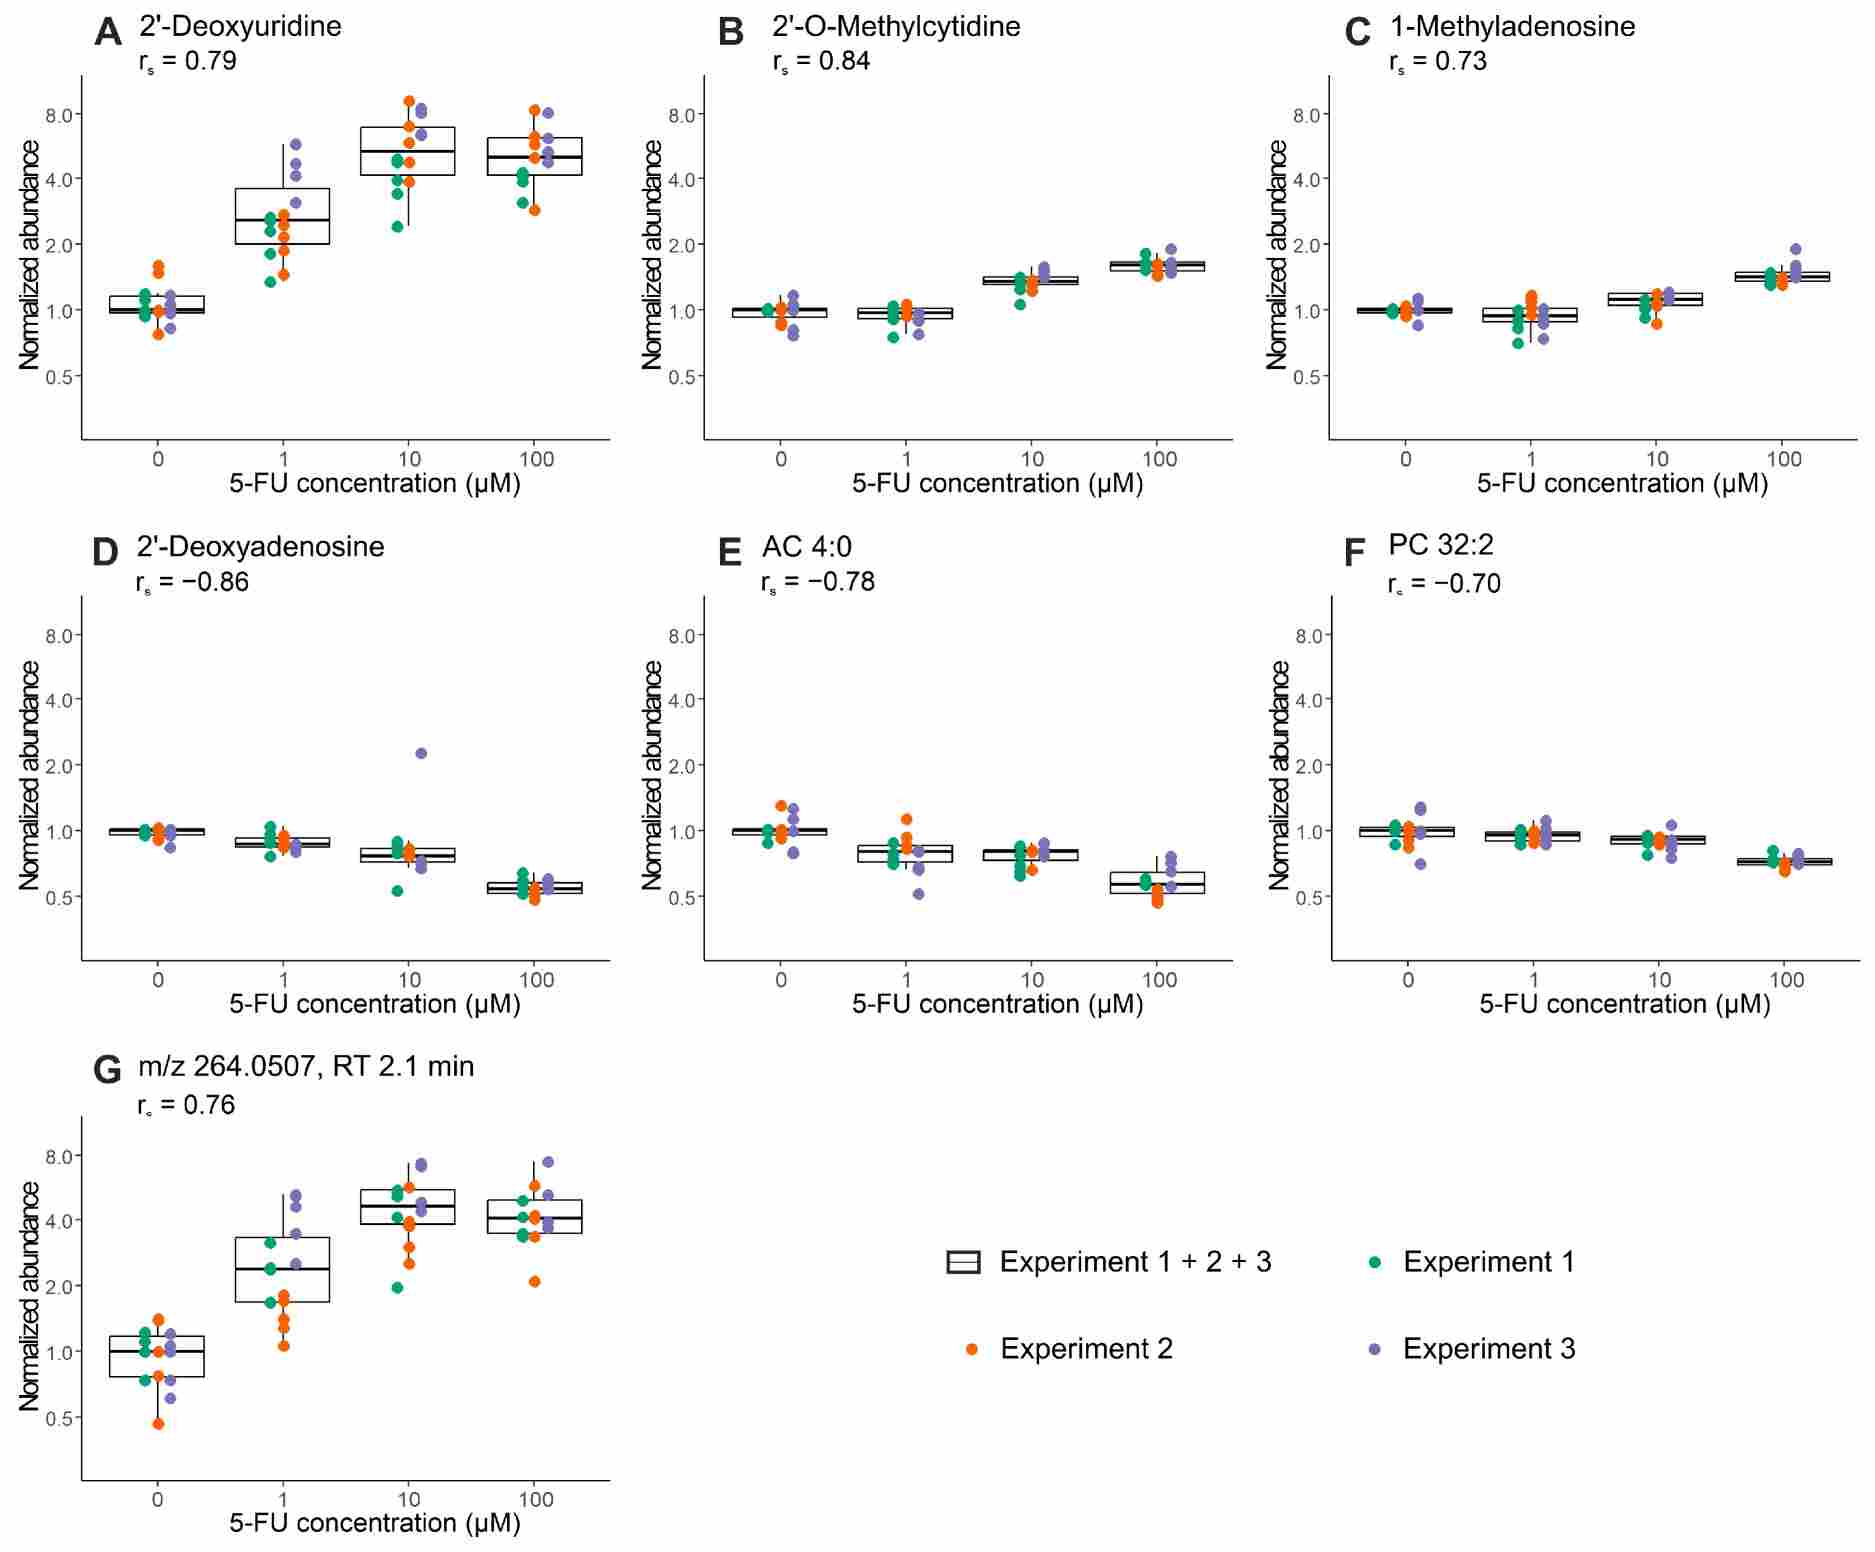
At Creative Proteomics, our MassTarget™ platform applies optimized, low-input LC-QTOF-MS workflows to organoid samples — including those embedded in extracellular matrix (ECM) — with validated protocols for background signal filtering and data quality control. Whether you are profiling drug-induced metabolic changes in patient-derived tumor organoids (PDOs), characterizing metabolic phenotypes in disease-model organoids, or integrating metabolomics with lipidomics and proteomics from the same 3D culture, our service delivers publication-ready data from as few as 500 cells per injection.
Key Capabilities:
- Low-input LC-QTOF-MS metabolomics and lipidomics from organoid samples (≥500 cells per injection).
- ECM-compatible sample preparation with validated background filtering protocol (p-value + fold-change threshold).
- Untargeted metabolomics covering polar metabolites, amino acids, nucleotides, and central carbon metabolites.
- Untargeted lipidomics covering phospholipids, sphingolipids, glycerolipids, and fatty acids.
- Comprehensive pathway enrichment analysis with KEGG and HMDB mapping.
- Flexible service model: accepts pre-cultured organoids or provides culture guidance.