Enzyme Kinetics via Continuous-Flow MS

Real-time, label-free kinetic profiling — native substrates, microgram-scale enzyme, full parameter determination in hours, not days.

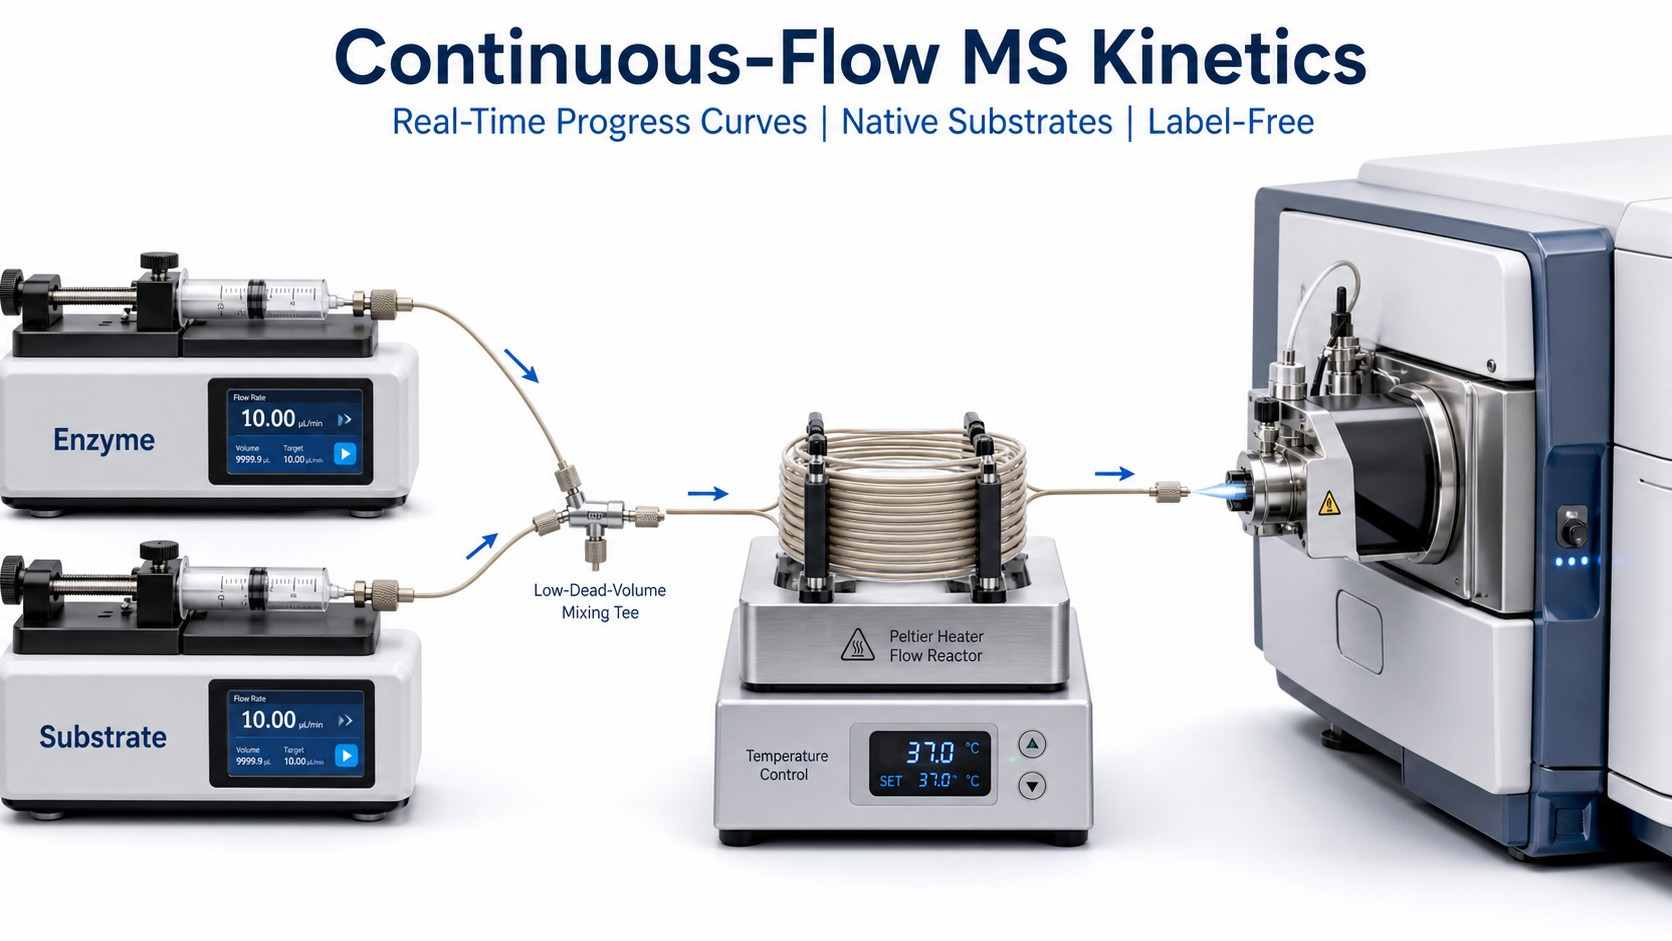
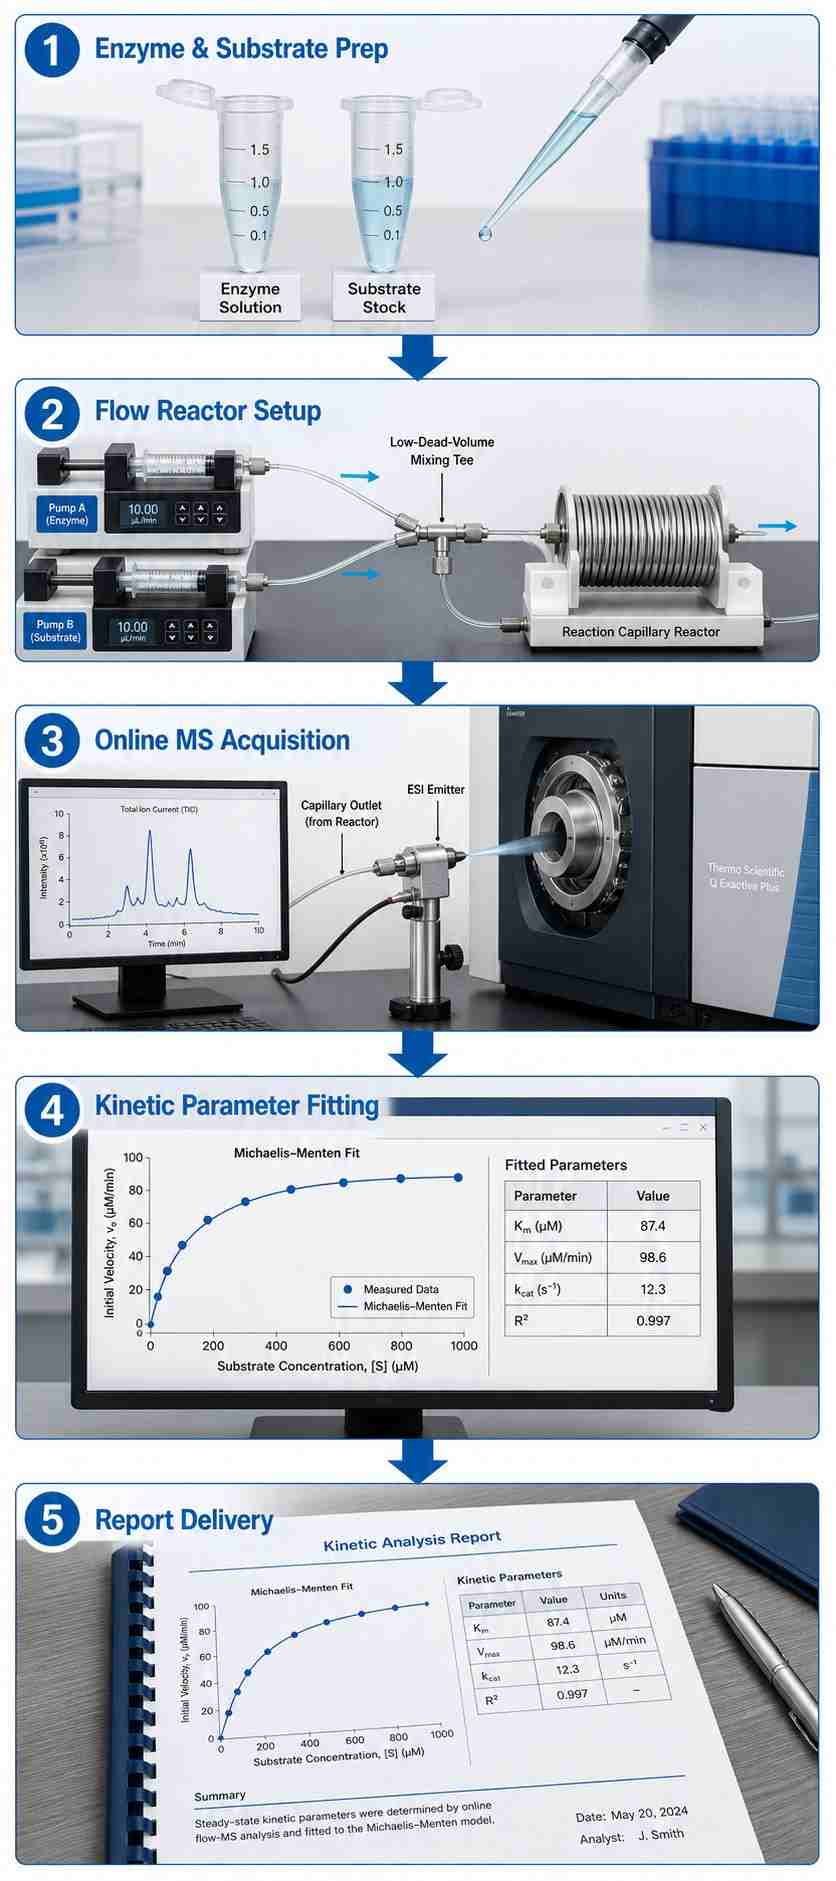
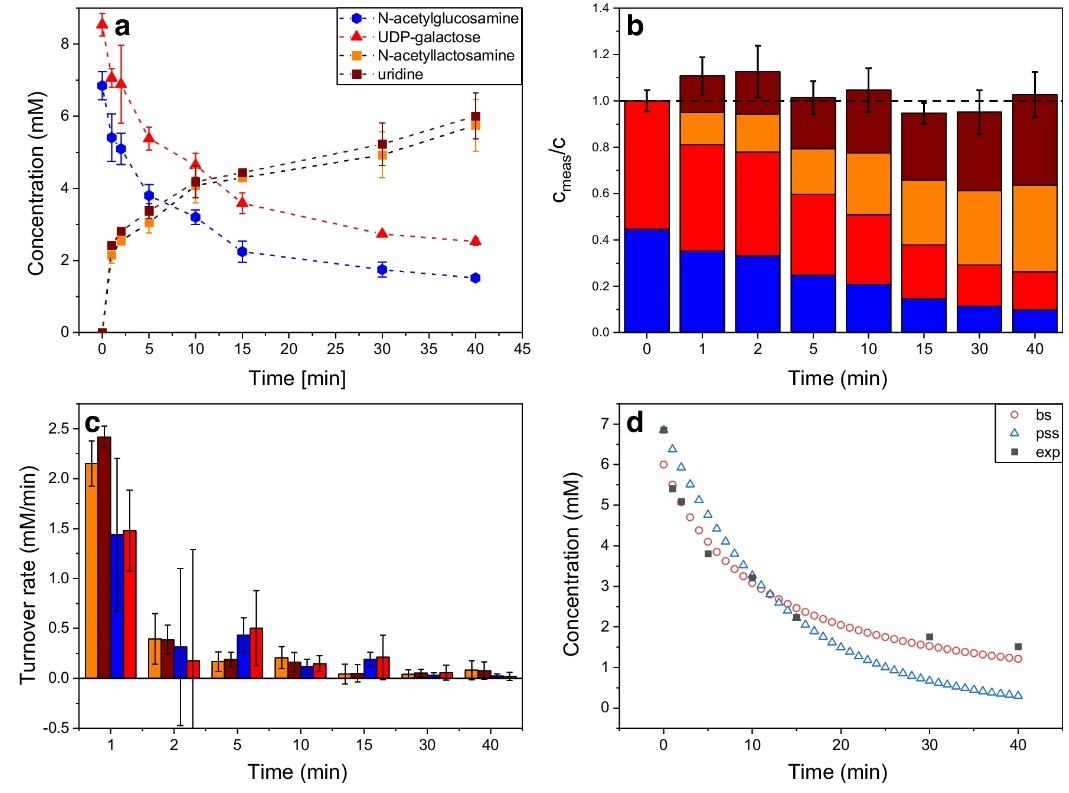
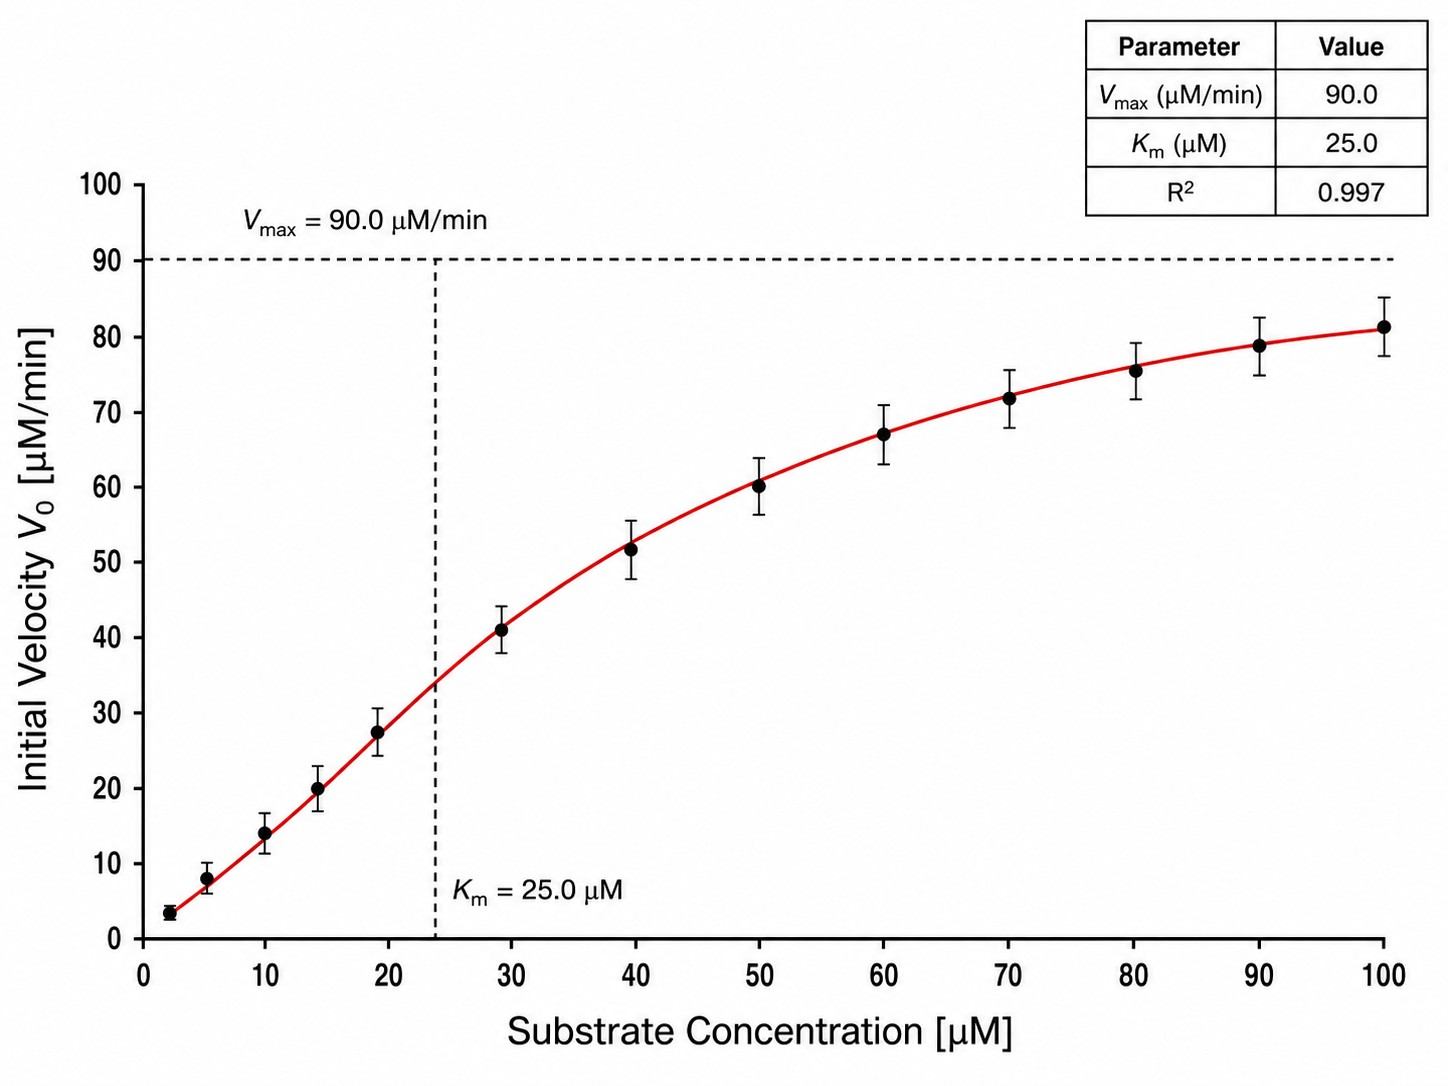
Continuous-flow mass spectrometry (CF-MS) kinetics directly couples a microfluidic flow reactor to a high-resolution mass spectrometer, capturing enzyme progress curves in continuous real time from native substrates. Unlike plate-reader fluorescence assays, there is no labeling requirement. Unlike discrete LC-MS, there is no fraction collection. The result: a direct, continuous readout of substrate consumption and product formation from which Km, Vmax, kcat, IC50, and Ki are determined in a single experiment.

At Creative Proteomics, our MassTarget™ CF-MS Kinetics platform integrates precision syringe pumps, temperature-controlled flow reactors, and high-resolution QToF mass spectrometry into a standardized service workflow covering kinases, P450s, proteases, transferases, hydrolases, and other enzyme classes.

Core Capabilities:

  • Real-time progress curves — continuous ion intensity traces, not end-point snapshots
  • Native substrates — any ionizable substrate, no fluorophore or chromophore required
  • Microgram-scale consumption — 0.1–10 µg per Km curve
  • Full kinetic parameters — Km, Vmax, kcat, IC50, Ki (competitive/non-competitive/mixed)
  • Rapid deployment — no assay development if substrate/product are MS-detectable
Continuous-flow MS kinetics platform showing syringe pumps, flow reactor, and mass spectrometer for real-time enzyme kinetic analysis.
What Is CF-MS Kinetics The Real-Time Advantage Enzyme Classes Workflow Case Study Method Comparison Sample FAQ

What Is Continuous-Flow MS Kinetics?

Continuous-flow mass spectrometry (CF-MS) kinetics is an analytical technique that interfaces a microfluidic flow reactor directly with an electrospray ionization mass spectrometer. Enzyme and substrate solutions are delivered at controlled flow rates via precision syringe pumps, mixed in a low-dead-volume tee junction, and passed through a temperature-controlled reaction capillary where catalysis proceeds. The reaction mixture is continuously infused into the MS source, generating a real-time ion intensity trace that directly reports on substrate consumption and product formation.

This technique is fundamentally different from two common alternatives:

  • vs. plate-reader fluorescence assays — CF-MS uses native substrates, not fluorogenic analogues. There is no risk that the fluorophore alters substrate binding or turnover.
  • vs. discrete LC-MS — CF-MS provides continuous time-course data without fraction collection, enabling detection of non-linear kinetics, product inhibition, and pre-steady-state phenomena.

The approach is well established in the literature. Lin, Tu, and Urban (J Am Soc Mass Spectrom, 2023) demonstrated continuous-flow online MS for kinetic profiling of both homogeneous and heterogeneous biocatalysts, reporting Km values for four penicillin substrates with microgram-scale enzyme consumption. Our platform translates this methodology into a standardized, quality-controlled service.

The Real-Time Advantage: Progress Curves vs. End-Points

The fundamental difference between CF-MS kinetics and conventional methods lies in what you see — and when.

Continuous Progress Curves

CF-MS captures substrate and product ion intensities at sub-second intervals throughout the reaction. This reveals curvature in the progress curve caused by product inhibition, substrate depletion, or enzyme instability — information invisible to single end-point measurements.

Early Linear Rate Detection

The high temporal resolution of CF-MS allows confident identification of the initial linear phase of the reaction, ensuring that calculated initial velocities (V0) reflect true steady-state kinetics rather than rate decay.

Multi-Angle Parameter Fitting

With continuous time-course data from multiple substrate concentrations, we can fit Michaelis-Menten, substrate inhibition, or substrate activation models and report model selection criteria — not just a single Km value.

Inhibition Mode Determination

Full progress curves at multiple inhibitor concentrations enable unambiguous differentiation of competitive, non-competitive, uncompetitive, and mixed inhibition — using globally fitted models with 95% confidence intervals.

Enzyme Classes We Support

Our CF-MS kinetics platform has been validated across major enzyme classes relevant to drug discovery. If the substrate and product are ionizable by ESI-MS, we can develop a kinetic assay.

Kinases

ATP and peptide substrate Km determination, inhibitor IC50/Ki profiling, selectivity panel screening. Direct detection of phosphopeptide product without radioactive ATP or phospho-antibodies. Our kinase MS activity assays cover serine/threonine and tyrosine kinase families.

Cytochrome P450s

Substrate affinity (Km), maximum turnover rate (Vmax), and metabolic stability for CYP isoforms 1A2, 2C9, 2C19, 2D6, 3A4, and others. Simultaneous monitoring of NADPH consumption and metabolite formation. Complements our CYP450 inhibition panel.

Proteases

Peptide substrate cleavage monitoring with real-time tracking of both substrate depletion and product fragment formation. Determination of kcat/Km specificity constants. Our protease MS substrate assays cover serine, cysteine, aspartyl, and metalloprotease classes.

Transferases & Hydrolases

Glycosyltransferases, methyltransferases, acetyltransferases, glucuronosyltransferases, esterases, phosphatases, and epoxide hydrolases — all using native substrates. Coupled assays with auxiliary enzymes are supported. Our enzyme activity and mechanism studies provide broader characterization.

How Continuous-Flow MS Kinetics Works

Five steps, from sample to kinetic parameter report.

1

Enzyme & Substrate Preparation

Purified enzyme and substrate in MS-compatible buffer. Typical usage: 0.1–10 µg enzyme per curve. Substrate concentrations spanning 0.2–5× estimated Km (minimum 6 concentrations).

2

Flow Reactor Setup

Syringe pumps deliver enzyme and substrate streams into a low-dead-volume mixing tee. The combined stream passes through a temperature-controlled reaction capillary (10–100 µL) at 5–50 µL/min, defining the residence time.

3

Online MS Acquisition

The reaction stream enters the ESI source directly. Full-scan mass spectra are acquired continuously. Extracted ion chromatograms for substrate and product are generated in real time.

4

Kinetic Parameter Fitting

Steady-state initial velocities are calculated and fitted to Michaelis-Menten, substrate inhibition, or activation models. Km, Vmax, and kcat are reported with 95% confidence intervals. For inhibition studies, IC50 and Ki are determined by global fitting.

5

Report Delivery

Complete kinetic report: raw ion traces, fitted Michaelis-Menten plot, parameter table, model selection criteria, and quality metrics. Optional: progress curve analysis, substrate inhibition model fitting.

Continuous-flow MS kinetics workflow diagram showing five steps from enzyme preparation to data report.

Case Study: FIA-MS for Real-Time Glycosyltransferase Kinetics

Thiele U, Crocoll C, Tschöpe A, Drayß C, Kirschhöfer F, Nusser M, Brenner-Weiß G, Franzreb M, Bleher K. "Efficient derivatization-free monitoring of glycosyltransferase reactions via flow injection analysis-mass spectrometry for rapid sugar analytics." Analytical and Bioanalytical Chemistry 416:5191-5203 (2024). https://doi.org/10.1007/s00216-024-05457-9

Background

Glycosyltransferase enzymes catalyze the transfer of sugar moieties to acceptor molecules, but their kinetic characterization is hampered by the lack of chromogenic or fluorogenic substrates for many transferase reactions. The authors aimed to develop a rapid, derivatization-free method using flow injection analysis-electrospray ionization-mass spectrometry (FIA-ESI-MS) for real-time monitoring of β-1,4-galactosyltransferase (β1,4GalT1) reactions.

Methods

The reaction system contained 5 mM GlcNAc (acceptor), 6.2 mM UDP-Gal (donor), and 20 U β1,4GalT1 in 100 mM HEPES buffer (pH 7.5, 30 °C). Aliquots (5 µL) were collected at 2, 5, 10, 15, and 30 min, heat-quenched (70 °C, 5 min), diluted 1:50,000, and analyzed by FIA-ESI-MS on a TripleTOF 6600+ system. Substrate consumption (GlcNAc, UDP-Gal) and product formation (LacNAc, uridine) were quantified using internal standard calibration (d-glucose-1-¹³C) in negative ion mode.

Results

The FIA-MS method achieved complete time-course profiling of all four analytes in a single experiment. After 40 min, GlcNAc consumption reached 5.11 ± 0.06 mM and UDP-Gal consumption reached 6.02 ± 0.10 mM, with LacNAc production of 5.75 ± 0.71 mM and uridine production of 6.00 ± 0.63 mM (Fig. 5a–5b). Mass balance was conserved within experimental error. Kinetic simulation using a ternary complex (bi-substrate) mechanism gave superior fits compared to a pseudo-single-substrate model, yielding a catalytic efficiency kcat/K'M ≈ 6400 s⁻¹M⁻¹ (Fig. 5d). FIA-MS results showed no significant difference from HILIC-UHPLC-MS reference data (p > 0.4, paired t-test), while requiring only 1–2 min per analysis versus ~10 min for the chromatographic method.

Conclusions

The study demonstrated that FIA-ESI-MS is a rapid, accurate, and derivatization-free approach for glycosyltransferase kinetic characterization, compatible with high-salt reaction buffers and complex matrices. The method is directly transferable to other enzyme classes where native substrate monitoring is required, and its throughput advantage over LC-MS-based methods makes it suitable for medium-throughput kinetic screening in drug discovery.

FIA-ESI-MS time-course data for β-1,4-galactosyltransferase reaction showing substrate consumption and product formation (Fig. 5 from Thiele et al. 2024).

Fig. 5 from Thiele et al. (2024): Time-course of β1,4GalT1 reaction monitored by FIA-ESI-MS. (a) Substrate and product concentrations over time. (b) Normalized mass balance. (c) Conversion rates. (d) Kinetic simulation.

CF-MS Kinetics vs. Alternative Kinetic Assay Methods

ParameterCF-MS KineticsPlate-Reader FluorescenceStopped-FlowDiscrete LC-MS
Data typeContinuous ion traceEnd-point or kinetic readShort time-window kineticDiscrete time points
SubstrateAny ionizable (native)Fluorogenic onlyLimited setAny ionizable
Enzyme/curve0.1–10 µg1–50 µg10–100 µg10–100 µg
Time per condition10–20 min (real-time)5–30 min (plate read)30–60 min (setup + data)10–30 min (LC run)
Nonlinear kinetics detected?Yes — continuous traceNo — unless sampled denselyPartially — short windowYes — if time points are dense
Interference riskLow — mass-resolvedMedium — matrix autofluorescenceLowLow — LC separation

For complementary approaches, we also offer RapidFire MS for high-throughput end-point screening and DESI plate-based HTS for ultra-rapid label-free readouts, each serving different stages of the drug discovery pipeline.

Sample Requirements

Sample TypeRequired AmountConcentrationBufferNotes
Enzyme (purified)10–100 µg total0.1–10 µM stock≤50 mM ammonium acetate/bicarbonateProvide sequence, purity, storage conditions
Substrate100–500 µL per condition0.1–5 mM stock≤5% DMSO if neededExact mass required; solubility data preferred
Inhibitor (optional)50 µL per concentration0.1 nM–100 µMDMSO or MS-compatible buffer10-point serial dilution recommended
CofactorsAs requiredAs requiredAssay-dependente.g., NADPH for CYP450, ATP/Mg for kinases

General Guidelines:

  • Buffer exchange to MS-compatible conditions before submission (we can assist)
  • Minimum 6 substrate concentrations spanning 0.2–5× estimated Km
  • Controls: no-enzyme blank, no-substrate blank, known inhibitor positive control
  • Typical assay volume: 50–200 µL per condition

Deliverables

  • Raw extracted ion chromatograms (substrate + product traces at each concentration)
  • Steady-state initial velocity vs. substrate concentration plot (Michaelis-Menten)
  • Fitted parameters: Km, Vmax, kcat with 95% confidence intervals
  • IC50 curve and Ki value with inhibition mode assignment (if inhibitor tested)
  • Quality metrics: initial-rate linearity R², fit residual analysis
  • Optional: progress curve analysis, substrate inhibition model fitting

Representative Kinetic Data

Representative Michaelis-Menten plot showing initial velocity versus substrate concentration with fitted Km and Vmax from continuous-flow MS kinetic data.

Michaelis-Menten kinetic plot from continuous-flow MS data

FAQ

Frequently Asked Questions

Q: What is continuous-flow MS kinetics and when should I use it instead of a plate-reader assay?

CF-MS kinetics is the method of choice when (1) no fluorogenic substrate is available for your enzyme, (2) you need continuous progress curves to detect non-linear kinetics or product inhibition, or (3) you want to use native substrates for physiologically relevant measurements. It is complementary to plate-reader assays, not a replacement — each serves different stages of the discovery pipeline.

Q: Which kinetic parameters can I obtain?

From a single Michaelis-Menten experiment we determine Km, Vmax, and kcat. If inhibitor is included, we determine IC50 and Ki with full inhibition mode classification (competitive, non-competitive, uncompetitive, or mixed). Additional capabilities include substrate inhibition model fitting and progress curve analysis.

Q: How much enzyme is required?

A full Michaelis-Menten determination (8 substrate concentrations × duplicate) typically requires 2–50 µg of purified enzyme total. Single-curve experiments can be performed with as little as 0.1–10 µg, depending on turnover number.

Q: Can you handle enzymes that require specific buffer conditions (glycerol, detergents, high salt)?

Yes. We can perform buffer exchange prior to analysis, including glycerol removal, desalting, and detergent replacement with MS-compatible alternatives. We will confirm enzyme stability under exchange conditions before proceeding.

Q: What throughput can I expect?

4–8 substrate concentration conditions per hour. A complete Michaelis-Menten determination (8 points + controls) can be completed in 2–3 hours. IC50 determination (10 inhibitor concentrations) in 3–4 hours. For higher throughput needs, we recommend our RapidFire MS platform.

References

  1. Thiele U, Crocoll C, Tschöpe A, Drayß C, Kirschhöfer F, Nusser M, Brenner-Weiß G, Franzreb M, Bleher K. Efficient derivatization-free monitoring of glycosyltransferase reactions via flow injection analysis-mass spectrometry for rapid sugar analytics. Anal Bioanal Chem. 2024;416:5191-5203. doi:10.1007/s00216-024-05457-9. https://doi.org/10.1007/s00216-024-05457-9
  2. Lin YH, Tu WC, Urban PL. Kinetic profiling of homogeneous and heterogeneous biocatalysts in continuous flow by online mass spectrometry. J Am Soc Mass Spectrom. 2023;34(1):109-118. doi:10.1021/jasms.2c00283. https://doi.org/10.1021/jasms.2c00283
  3. Berger SA, Grimm C, Nyenhuis J, et al. Rapid, label-free screening of diverse biotransformations by flow-injection mass spectrometry. ChemBioChem. 2023;24(11):e202300170. doi:10.1002/cbic.202300170. https://doi.org/10.1002/cbic.202300170
  4. Prudent R, Annis DA, Dandliker PJ, et al. Exploring new targets and chemical space with affinity selection-mass spectrometry. Nat Rev Chem. 2021;5:62-71. doi:10.1038/s41570-020-00229-2. https://www.nature.com/articles/s41570-020-00229-2

Plan a kinetic study with the MassTarget™ team

Share your enzyme target, substrate, and research questions — our scientists will design a tailored continuous-flow MS kinetic strategy for your discovery program.


For research use only. Not for use in diagnostic procedures. Creative Proteomics provides continuous-flow MS kinetics services exclusively for research and development purposes. Results are not intended for clinical diagnosis or medical decision-making.

Online Inquiry

Please submit a detailed description of your project. We will provide you with a customized project plan to meet your research requests. You can also send emails directly to for inquiries.

* Email
Phone
* Service & Products of Interest
Services Required and Project Description