Cellular Metabolomics Screening

Label-free, comprehensive profiling of drug-induced metabolic perturbations in living cells — untargeted discovery and targeted absolute quantification by mass spectrometry.

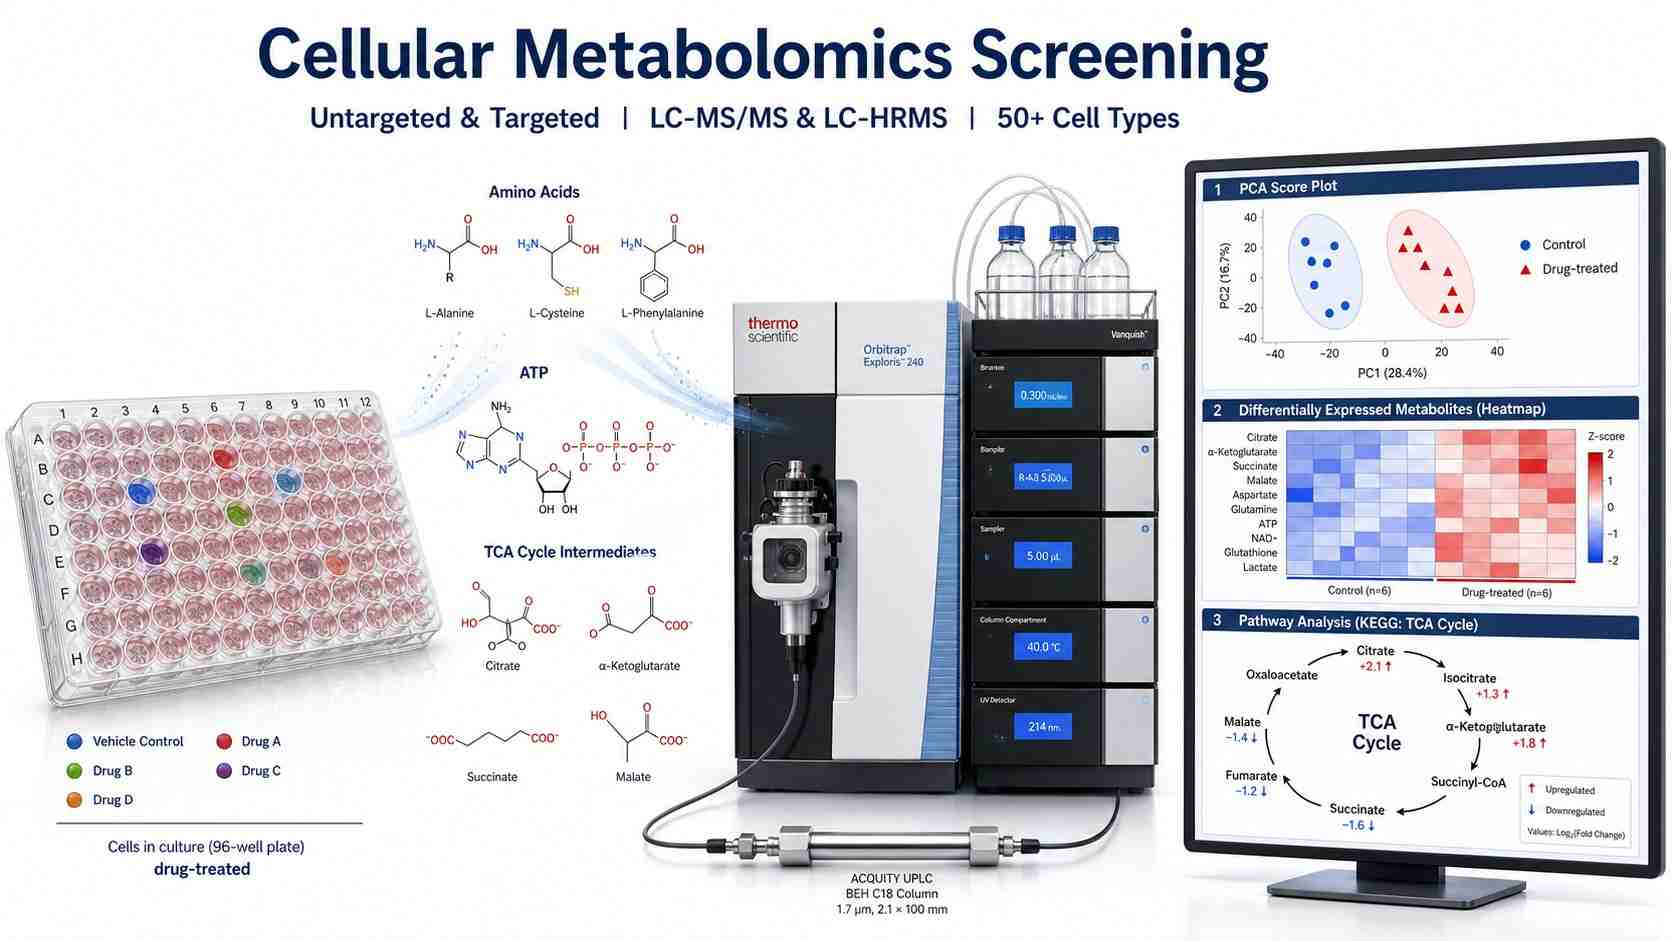
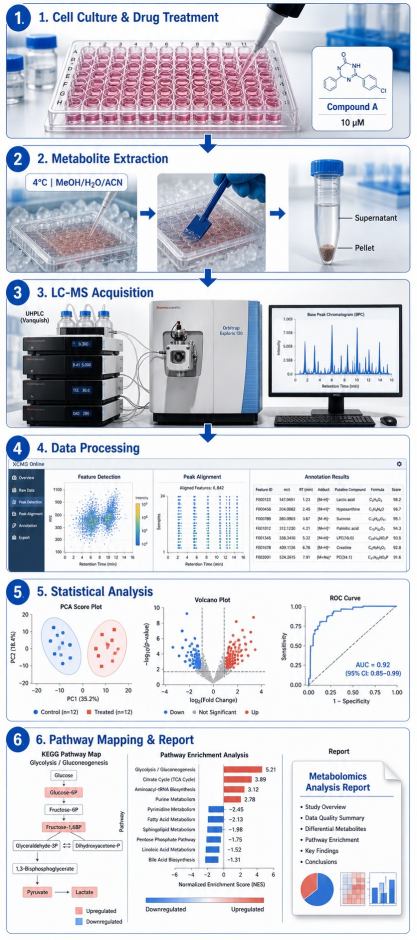
Cellular metabolomics screening by mass spectrometry captures the global metabolic state of living cells in response to drug treatment. Unlike endpoint biochemical assays that measure a single enzyme activity or reporter signal, cellular metabolomics simultaneously quantifies hundreds to thousands of intracellular metabolites — amino acids, organic acids, nucleotides, sugars, central carbon cycle intermediates, and signaling lipids — providing a systems-level view of drug-induced metabolic perturbations.

This approach is increasingly adopted in early-stage drug discovery for mechanism-of-action (MOA) elucidation, on-target vs off-target metabolic effect profiling, metabolic biomarker discovery, and drug resistance characterization. By measuring the actual metabolic endpoints of drug activity in a physiologically relevant cell context, cellular metabolomics bridges the gap between biochemical target engagement data and phenotypic outcomes.

Key Capabilities:

  • Untargeted and targeted metabolomics workflows on a single platform
  • 50+ validated cell types including adherent, suspension, primary, spheroids, and organoids
  • Absolute quantification with stable isotope-labeled internal standards
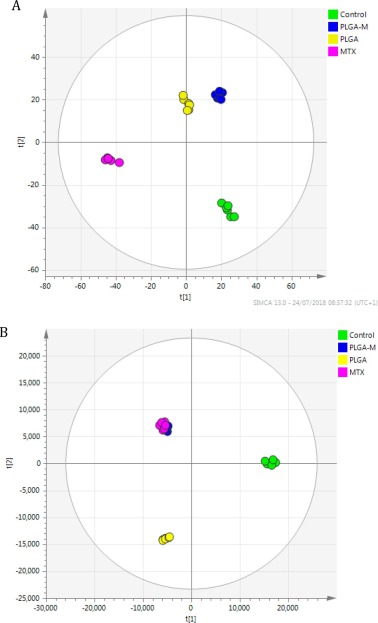
  • PCA/PLS-DA/OPLS-DA multivariate analysis + KEGG pathway mapping
  • Dedicated project management from cell culture to final report
Cellular metabolomics screening platform overview showing cell culture plate, mass spectrometer, metabolite structures, and data visualization overlay for drug-induced metabolic perturbation profiling.
Overview Workflow Service Portfolio Technical Advantages Case Study Sample Requirements FAQ

Overview of Cellular Metabolomics Screening by Mass Spectrometry

Cellular metabolomics screening is a mass spectrometry-based analytical strategy that captures the global metabolic state of living cells in response to drug treatment. Unlike endpoint biochemical assays that measure a single enzyme activity or reporter signal, cellular metabolomics simultaneously quantifies hundreds to thousands of intracellular metabolites — amino acids, organic acids, nucleotides, sugars, central carbon cycle intermediates, and signaling lipids — providing a systems-level view of drug-induced metabolic perturbations.

This approach is increasingly adopted in early-stage drug discovery for mechanism-of-action (MOA) elucidation, on-target vs off-target metabolic effect profiling, metabolic biomarker discovery, and drug resistance characterization. By measuring the actual metabolic endpoints of drug activity in a physiologically relevant cell context, cellular metabolomics bridges the gap between biochemical target engagement data and phenotypic outcomes.

Our platform supports a broad range of cell models, including adherent and suspension cell lines, primary cells, 3D spheroids, and organoids — over 50 validated cell types across cancer, metabolic disease, immunology, and neuroscience research areas. For a comprehensive overview of our cell-based MS drug screening capabilities, visit our cell-based MS drug screening hub page.

Our Cellular Metabolomics Screening Workflow

A standardized, quality-controlled process from cell culture to final report. Each project is tailored to your specific cell model, drug compound, and research question.

1

Cell Culture and Drug Treatment

Cells are cultured under standardized conditions (controlled passage number, mycoplasma-free verification, defined media composition) and treated with test compounds at specified concentrations and time points. We optimize treatment conditions in consultation with your team to ensure physiological relevance.

2

Metabolite Extraction and Sample Preparation

Following drug treatment, cells are rapidly washed with ice-cold PBS, then quenched and extracted using optimized solvent systems (methanol/water/acetonitrile or methanol/chloroform/water for polar and lipid fractions). All steps performed at 4°C to minimize metabolic turnover. Microextraction protocols validated for as few as 5×10⁵ cells.

3

LC-MS/MS or LC-HRMS Acquisition

Extracted metabolites are analyzed on high-resolution Orbitrap or Q-TOF mass spectrometers coupled to UHPLC systems. Untargeted profiling: full-scan mode (70–1200 m/z) with data-dependent MS/MS. Targeted quantification: triple quadrupole MS with MRM and stable isotope-labeled internal standards. Pooled QC samples injected every 8–10 runs.

4

Raw Data Processing and Feature Detection

Raw MS data processed using XCMS, Compound Discoverer, or Progenesis QI for peak picking, retention time alignment, feature filtering, and missing value imputation. Features annotated against HMDB, METLIN, KEGG, LipidMaps, and in-house spectral libraries.

5

Statistical Analysis and Biological Interpretation

Tiered statistical approach: univariate analysis (t-test, ANOVA, fold-change, FDR correction) for individual metabolite significance, followed by multivariate analysis (PCA, PLS-DA, OPLS-DA) to identify metabolic signatures that discriminate treatment groups. Biomarker candidates evaluated by ROC curve analysis.

6

Pathway Mapping and Report Delivery

Significantly altered metabolites mapped onto KEGG, HMDB, and Reactome pathways. Pathway enrichment analysis (Fisher's exact test, hypergeometric test) and pathway impact scores highlight the most biologically relevant changes. Final report includes raw data tables, PCA/PLS-DA score plots, heatmaps, pathway enrichment bar charts, and comprehensive biological interpretation. Typical turnaround: 4–6 weeks from sample receipt.

Cellular metabolomics screening workflow diagram showing six steps from cell culture and drug treatment through metabolite extraction, LC-MS acquisition, data processing, statistical analysis, and pathway mapping report delivery.

Service Portfolio — Untargeted and Targeted Metabolomics

We offer two complementary cellular metabolomics workflows to match your research question, from discovery-phase global profiling to hypothesis-driven absolute quantification.

Untargeted Cellular Metabolomics (Global Profiling)

Unbiased, global profiling of all detectable intracellular metabolites. Ideal for discovery-phase studies where the metabolic effects of a drug are unknown — MOA elucidation for phenotypic screening hits, characterization of novel compounds, and identification of unexpected metabolic vulnerabilities. Using high-resolution LC-MS (Orbitrap/Q-TOF), we routinely detect 2,000–5,000 metabolic features, of which 300–800 are confidently annotated. Data-dependent MS/MS acquisition enables structural elucidation of unknown features.

Targeted Cellular Metabolomics (Absolute Quantification)

Precise, absolute quantification of predefined metabolite panels using triple quadrupole MS with MRM acquisition and stable isotope-labeled internal standards. Ideal for hypothesis-driven studies — validation of metabolic enzyme targets, dose-response metabolic profiling, and biomarker verification. Our targeted panels cover amino acids and derivatives (20 proteinogenic + 30+ modified), organic acids (TCA cycle intermediates, short-chain fatty acids), nucleotides and nucleosides (ATP/ADP/AMP, NAD+/NADH, GTP/GDP), central carbon metabolism intermediates (glycolysis, pentose phosphate pathway), and signaling metabolites (polyamines, neurotransmitters, oncometabolites).

For cellular lipidomics profiling, see our dedicated cellular lipidomics drug profiling service page. For pathway-specific analysis, explore our metabolic pathway drug-response mapping service.

Key Technical Advantages

Cellular metabolomics by mass spectrometry offers fundamental advantages over conventional cell-based assay formats. The comparison table below highlights the key differences.

ParameterCellular Metabolomics MSFluorescence-based Cell AssaysELISA-based Metabolite Kits
Label requirementLabel-freeRequires fluorescent probes/dyesRequires enzyme-conjugated antibodies
Multiplexing100–5,000 metabolites per run1–4 targets per well1 target per well
Metabolite coverageBroad (amino acids, lipids, nucleotides, organic acids, sugars)Limited to probe-designated targetsLimited to antibody-validated targets
Quantification typeRelative (untargeted) or absolute (targeted with ISTD)Relative fluorescence unitsAbsolute (standard curve)
Cell model compatibilityAdherent, suspension, primary, spheroids, organoidsLimited to adherent or suspensionRequires lysate, compatible with most cell types
Throughput96-well plate format, 10–15 min/sample LC-MS run96/384-well, real-time reading96-well, 4–6 h assay time
Cost per sampleModerate (instrument time + consumables)Low (reagents only)High (kit cost per target)
Data dimensionalityFull metabolic profile + pathway contextSingle endpointSingle endpoint

Case Study: LC-MS Metabolomics of Cancer Cell and Macrophage Responses to Methotrexate

Al-Natour MA, Alazzo A, Ghaemmaghami AM, Kim DH, Alexander C. "LC-MS metabolomics comparisons of cancer cell and macrophage responses to methotrexate and polymer-encapsulated methotrexate." International Journal of Pharmaceutics: X 2019;1:100036. https://doi.org/10.1016/j.ijpx.2019.100036

Background

Methotrexate (MTX) is a widely used chemotherapeutic and immunosuppressive agent that inhibits dihydrofolate reductase (DHFR), disrupting nucleotide synthesis. However, the full metabolic impact of MTX on different cell types — and how polymer encapsulation alters this impact — was not well characterized. This study applied untargeted LC-MS metabolomics to compare the metabolic responses of A549 lung cancer cells and THP-1 macrophages to free MTX versus polymer-encapsulated MTX (pMTX).

Methods

A549 and THP-1 cells were treated with free MTX or pMTX at equimolar concentrations for 24 h. Intracellular metabolites were extracted using methanol/water and analyzed by UHPLC-Q-TOF-MS in positive and negative ionization modes. Data were processed using XCMS for feature detection and alignment, followed by multivariate analysis (PCA, OPLS-DA) and pathway enrichment (MetaboAnalyst).

Results

OPLS-DA score plots revealed clear metabolic separation between MTX-treated and untreated control cells in both A549 and THP-1 lines, with pMTX showing a distinct metabolic profile compared to free MTX. A total of 87 significantly altered metabolites were identified (VIP > 1.0, p < 0.05), including perturbations in amino acid metabolism (glutamine, aspartate, serine), nucleotide metabolism (purine and pyrimidine intermediates), and the TCA cycle. Notably, pMTX induced a more pronounced metabolic perturbation in THP-1 macrophages compared to free MTX, suggesting altered cellular uptake or intracellular drug release kinetics.

Conclusions

Untargeted LC-MS metabolomics successfully distinguished the metabolic signatures of free MTX versus pMTX in both cancer cells and immune cells, revealing cell-type-specific metabolic responses that would not be captured by conventional cytotoxicity assays alone. This study demonstrates the value of cellular metabolomics screening for characterizing drug delivery systems and understanding cell-type-specific pharmacodynamics.

OPLS-DA score plots showing metabolic separation between methotrexate-treated and control A549 and THP-1 cells, with significantly altered metabolites in amino acid and nucleotide metabolism pathways (adapted from Al-Natour et al. 2019, International Journal of Pharmaceutics: X).

Adapted from Al-Natour et al. (2019): OPLS-DA score plots showing clear metabolic separation between drug-treated and control groups in A549 cancer cells and THP-1 macrophages treated with free methotrexate and polymer-encapsulated methotrexate.

Sample Requirements for Cellular Metabolomics Screening

Our protocols are optimized for a wide range of cell culture formats. The table below provides recommended starting conditions for common cell types.

Cell TypeCulture FormatSeeding DensityTreatment DurationMin Cells/SampleReplicates
Adherent cell lines96-well plate1×10⁴ cells/well24–72 h5×10⁵3–5
Suspension cells96-well plate2×10⁴ cells/well6–48 h1×10⁶3–5
Primary cells96-well plate5×10⁴ cells/well4–24 h2×10⁶3–5
3D spheroids96-well ULA plate500–2,000 cells/spheroid24–72 h20–50 spheroids3–5
Organoids96-well ULA plate100–500 organoids/well24–96 h50–100 organoids3–5

For rare or precious samples, we offer optimized microextraction protocols that reduce minimum cell requirements by up to 10-fold. Contact our scientific team to discuss your specific sample type and project requirements.

Bioinformatics and Data Analysis

Our bioinformatics pipeline transforms raw metabolomics data into actionable biological insights through a structured, multi-layered analysis approach.

Data Processing and Quality Control

Raw MS data processed using XCMS (untargeted) or TraceFinder/Skyline (targeted). Key QC metrics include: QC sample RSD distribution (target: >70% of features with RSD < 30%), internal standard response stability (CV < 20%), blank subtraction, and batch correction using QC-based normalization (LOESS or SERRF).

Statistical Analysis

Univariate: Student's t-test or Mann-Whitney U test with FDR correction (Benjamini-Hochberg); fold-change analysis; volcano plot visualization. Multivariate: PCA (unsupervised), PLS-DA and OPLS-DA (supervised); model validation by 7-fold cross-validation and permutation testing (n = 200). ROC analysis for biomarker candidate evaluation.

Pathway and Network Analysis

Significantly altered metabolites mapped onto KEGG, HMDB, and Reactome pathways. Pathway enrichment scores (Fisher's exact test), pathway impact scores (MetaboAnalyst), and metabolite set enrichment analysis (MSEA). Results visualized as pathway enrichment bar charts, metabolic network maps, and KEGG pathway diagrams with metabolite-level fold-changes overlaid.

Multi-Omics Integration

Cellular metabolomics data can be integrated with transcriptomics, proteomics, or phosphoproteomics datasets from the same experimental system. We apply correlation-based network analysis and pathway-level co-enrichment to identify coordinated molecular changes across omics layers.

For high-throughput applications, see our HT metabolite profiling service. For enzyme-level mechanistic studies, visit our enzyme activity and mechanism analysis page.

FAQ

Frequently Asked Questions

Q: What types of cells can be used for cellular metabolomics screening?

We support a wide range of cell models, including adherent and suspension cell lines, primary cells (from blood, tissue, or biopsy), iPSC-derived cells, 3D spheroids, tumor organoids, and co-culture systems. Over 50 cell types have been validated in our platform. Contact us to discuss your specific cell model.

Q: What is the difference between untargeted and targeted cellular metabolomics?

Untargeted metabolomics provides unbiased global profiling of all detectable metabolites (2,000–5,000 features), ideal for discovery and hypothesis generation. Targeted metabolomics provides absolute quantification of predefined metabolite panels using isotope-labeled internal standards, ideal for hypothesis testing and biomarker validation. Many projects benefit from a combined approach: untargeted discovery followed by targeted validation.

Q: How many metabolites can be detected in a typical cellular metabolomics experiment?

In untargeted mode, we detect 2,000–5,000 metabolic features, of which 300–800 are confidently annotated against spectral libraries and databases. In targeted mode, our panels cover 50–200 predefined metabolites depending on the panel, with absolute quantification using stable isotope-labeled internal standards.

Q: Can you measure both polar metabolites and lipids from the same sample?

Yes. We use a biphasic extraction method (methanol/chloroform/water) that separates polar metabolites (aqueous phase) from lipids (organic phase), allowing both fractions to be analyzed from a single cell sample. Polar metabolites are analyzed by HILIC or C18 LC-MS, while lipids are analyzed by reverse-phase LC-MS. This approach maximizes metabolome coverage from limited sample material.

Q: How do you ensure data quality and reproducibility?

Our quality assurance framework includes: (1) pooled QC samples injected every 8–10 runs for signal drift monitoring, (2) extraction blanks and solvent blanks for contamination assessment, (3) stable isotope-labeled internal standards spiked into every sample for normalization, (4) randomized injection order to avoid batch effects, (5) RSD-based feature filtering (typically < 30% in QC samples), and (6) batch correction using LOESS or SERRF normalization for large studies.

Q: Can cellular metabolomics data be integrated with transcriptomics or proteomics data?

Yes. We routinely perform multi-omics integration using correlation-based network analysis and pathway-level co-enrichment. Metabolomics data can be correlated with gene expression (RNA-seq) or protein abundance (TMT/DIA proteomics) data from the same experimental system to identify coordinated metabolic and transcriptional responses to drug treatment.

References

  1. Al-Natour MA, Alazzo A, Ghaemmaghami AM, Kim DH, Alexander C. LC-MS metabolomics comparisons of cancer cell and macrophage responses to methotrexate and polymer-encapsulated methotrexate. Int J Pharm X. 2019;1:100036. doi:10.1016/j.ijpx.2019.100036. https://doi.org/10.1016/j.ijpx.2019.100036
  2. Pang H, Hu Z. Metabolomics in drug research and development: The recent advances in technologies and applications. Acta Pharm Sin B. 2023;13(8):3238-3251. doi:10.1016/j.apsb.2023.05.021. https://doi.org/10.1016/j.apsb.2023.05.021
  3. Zhang Z, Bao C, Jiang L, Wang S, Wang K, Lu C, Fang H. When cancer drug resistance meets metabolomics (bulk, single-cell and/or spatial): progress, potential, and perspective. Front Oncol. 2023;12:1054233. doi:10.3389/fonc.2022.1054233. https://doi.org/10.3389/fonc.2022.1054233
  4. Zhou J, Zhong L. Applications of liquid chromatography-mass spectrometry based metabolomics in predictive and personalized medicine. Front Mol Biosci. 2022;9:1049016. doi:10.3389/fmolb.2022.1049016. https://doi.org/10.3389/fmolb.2022.1049016

Plan your cellular metabolomics screening study with the MassTarget™ team

Tell us about your cell model, drug compound, and research questions — our scientists will design a tailored cellular metabolomics study for your discovery program.


For research use only. Not for use in diagnostic procedures. Creative Proteomics provides cellular metabolomics screening services exclusively for research and development purposes. Results are not intended for clinical diagnosis or medical decision-making.

Online Inquiry

Please submit a detailed description of your project. We will provide you with a customized project plan to meet your research requests. You can also send emails directly to for inquiries.

* Email
Phone
* Service & Products of Interest
Services Required and Project Description